. 2024 Apr;21(4):657-665.
doi: 10.1038/s41592-024-02203-y. Epub 2024 Feb 26.

Bright and stable monomeric green fluorescent protein derived from StayGold

Affiliations

Bright and stable monomeric green fluorescent protein derived from StayGold

Hanbin Zhang et al. Nat Methods. 2024 Apr.

Abstract

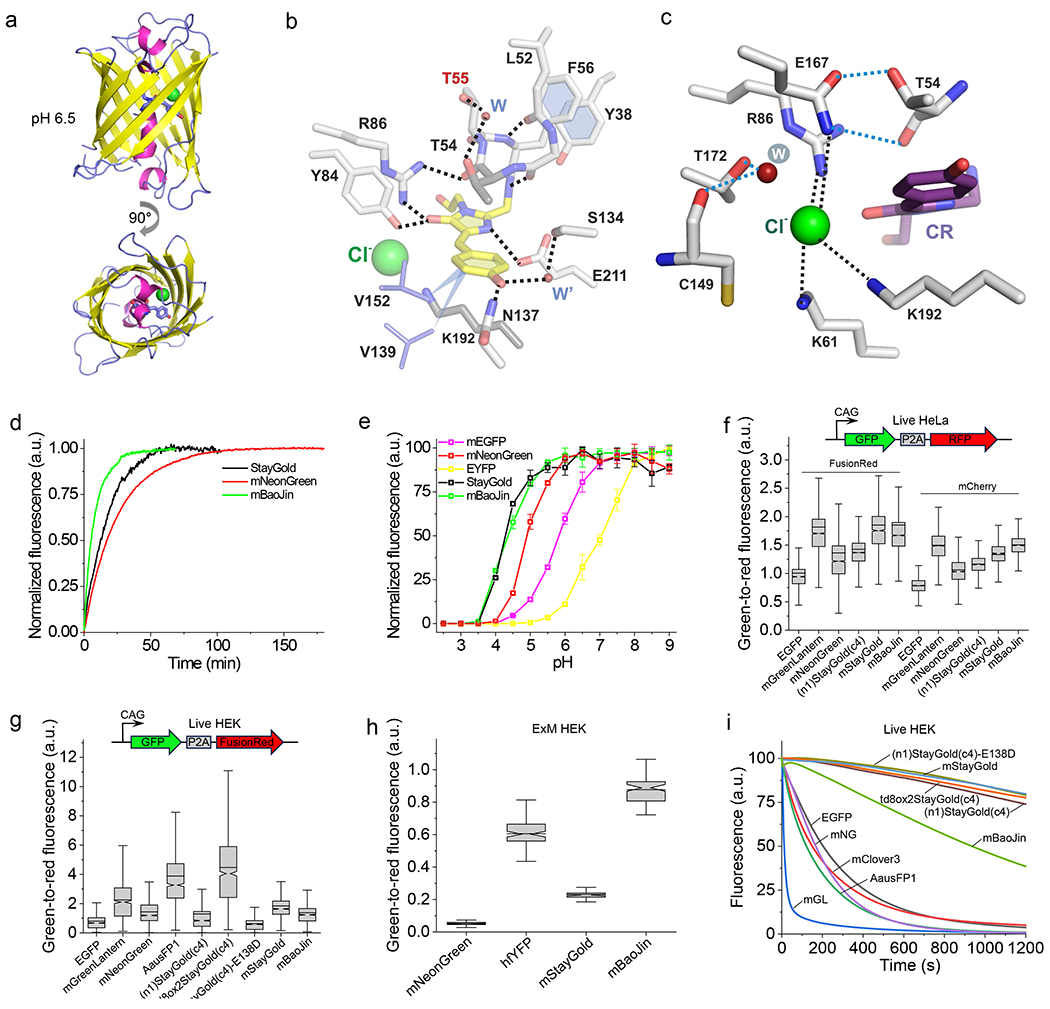
The high brightness and photostability of the green fluorescent protein StayGold make it a particularly attractive probe for long-term live-cell imaging; however, its dimeric nature precludes its application as a fluorescent tag for some proteins. Here, we report the development and crystal structures of a monomeric variant of StayGold, named mBaoJin, which preserves the beneficial properties of its precursor, while serving as a tag for structural proteins and membranes. Systematic benchmarking of mBaoJin against popular green fluorescent proteins and other recently introduced monomeric and pseudomonomeric derivatives of StayGold established mBaoJin as a bright and photostable fluorescent protein, exhibiting rapid maturation and high pH/chemical stability. mBaoJin was also demonstrated for super-resolution, long-term live-cell imaging and expansion microscopy. We further showed the applicability of mBaoJin for neuronal labeling in model organisms, including Caenorhabditis elegans and mice.


Conflict of interest statement

Competing interests

K.D.P. is the co-founder of a company that pursues commercial applications of expansion microscopy and is listed as an inventor on several patent applications concerning the development of new expansion microscopy methods. All other authors have no competing interests.

Figures

Figure 1.
Figure 1.. Monomerization of the StayGold protein.
(a) Linear map of expression cassettes in the pWA21cBP vector design for screening of monomeric StayGold variants. (b) Proposed model for reporter gene expression regulation using the engineered vector shown in a. (c) Fluorescence images of bacterial streaks expressing the selected mutants using the pWA21cBP vector in blue and green channels. (d) FPLC chromatograms for the variants shown in panel c. BSA (66 kDa), papain (23 kDa), and lysozyme (14 kDa) were used as molecular weight standards. (e) FPLC chromatograms of the mBaoJin, mNeonGreen, and original StayGold proteins. Insert shows calibration curve for molecular mass calculation. BSA (66 kDa), mNeonGreen (31 kDa), and lysozyme (14 kDa) were used as molecular weight standards. (f) Representative images of live HeLa cells expressing CytERM fusions of EGFP, mGreenLantern, mEGFP, mClover3, Venus, td8oxStayGold, StayGold-E138D, mStayGold and mBaoJin (n=1497, 1744, 2569, 1383, 1585, 1478, 2211, 2107, 1744 cells from three independent transfections from 3 independent cultures each, respectively, image 12 h post-transfection; values indicate fraction of normal cells ± SD (see Supplementary Table 1 for complete descriptive statistics); dynamic range of all images was adjusted independently to facilitate visualization of fine structures). Scale bars, 10 μm.
Figure 2.
Figure 2.. Structure and biochemical properties of purified mBaoJin and its behavior in mammalian cells.
(a) Overall 3D structure of mBaoJin at pH 6.5 (green sphere, chloride anion). (b) Immediate chromophore environment at pH 6.5. (c) Chloride binding pocket in mBaoJin at pH 6.5. (d) Fluorescence maturation kinetics in solution at 37°C (n = 4, 4, and 3 biological replicates for StayGold, mBaoJin, and mNeonGreen, respectively; solid line, averaged curve; fluorescence was normalized to the maximum intensity value of corresponding FP). (e) Fluorescence pH stability measured in the presence of 300 mM NaCl (n = 3 technical replicates each; squares, mean; error bars, SD; fluorescence was normalized to the maximum intensity value of corresponding FP). (f) Normalized intracellular brightness in live HeLa cells (n = 3427, 3353, 3066, 3064, 2196, 3305, 3304, 3722, 3310, 3718, 2234, 3235 cells for EGFP, mGreenLantern, mNeonGreen, (n1)StayGold(c4), mStayGold, mBaoJin with FusionRed and mCherry respectively, from 8 independent transfections from 4 independent cultures each except for mStayGold (4 independent transfections from 2 independent cultures); top of the panel, schematics of the used expression cassette; brightness for each FP was normalized to the FusionRed or mCherry signal; expression time 45-46 h). Box plots with notches used in panels f, g, and h (see Methods for description). (g) Normalized intracellular brightness in live HEK cells imaged using standard GFP filter (n = 1390, 1076, 1658, 1216, 1475, 1290, 1354, 1301, and 1604 cells for EGFP, mGreenLantern, mNeonGreen, AausFP1, (n1)StayGold(c4), td8oxStayGold, (n1)StayGold(c4)-E138D, mStayGold, mBaoJin from four independent transfections from two independent cultures each; schematic of the used expression cassette (top); brightness for each FP was normalized to the FusionRed signal; expression time 23-26 h). (h) Green-to-red fluorescence of ExM treated HEK cells co-expressing GFPs with mChilada RFP (n = 85, 87, 81, 81 cells for mNeonGreen, hfYFP, mStayGold, mBaoJin, respectively, from one independent transfection each). (i) Photobleaching curves in live HEK cells under wide-field illumination (n=80 cells from 4 independent transfections from 2 independent cultures each; fluorescence was normalized to the intensity value of corresponding FP at t = 0 s and was not corrected for emission rates).
Figure 3.
Figure 3.
mBaoJin enables long-term super-resolution imaging of live HeLa cells. (a-f) Confocal images of HeLa cells expressing mBaoJin fusions with (a) vimentin, (b) mitochondrial presequence of human cytochrome c oxidase subunit VIII, (c) H2B (lower panel shows mitotic nuclei), (d) keratin, (e) α-tubulin, (f) β-actin (n= 10, 9, 12, 4, 55, 23 cells from 4, 3, 2, 2, 4, and 2 independent transfections, respectively). Scale bars, 10 μm. (g) Long-term confocal super-resolution imaging of tubulin dynamics using CSU-W1 SoRa imaging setup at 16 mW/mm2 (n = 32 cells from 6 independent transfections from 2 cultures; imaging frequencies 0.2 Hz). Scale bars, 1 μm. (h) Photobleaching curves of tubulin microtubules during the experiment shown in g (n = 28, 32 cells from 2, 6 independent transfections from 1, 2 cultures for mNeonGreen and mBaoJin, respectively; solid line, mean; shaded area, standard deviation; fluorescence was normalized to the intensity value of corresponding FP at t = 0 s). (i) Representative images of HeLa cell expressing mBaoJin-actin under widefield (left) and SIM (right) microscopy (n=4 cells from 2 independent transfection). Scale bars, 10 μm. (j) Magnified views of boxed regions in i. (k) Quantification of line cuts in j. (l) Photobleaching curves for mBaoJin and mNeonGreen during SIM imaging of live cells at indicated light powers (n=3 cells for each condition for each protein from 2 independent transfections; fluorescence was normalized to the intensity value of corresponding FP at t = 0 s and was not corrected for molecular brightness and excitation spectrum). (m-o) ExM images of mBaoJin localized in mitochondria (m; n = 25 cells from four independent transfections from four independent cultures) and tubulin (n; n = 10 cells from two independent transfections from one culture) in HeLa cells and in neurons (o; n = 2 slices from two mice) in the mouse brain tissue. Scale bars, 5 μm (linear expansion factor 3.5x), 10 μm (linear expansion factor 4.2x), 20 μm (linear expansion factor 5.3x).
Figure 4.
Figure 4.
Characterization of mNeonGreen and mBaoJin in neurons in live C. elegans. (a) Representative fluorescence images of live C. elengans co-expressing mNeonGreen and mTagBFP2 in neurons and mScarlet in the nucleus of muscle cells (n=5 worms from one transgenic line). Scale bar, 25 μm. (b) Representative fluorescence images of live C. elengans co-expressing mBaoJin and mTagBFP2 in neurons and mScarlet in nucleus of muscle cells (n=5 worms from one transgenic line). Scale bar, 25 μm. Dynamic range for images in a and b was adjusted independently to facilitate visualization and images were generated using maximum projection of z-stack acquired under confocal microscope. For brightness quantification see panel c. (c) Quantification of intracellular brightness of mNeonGreen and mBaoJin perfromed by normalization to mTagBFP2 brightness imaged under wide-field microscope (n=25 neurons from 5 worms each). Box plots with notches: narrow part of notch, median; top and bottom of the notch, 95% confidence interval for the median; top and bottom horizontal lines, 25% and 75% percentiles for the data; whiskers extend 1.5 × the interquartile range from the 25th and 75th percentiles; horizontal line, mean; outliers not shown but included in all calculations and available in the source datasets. (d) Photostability curves for mNeonGreen and mBaoJin under continuous wide-field illumination at 475/25 nm of 68 mW/mm2 (fluorescence was normalized to the intensity value of corresponding FP at t = 0 s and was not corrected for molecular brightness and excitation spectrum).
Figure 5.
Figure 5.
Characterization of the selected GFPs expressed in L2/3 cortical neurons in mouse brain tissue. (a) Representative confocal fluorescence images of fixed brain slices expressing GFPs-P2A-FusionRed (n = 4 slices from two mice for each protein). Imaging conditions, GFP: excitation 488 nm, emission 500–550 nm; FusionRed: excitation 561 nm, emission 580-620 nm. To facilitate visual comparison of FP localization, the dynamic range was adjusted independently for each image and images were generated through maximum projection. Scale bars, 20 μm. (b) Intracellular normalized brightness of GFPs imaged in acute brain slices from 7-week-old mice (n = 284, 403, 398, 249, 397 neurons for StayGold, StayGold-E138D, mNeonGreen, mStayGold, mBaoJin from 3 slices one mice for each protein). Brightness for each FP was normalized to the FusionRed signal (imaging conditions same as in a). Box plots with notches used in panels c and d: narrow part of notch, median; top and bottom of the notch, 95% confidence interval for the median; top and bottom horizontal lines, 25% and 75% percentiles for the data; diamonds, individual data points; whiskers extend 1.5 × the interquartile range from the 25th and 75th percentiles; horizontal line, mean; outliers not shown but included in all calculations and available in the source datasets. (c) Intracellular normalized brightness of GFPs imaged in PFA-fixed brain slices from 7-week-old mice (n = 6 field of views from two slices from two mice for each protein). Brightness for each FP was normalized to the FusionRed signal (imaging conditions same as in a). (d) Normalized photobleaching curves of GFPs measured in PFA-fixed brain slices (n = 4 field of views from two slices for two mice for each protein; fluorescence was normalized to the intensity value of corresponding FP at t = 0 s and was not corrected for molecular brightness and excitation spectrum). Imaging conditions, excitation 475/28 nm at 25.9 mW mm−2, emission 535/46 nm.

References

    1. Jacquemet G, Carisey AF, Hamidi H, Henriques R & Leterrier C The cell biologist’s guide to super-resolution microscopy. J. Cell Sci 133, (2020). - PubMed
    1. Hirano M et al. A highly photostable and bright green fluorescent protein. Nat. Biotechnol. 2022 407 40, 1132–1142 (2022). - PMC - PubMed
    1. Bustos SA & Schleif RF Functional domains of the AraC protein. Proc. Natl. Acad. Sci. U. S. A 90, 5638–5642 (1993). - PMC - PubMed
    1. Costantini LM, Fossati M, Francolini M & Snapp EL Assessing the Tendency of Fluorescent Proteins to Oligomerize Under Physiologic Conditions. Traffic 13, 643–649 (2012). - PMC - PubMed
    1. Ando R et al. StayGold variants for molecular fusion and membrane-targeting applications. Nat. Methods 1–9 (2023) doi:10.1038/s41592-023-02085-6. - DOI - PMC - PubMed

LinkOut - more resources