. 2024 Feb 26;15(1):1724.
doi: 10.1038/s41467-024-46082-5.

Interplay between coding and non-coding regulation drives the Arabidopsis seed-to-seedling transition

Affiliations

Interplay between coding and non-coding regulation drives the Arabidopsis seed-to-seedling transition

Benjamin J M Tremblay et al. Nat Commun. .

Abstract

Translation of seed stored mRNAs is essential to trigger germination. However, when RNAPII re-engages RNA synthesis during the seed-to-seedling transition has remained in question. Combining csRNA-seq, ATAC-seq and smFISH in Arabidopsis thaliana we demonstrate that active transcription initiation is detectable during the entire germination process. Features of non-coding regulation such as dynamic changes in chromatin accessible regions, antisense transcription, as well as bidirectional non-coding promoters are widespread throughout the Arabidopsis genome. We show that sensitivity to exogenous ABSCISIC ACID (ABA) during germination depends on proximal promoter accessibility at ABA-responsive genes. Moreover, we provide genetic validation of the existence of divergent transcription in plants. Our results reveal that active enhancer elements are transcribed producing non-coding enhancer RNAs (eRNAs) as widely documented in metazoans. In sum, this study defining the extent and role of coding and non-coding transcription during key stages of germination expands our understanding of transcriptional mechanisms underlying plant developmental transitions.


Conflict of interest statement

The authors declare no competing interests.

Figures
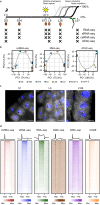
Fig. 1
Fig. 1. Profiling transcription initiation during the seed-to-seedling transition.
a Schematic overview of the sampled time-points for the csRNA-seq, sRNA-seq, RNA-seq and ATAC-seq experiments overlaid on data showing the timing of key markers of the seed-to-seedling transition in Col-0 seed. In total 6 time-points were selected: dry seeds (DS), seeds stratified in water for 24 h (S24) and 72 h (S72) in the dark at 4 °C, and germinating seeds 6 h (L6), 26 h (L26), and 57 h (L57) after being moved to the light at 22 °C. b Principal component analyses of all samples for the csRNA-seq, RNA-seq and ATAC-seq datasets. Two additional genotypes are included which were sampled at the same time as L57: hen2-4 and rrp4-2. c smFISH in 1 h imbibed seeds (S1), germinating seeds 6 h after being moved to the light (L6), and 7 d seedling roots (L168) using probes for the unspliced RNA of a gene showing csRNA-seq expression during all time-points (AT1G04170; Supplementary Fig. 1e). The scale bar represents 10 µm. Brighter spots in the nucleus (see arrows) represent active transcription sites in germinating seeds, whereas smaller bright dots in the surrounding area likely indicate spliced transcripts bound by a smaller number of exonic-only probes (28 / 48 total probes). An RNase control image of the S1 sample is shown in Supplementary Fig. 1d. Experiments were repeated independently at least two times. d Heatmaps and average metagene plots showing the presence of read density across all detected protein coding genes in the L57 time-point of the csRNA-seq, sRNA-seq, RNA-seq and ATAC-seq. These data are compared to previously published GRO-cap and CAGE data obtained from Arabidopsis seedlings,. Read density is scaled independently for each dataset between the 0th and 90th percentiles (shown as min and max, respectively).
Fig. 2
Fig. 2. Combined csRNA-seq and ATAC-seq analysis reveals dynamics of gene regulatory programs and non-coding transcription during the seed-to-seedling transition.
a Heatmap of developmental clusters from the csRNA-seq time-series. Rows represent Z-scores of the expression of individually annotated TSSs. Associated genes were enriched for overrepresented gene ontology terms, followed by an individual keyword enrichment analysis to generate word clouds of overrepresented keywords to the right of the heatmap, with their size being proportional to the level of enrichment. b Heatmap of developmental clusters from the ATAC-seq time-series. Rows represent Z-scores of the accessibility of individual ACRs. A word cloud of enriched keywords from a gene ontology enrichment analysis for ACR-associated genes is shown on the right. c Comparison analyses of the csRNA-seq and ATAC-seq clusters. The left heatmap shows the Pearson correlation coefficient between the average Z-score profiles of each cluster. The right heatmap shows the Jaccard coefficient of the number of common associated genes of each cluster. Comparisons with significant overlap are marked with an asterisk (P-value < 10−6). Significance testing was performed using Fisher’s exact test without correction for multiple testing. d Proportion of annotated TSS types in the csRNA-seq clusters. e Proportion of annotated ACR types in the ATAC-seq clusters.
Fig. 3
Fig. 3. The timing of ABA sensitivity during germination is regulated by promoter DNA accessibility.
a Enrichment of discovered motifs from the promoters of TSSs found in the csRNA-seq clusters as well as the ACRs found in the ATAC-seq clusters. A heatmap shows the level of enrichment (−log10 adjusted P-value) of the motif in each cluster, with each row representing a unique motif (shown to the right using an information content motif logo). The density of the motifs is shown to demonstrate their positional preference in promoters. The best matching known binding transcription and/or element name is included on the right. P-values were calculated using one-sided Fisher’s exact tests with FDR correction for multiple testing. b, c Violin plots of Z-scores of csRNA-seq and ATAC-seq data for TSSs and their overlapping ACRs, respectively, containing the M1 or M2 motifs. The lower, middle and upper hinges correspond to first quartile, median, and third quartile, respectively. The lower and upper whiskers extend to the minimal/maximal value respectively or 1.5 times the interquartile range, whichever is closer to the median. P-values were calculated using two-sided Mann–Whitney tests with Holm correction for multiple testing (n.s. = not significant, **p < 0.01, ****p < 0.0001). d ATAC-seq and ABI5 DAP-seq, read coverage density tracks for the DS, L6, L26 and L57 time-points for the genes ABI5, EM1, and EM6 (units in RPM). Below these are plotted the corresponding csRNA-seq (in black) and ATAC-seq (in blue) quantification data for the respective TSSs and promoter-associated ACRs.
Fig. 4
Fig. 4. Characteristics of non-coding transcription during the seed-to-seedling transition.
a Pie chart of annotated TSS types from the csRNA-seq. TSSs associated with an existing Araport11 TSS were annotated as either mRNA, lncRNA or Other ncRNA. The remaining TSSs were annotated as either Putative lncRNA (when a putative transcript could be reconstructed from the RNA-seq) or Unstable TSS (when transcript reconstruction was not possible). b Pie charts of the positional contexts of non-coding TSSs (lncRNA, Putative lncRNA and Unstable TSS). Features which did not overlap any protein coding gene were annotated as Intergenic. Features which overlapped a protein coding gene were annotated as Intragenic, and as either sense or antisense in brackets to denote the relative orientation to the overlapping gene. c Average conservation of promoters by annotated TSS type (mRNA, lncRNA, Putative lncRNA, and Unstable TSS), using PhyloP scores calculated from 63 plant species. The coverage of scores is from 500 bp upstream and downstream of the primary TSS coordinate. d Heatmaps, and accompanying average profiles of external RNAPII, H3K4me3, and H3K9ac ChIP-seq datasets from Arabidopsis seedlings of the 4 kb area around protein coding TSSs. e A repeat of the plotting from (g), instead showing the non-coding annotated TSS types.
Fig. 5
Fig. 5. Global antisense transcription regulates gene expression during germination.
a Pie chart of the fraction of active protein coding genes with detected antisense csRNA-seq signal. b Plot of the distance of antisense TSSs from the primary gene TSS against the length of the gene. Each dot represents an individual gene-antisense pair, colored based on the following antisense classification: antisense TSSs within the first half of the gene body, as well as at least 1 kb from the gene TTS, are labeled as proximal (red). All others are marked as distal (black). c Schematic overview of the classification method for distinguishing proximal and distal antisense transcription, using the classification system from (b). d Smoothed average max log2 expression level of sense TSSs with an associated proximal or distal antisense plotted against the Pearson correlation coefficient between the expression of each sense/antisense pair. Smoothing was performed using a generalized additive model. The shaded area represents the 95% confidence interval of the model. e Heatmaps of external MNase-seq data from leaves at a random sample of 4000 active protein coding genes without a detected TSS (sorted by gene size), as well as genes with a proximal or distal antisense (sorted by sense/antisense inter-TSS distance). The gene lengths for genes with a detected antisense are plotted as horizontal bar plots to the right. MNase-seq read density is row-normalized between 0 and 1. f Heatmap of Z-scores of csRNA-seq quantification for sense and antisense TSSs for genes with a detected antisense TSS and a positive correlation between their expression (Pearson correlation coefficient greater than 0.5), split by the csRNA-seq cluster membership of the sense TSS. g Same as for (f), instead plotting genes where the correlation between the sense/antisense pairs are less than −0.25.
Fig. 6
Fig. 6. Analysis of bidirectional promoters reveals uncoordinated divergent transcription.
a Pie chart of the number of bidirectional promoters (when two opposite-facing TSSs are present within 500 bp of each other) by annotated TSS type: protein coding TSS (pcTSS) and non-coding TSS (ncTSS). b Smoothed Pearson correlation coefficient between bidirectional promoter TSS pairs, plotted against their inter-TSS distances. TSS pairs considered as bidirectional promoters (within 500 bp of each other) are demarcated using a red dashed line. Smoothing was performed using a local polynomial regression fitting. The shaded area represents the 95% confidence interval of the model. c Density plot of the ratio (on a log2 scale) of csRNA-seq signal between each pcTSS-ncTSS pair in divergent promoters, grouped by their Pearson correlation coefficient (anti-correlating: <−0.25; correlating: >0.25). Dashed lines represent the median ratio within each group. Significance testing between correlation groups was performed using two-sided Mann–Whitney tests with Holm correction for multiple testing. d Heatmaps of read density from the L57 csRNA-seq, hen2-4 RNA-seq, L57 ATAC-seq, as well as external RNAPII ChIP-seq from seedlings and MNase-seq from leaves at divergent promoters, ordered by inter-TSS distances. Data from the csRNA-seq and RNA-seq are row-normalized between −1 and 1, and between 0 and 1 for the ATAC-seq, RNAPII ChIP-seq and MNase-seq datasets. A diagram explaining the process of generating these heatmaps in more detail can be found in Supplementary Fig. 7j. e csRNA-seq and RNA-seq read density coverage tracks from the S72 time-point showing the divergent promoter active for the gene AT1G04170 (units in RPM). f Close-up of the csRNA-seq track from (e) showing the divergent promoter and the distances between the T-DNA insertion and the TSSs in the SALK_201027C and SALK_073206 mutant lines. g RT-qPCR data of the AT1G04170 mRNA and its divergent ncRNA (Div. ncRNA) in Col-0 and SALK_201027C plants. RNA was extracted for both genotypes from dry seeds (DS), 72 h stratified seeds (S72), and 7 d old seedlings (L168). Data are normalized to the constitutively expressed gene RBP45B. Significance testing was performed using two-sided Student’s t-tests with Bonferroni correction for multiple testing. All experiments were performed with n = 3 biological replicates per time-point. Error bars show the standard deviation from the mean. h Same as in (g), instead comparing Col-0 and SALK_073206 plants.
Fig. 7
Fig. 7. Bidirectional non-coding promoters and transcriptional enhancers during germination.
a Heatmaps of read density from the L57 csRNA-seq, hen2-4 RNA-seq, L57 ATAC-seq, as well as external RNAPII ChIP-seq from seedlings and MNase-seq from leaves at bidirectional non-coding promoters, ordered by inter-TSS distances. Data from the csRNA-seq and RNA-seq are row-normalized between −1 and 1, and between 0 and 1 for the ATAC-seq, RNAPII ChIP-seq and MNase-seq datasets. These heatmaps were generated in a similar fashion to those found in Fig. 6d, except centering the distance 0 point around the midpoint between the two TSSs. b csRNA-seq (top, blue/green), RNA-seq (middle, blue/green) and ATAC-seq (bottom, gray) read density coverage tracks (units in RPM) of the L26 sample showing an intergenic bidirectional non-coding promoter (highlighted in yellow) upstream of the gene SPT. c Same as (b), showing an intragenic bidirectional non-coding promoter present within the intron of the gene BRD13 in the L26 sample. d Same as (b), showing a bidirectional non-coding promoter present within a ATCOPIA77-family transposable element in the hen2-4 (csRNA-seq, RNA-seq) and L57 (ATAC-seq) samples. e Same as (b), showing an intragenic bidirectional non-coding promoter present within the single exon gene SLP2 in the DS sample. f Read density heatmaps of various sequencing datasets for the top 500 and bottom 500 (by total signal intensity) candidate enhancers in the L57 sample. Line plots comparing the relative average for each are shown above. The accessibility heatmap is ATAC-seq read density from the L57 sample. All other datasets are from previously published studies, including the H3K27me3 ChIP-seq, nucleosome/MNase-seq, H3K9ac ChIP-seq, H3K4me1 ChIP-seq, H3K4me3 ChIP-seq, H3K36me3 ChIP-seq, H2AZ ChIP-seq, and H2AK121ub ChIP-seq samples.

Similar articles

Cited by

References

    1. Fujii H, et al. In vitro reconstitution of an abscisic acid signalling pathway. Nature. 2009;462:660–664. - PMC - PubMed
    1. Nakabayashi K, Okamoto M, Koshiba T, Kamiya Y, Nambara E. Genome-wide profiling of stored mRNA in Arabidopsis thaliana seed germination: Epigenetic and genetic regulation of transcription in seed. Plant J. 2005;41:697–709. - PubMed
    1. Née G, et al. DELAY OF GERMINATION1 requires PP2C phosphatases of the ABA signalling pathway to control seed dormancy. Nat. Commun. 2017;8:72. - PMC - PubMed
    1. Dekkers BJW, et al. Transcriptional dynamics of two seed compartments with opposing roles in Arabidopsis seed germination. Plant Physiol. 2013;163:205–215. - PMC - PubMed
    1. Yamauchi Y, et al. Activation of Gibberellin biosynthesis and response pathways by low temperature during imbibition of Arabidopsis thaliana Seeds. Plant Cell. 2004;16:367–378. - PMC - PubMed

MeSH terms