. 2024 May;21(5):448-465.
doi: 10.1038/s41423-024-01134-0. Epub 2024 Feb 27.

Targeting PHGDH reverses the immunosuppressive phenotype of tumor-associated macrophages through α-ketoglutarate and mTORC1 signaling

Affiliations

Targeting PHGDH reverses the immunosuppressive phenotype of tumor-associated macrophages through α-ketoglutarate and mTORC1 signaling

Zhengnan Cai et al. Cell Mol Immunol. 2024 May.

Abstract

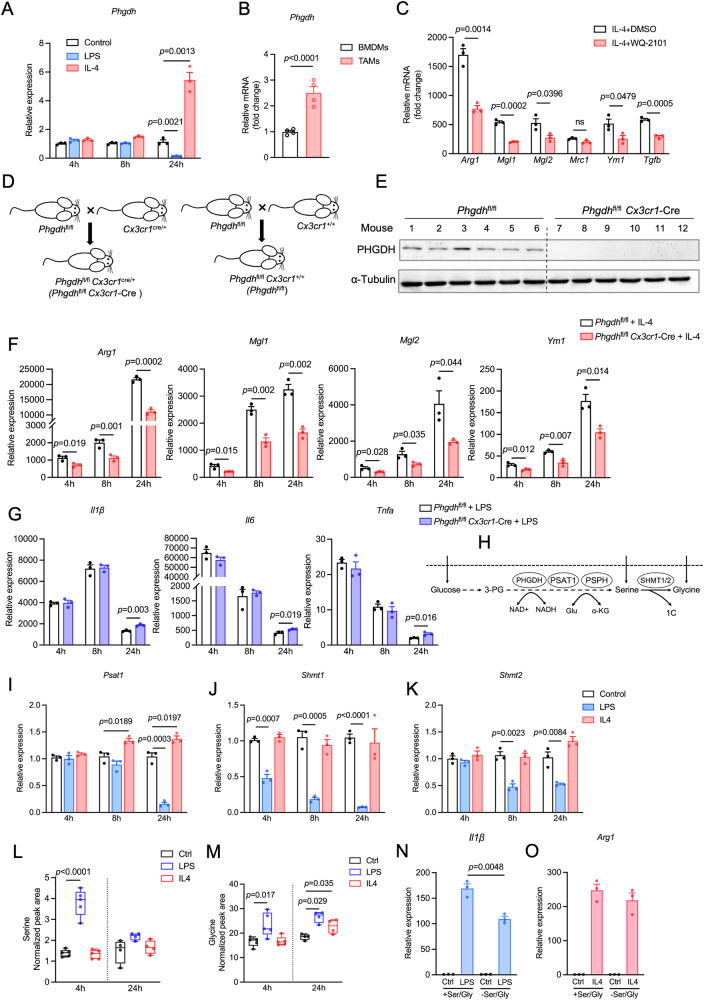
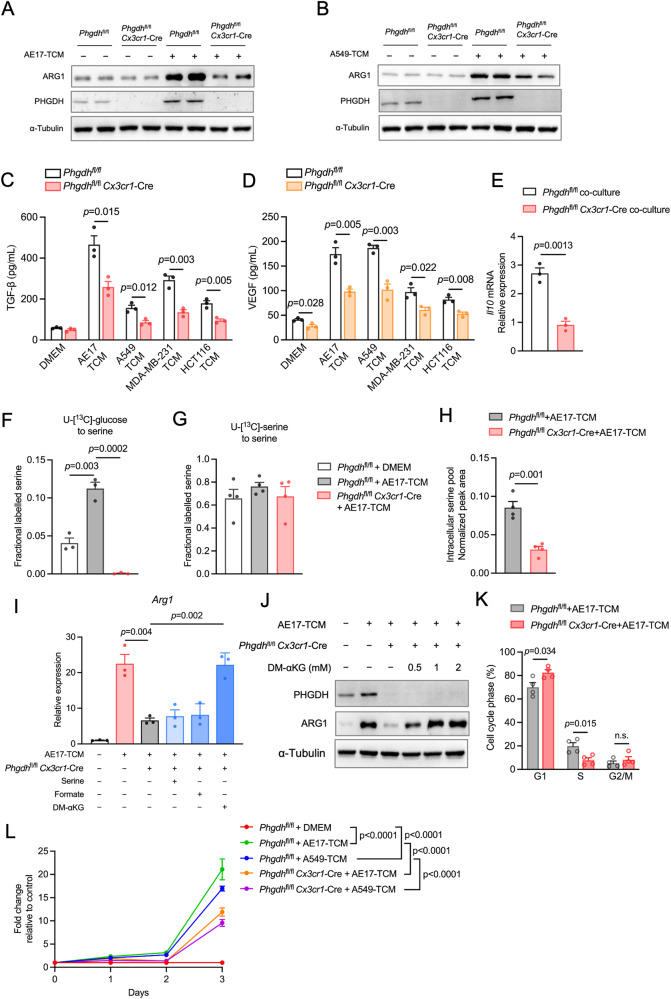
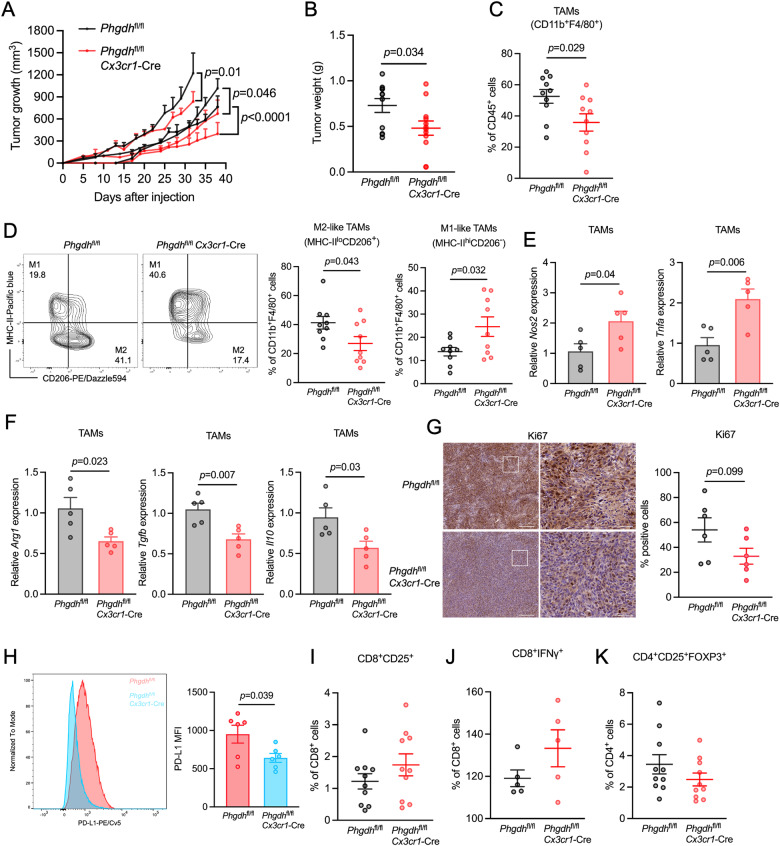
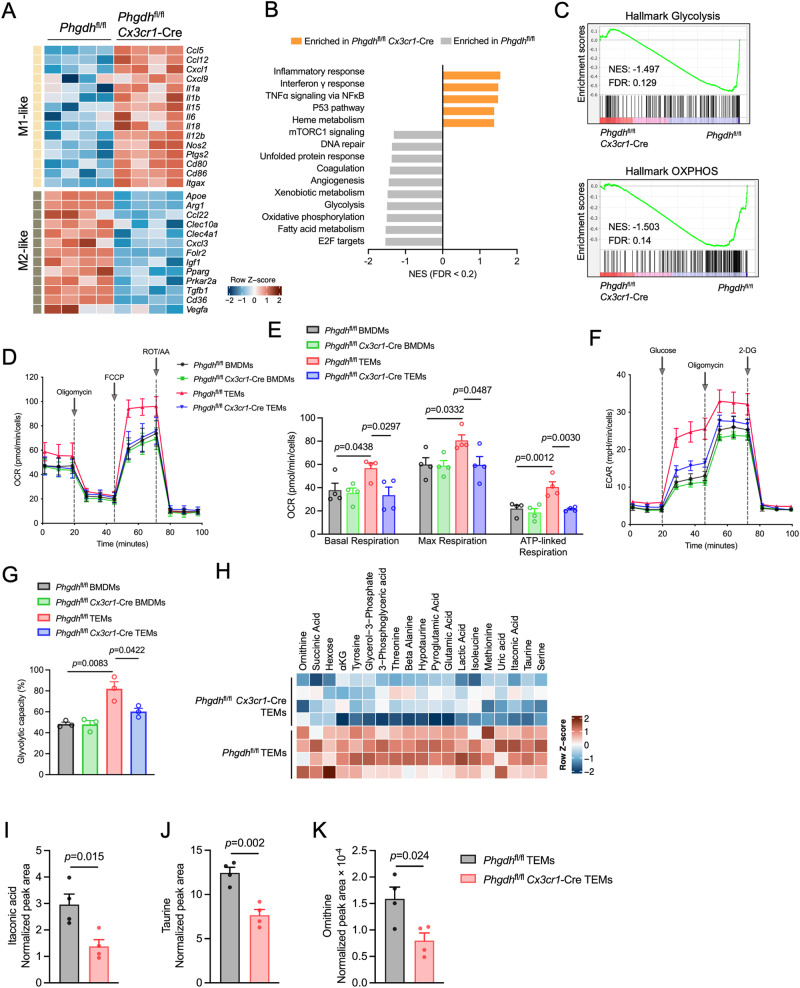
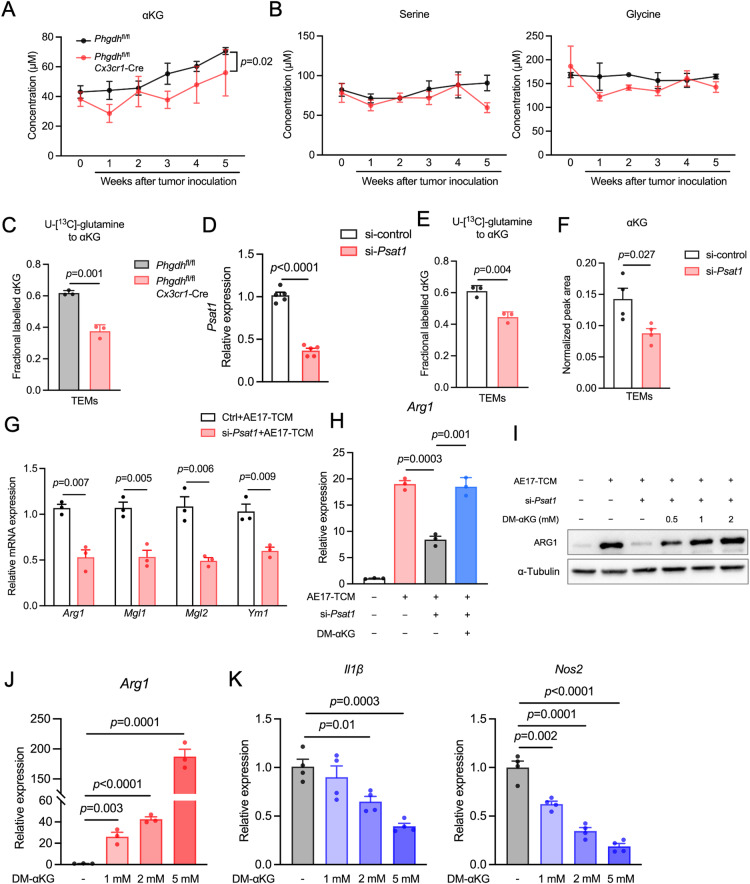
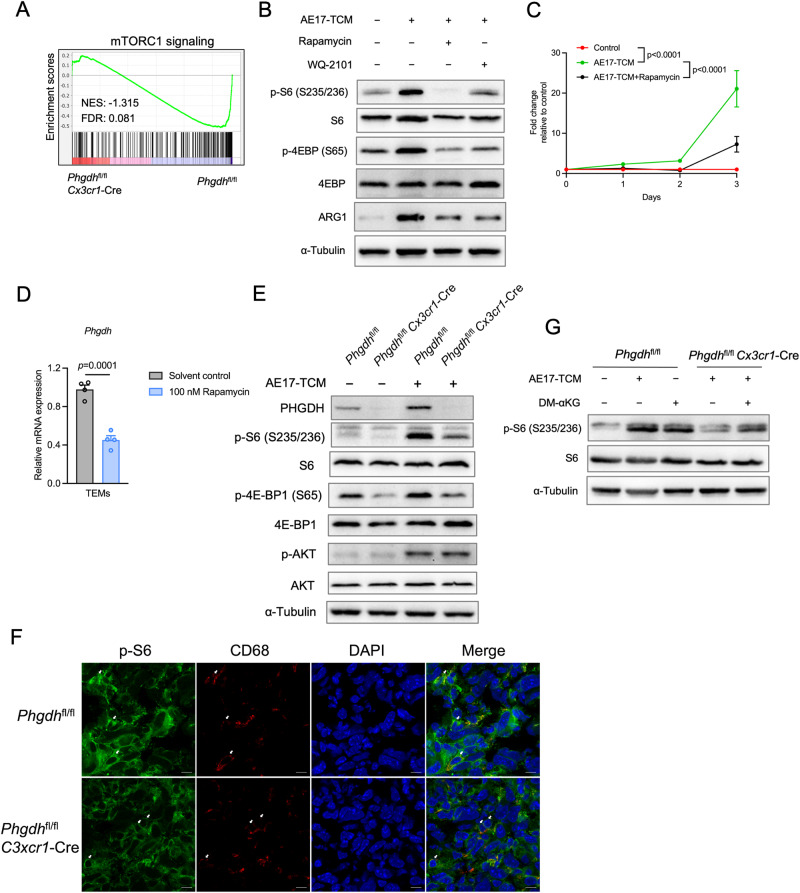
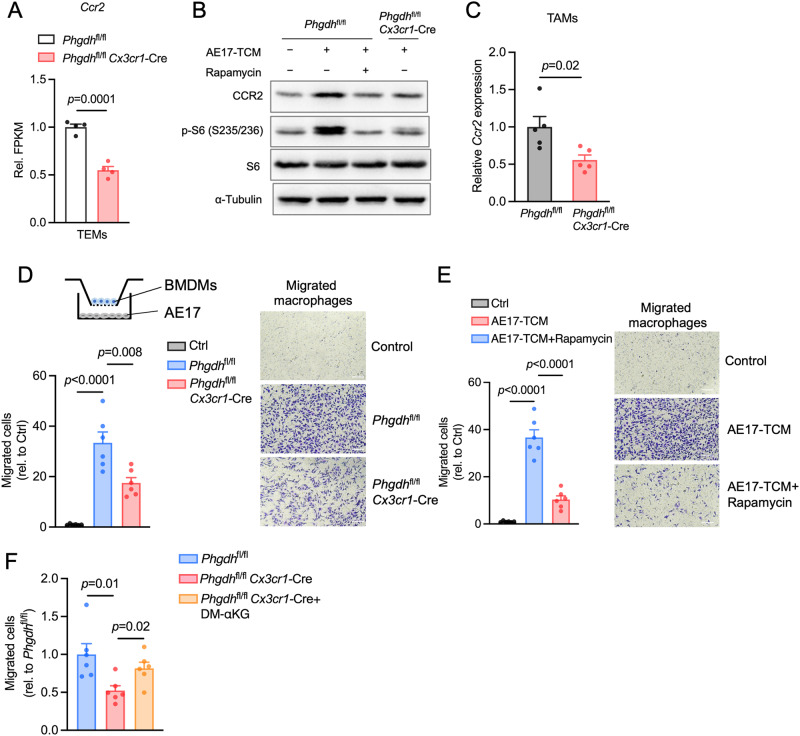
Phosphoglycerate dehydrogenase (PHGDH) has emerged as a crucial factor in macromolecule synthesis, neutralizing oxidative stress, and regulating methylation reactions in cancer cells, lymphocytes, and endothelial cells. However, the role of PHGDH in tumor-associated macrophages (TAMs) is poorly understood. Here, we found that the T helper 2 (Th2) cytokine interleukin-4 and tumor-conditioned media upregulate the expression of PHGDH in macrophages and promote immunosuppressive M2 macrophage activation and proliferation. Loss of PHGDH disrupts cellular metabolism and mitochondrial respiration, which are essential for immunosuppressive macrophages. Mechanistically, PHGDH-mediated serine biosynthesis promotes α-ketoglutarate production, which activates mTORC1 signaling and contributes to the maintenance of an M2-like macrophage phenotype in the tumor microenvironment. Genetic ablation of PHGDH in macrophages from tumor-bearing mice results in attenuated tumor growth, reduced TAM infiltration, a phenotypic shift of M2-like TAMs toward an M1-like phenotype, downregulated PD-L1 expression and enhanced antitumor T-cell immunity. Our study provides a strong basis for further exploration of PHGDH as a potential target to counteract TAM-mediated immunosuppression and hinder tumor progression.

Keywords: PHGDH; de novo serine synthesis; mTORC1; protumorigenic; tumor-associated macrophages, metabolomics; α-ketoglutarate.


Conflict of interest statement

The authors declare no competing interests.

Figures

Fig. 1
Fig. 1
PHGDH deficiency suppresses IL-4-induced M2 polarization but exacerbates LPS-induced proinflammatory activation. A qPCR analysis of Phgdh mRNA in murine wild-type (WT) BMDMs incubated with DMEM (control), IL-4 (20 ng/mL), or LPS (100 ng/mL) for 4 h (hours), 8 h and 24 h (n = 3 independent experiments). B qPCR analysis of Phgdh mRNA in TAMs (CD11b+F4/80+) sorted from AE17 mesothelioma cells and BMDMs (control) from nontumor-bearing mice (n = 4 biologically independent samples). C qPCR analysis of M2 markers in IL-4-induced BMDMs treated with dimethyl sulfoxide (DMSO) or 25 μM WQ-2101 for 24 h (n = 3 independent experiments). The data are expressed as the fold change relative to the control (DMEM-treated WT BMDMs). D Generation of macrophage-specific Phgdh knockout mice (Phgdhfl/fl Cx3cr1-Cre) by crossing Phgdhfl/fl mice with mice expressing the Cre recombinase under the control of the Cx3cr1 promotor (Cx3cr1cre/+) and control mice (Phgdhfl/fl) by crossing Phgdhfl/fl mice with Cx3cr1+/+ mice. E Western blot analysis of PHGDH protein expression in BMDMs from PHGDH-deficient mice (Phgdhfl/fl Cx3cr1-Cre) and control mice (Phgdhfl/fl). F qPCR analysis of M2 markers in IL-4-treated PHGDH-deficient BMDMs and IL-4-stimulated Phgdhfl/fl BMDMs after 4, 8 and 24 h (n = 3 biologically independent samples). The data are expressed as the fold change relative to the control (DMEM-treated Phgdhfl/fl BMDMs). G qPCR analysis of M1 markers in LPS-stimulated PHGDH-deficient BMDMs and LPS-stimulated Phgdhfl/fl BMDMs after 4 h, 8 h, and 24 h (n = 3 biologically independent samples). The data are expressed as the fold change relative to the control (DMEM-treated Phgdhfl/fl BMDMs). H Schematic of serine metabolism, including de novo serine synthesis and one-carbon units. qPCR analysis of Psat1 (I), Shmt1 (J) and Shmt2 (K) in wild-type (WT) BMDMs incubated with DMEM (control), IL-4 (20 ng/mL), or LPS (100 ng/mL) for 4 h, 8 h or 24 h (n = 3 independent experiments). Intracellular levels of serine (L) and glycine (M) in extracts of BMDMs stimulated with IL-4 (20 ng/mL), LPS (100 ng/mL) or DMEM (control) for 4 h and 24 h (n = 4 independent experiments). MS peak areas were normalized to internal standards and corresponding pellet protein concentrations. N, O qPCR analysis of Il1β (M) and Arg1 (N) in wild-type (WT) BMDMs stimulated with LPS (100 ng/mL) or IL-4 (20 ng/mL) for 4 h in complete DMEM or in complete serine and glycine-depleted (−SG) media (n = 3 independent experiments). The data are shown as the mean ± SEM. Statistical significance was calculated using a two-tailed unpaired Student’s t test
Fig. 2
Fig. 2
PHGDH-mediated de novo serine synthesis supports M2-like TEM polarization and macrophage proliferation. Western blot detection of ARG1 and PHGDH in Phgdhfl/fl Cx3cr1-Cre BMDMs and Phgdhfl/fl BMDMs incubated with DMEM, AE17-TCM (A) or A549-TCM (B) for 24 h. Protein secretion of TGF-β (C) and VEGF (D) in PHGDH-deficient BMDMs and Phgdhfl/fl BMDMs incubated with AE17-TCM, A549-TCM, MDA-MB-231-TCM or HCT116-TCM for 24 h (n = 3 biologically independent samples). E qPCR analysis of Il-10 in PHGDH-deficient BMDMs and control BMDMs cocultured with AE17 cells for 24 h (n = 3 independent experiments). The data are expressed as the fold change relative to the control (Phgdhfl/fl BMDMs cocultured with DMEM). F 13C-labeling of serine in PHGDH-deficient BMDMs and Phgdhfl/fl BMDMs incubated with AE17-TCM for 24 h and then pulsed with U-[13C]-glucose for 2 h (n = 3 independent experiments). G 13C-labeling of serine in PHGDH-deficient BMDMs and Phgdhfl/fl BMDMs incubated with AE17-TCM for 24 h and then pulsed with U-[13C]-serine for 2 h (n = 3 independent experiments). H Intracellular level of serine in control BMDMs and PHGDH-deficient BMDMs (n = 4 independent experiments). I qPCR analysis of Arg1 expression in PHGDH-deficient BMDMs incubated with AE17-TCM supplemented with serine, formate or 1 mM dimethyl-α-ketoglutarate (DM-αKG) (n = 3 independent experiments). J Western blot analysis of PHGDH and ARG1 in PHGDH-deficient BMDMs incubated with AE17-TCM supplemented with 0.5 mM, 1 mM, 2 mM or without DM-αKG. K Cell cycle analysis of BMDMs from PHGDH-deficient and control mice by 7-AAD and BrdU staining (n = 4 independent experiments). n.s. nonsignificant. L PHGDH-deficient BMDMs and control BMDMs were treated with AE17-TCM or A549-TCM for the indicated days and then incubated for 1 h with CCK8 reagent (n = 4 biologically independent samples). The optical density (OD) was detected at 450 nm. The data were normalized to the control (DMEM-treated Phgdhfl/fl BMDMs) and are expressed as the fold change relative to the control. All the data are shown as the mean ± SEM. Statistical significance was calculated using a two-tailed unpaired Student’s t test
Fig. 3
Fig. 3
Macrophage-specific Phgdh ablation reduces tumor growth, TAM infiltration and polarization. A Tumor growth curves showing the mean tumor volume at the indicated timepoints following implantation of AE17 cells into Phgdhfl/fl (batch1, n = 5; batch2, n = 3; batch3, n = 3) and Phgdhfl/fl Cx3cr1-Cre (batch1, n = 5; batch2, n = 3; batch3, n = 4) mice. The data represent three independent experiments. B Tumor weights of mice injected with AE17 mesothelioma cells from A. The tumor data were collected on Day 32, Day 35 or Day 38 after tumor transplantation (Phgdhfl/fl, n = 11 in total; Phgdhfl/fl Cx3cr1-Cre, n = 12 in total). Each symbol represents one individual. C Flow cytometry analysis of the proportion of TAMs (CD45+CD11b+F4/80+) among tumors from Phgdhfl/fl (n = 10) and Phgdhfl/fl Cx3cr1-Cre mice (n = 10). The data represent three independent experiments. D Flow cytometry analysis of M1-like TAMs (MHC-IIhiCD206) and M2-like TAMs (MHC-IIloCD206+) from Phgdhfl/fl tumors (n = 9) and Phgdhfl/fl Cx3cr1-Cre tumors (n = 9). The data represent three independent experiments. qPCR analysis of the antitumorigenic markers Nos2 and Tnfa (E) and the protumorigenic markers Arg1, Tgfb, and Il10 (F) in TAMs sorted from mice with AE17 tumors (n = 5 tumors per condition). The data are expressed as the fold change relative to the control. The results represent two independent experiments. G Representative immunohistochemical (IHC) images (left) and quantification (right) of Ki67-stained cells in tumor sections from mice with AE17 mesothelioma tumors (n = 6 tumors per condition). The data represent two independent experiments. Scale bar, 200 µm (left), 50 µm (right). H Representative histogram (left) and quantitative plot (right) of PD-L1+ TAMs in tumor sections from mice with AE17 tumors (n = 6 tumors per condition). The data represent two independent experiments. Analysis of the proportions of activated CD8+ (CD3+CD8+CD25+) (I, n = 10 tumors per condition), CD8+IFNγ+ (J, n = 5 tumors per condition) and Treg (CD4+CD25+FOXP3+) (K, n = 10 tumors per condition) cells from mice with AE17 mesothelioma tumors. The results represent three independent experiments (I and K) or two independent experiments (J). All of the data are shown as the mean ± SEM. Statistical significance was calculated using two-way ANOVA with Tukey’s multiple comparison test (A) or a two-tailed unpaired Student’s t test (BK)
Fig. 4
Fig. 4
PHGDH deficiency modulates macrophage metabolic reprogramming. A Heatmap of M1 and M2 macrophage gene expression in Phgdhfl/fl Cx3cr1-Cre and Phgdhfl/fl BMDMs incubated with AE17-TCM for 24 h (n  =  4 biologically independent samples). B GSEA was conducted using hallmark gene sets from the Molecular Signatures Database of the Broad Institute. The analysis identified the most significantly enriched gene sets in Phgdhfl/fl Cx3cr1-Cre and control BMDMs. C GSEA plots of the glycolysis (up) and oxidative phosphorylation (OXPHOS) (down) gene signatures in Phgdhfl/fl Cx3cr1-Cre TEMs relative to Phgdhfl/fl TEMs from the analysis in B with their respective normalized enrichment scores (NES) and false discovery rates (FDR). D Oxygen consumption rate (OCR) of Phgdhfl/fl Cx3cr1-Cre BMDMs and control BMDMs incubated with AE17-TCM or DMEM for 24 h followed by exposure to the indicated bioenergetic modulators: oligomycin, carbonyl cyanide 4-(trifluoromethoxy) phenylhydrazone (FCCP), and rotenone/antimycin A (AA) (n = 4 independent experiments). The arrow denotes when the compounds were added. E Basal OCR, maximal OCR, and ATP-linked respiration from the trace in A. F Glycolysis stress analysis of Phgdhfl/fl Cx3cr1-Cre BMDMs and control BMDMs incubated with AE17-TCM or DMEM for 24 h before exposure to the indicated compounds: glucose, oligomycin, and 2-deoxy-D-glucose (2-DG) (n = 4 independent experiments). The arrow denotes when the compounds were added. G Glycolytic capacity of the trace in B. H Cellular levels of significantly reduced metabolites in PHGDH-deficient BMDMs compared to those in control BMDMs incubated with AE17-TCM for 24 h (n = 4 biologically independent samples). The color bar indicates the range of metabolite levels depicted by the Z score. GC‒MS analysis of the cellular metabolites itaconic acid (I), taurine (J) and ornithine (K) (n = 4 biologically independent samples). MS peak areas were normalized to the internal standard and corresponding pellet protein concentration. The data are shown as the mean ± SEM. Statistical significance was calculated using a two-tailed unpaired Student’s t test
Fig. 5
Fig. 5
De novo serine synthesis regulates the conversion of glutamate to αKG, contributing to the maintenance of an M2-like macrophage phenotype. The concentrations of αKG (A), serine (B) and glycine (B) in the serum of control and PHGDH-deficient mice at the indicated days post tumor inoculation. (n = 4 biologically independent samples). C 13C-labeling of αKG in PHGDH-deficient BMDMs and Phgdhfl/fl BMDMs incubated with AE17-TCM for 24 h and then pulsed with U-[13C]-glutamine for 2 h (n = 3 independent experiments). D qPCR analysis of Psat1 gene expression in RAW 264.7 macrophages subjected to Psat1 siRNA (si-Psat1) or nontargeting siRNA (si-control) treatment (n = 5 biologically independent samples). The data are expressed as the fold change relative to the control. E 13C-labeled αKG in si-Psat1 RAW and si-control RAW264.7 macrophages incubated with AE17-TCM for 24 h and then pulsed with U-[13C]-glutamine for 2 h (n = 3 independent experiments). F Cellular level of αKG in si-Psat1- and si-control RAW 264.7 macrophages incubated with AE17-TCM for 24 h, followed by GC‒MS (n = 3 biologically independent samples). G qPCR analysis of the M2 markers Arg1, Mgl1, Mgl2 and Ym1 in Psat1-knockdown and control macrophages incubated with AE17-TCM for 24 h (n = 3 biologically independent samples). The data are expressed as the fold change relative to the level in the AE17-TCM-treated si-control group. H qPCR analysis of Arg1 expression in Psat1-knockdown macrophages incubated with AE17-TCM supplemented with or without 1 mM DM-αKG (n = 3 independent experiments). I Western blot analysis of ARG1 in Psat1-knockdown macrophages incubated with AE17-TCM supplemented with (0.5 mM, 1 mM or 2 mM) or without DM-αKG. qPCR analysis of Arg1 (J), Il1β (K) and Nos2 (K) expression in Psat1-knockdown macrophages incubated with AE17-TCM supplemented with the indicated concentrations of DM-αKG (n = 3 biologically independent samples). The data are expressed as the fold change relative to the control. The data are shown as the mean ± SEM. All the data were analyzed using a two-tailed unpaired Student’s t test (CH, JK) or two-way ANOVA with Tukey’s multiple comparisons test (B)
Fig. 6
Fig. 6
The PHGDH-mediated SSP activates mTORC1 signaling in M2-like TAMs. A GSEA plot of the “mTORC1 signaling” gene signature in Phgdhfl/fl Cx3cr1-Cre TEMs relative to that in Phgdhfl/fl TEMs from the analysis in Fig. 4B with the respective NES and FDR. B Western blot analysis of the indicated proteins in WT BMDMs incubated with AE17-TCM supplemented with 100 nM rapamycin or 25 μM WQ-2101 for 24 h. C Phgdhfl/fl BMDMs were treated with AE17-TCM for the indicated days and then incubated for 1 h with CCK8 reagent (n = 4 biologically independent samples). The OD was detected at 450 nm. The data were normalized to the control (DMEM-treated Phgdhfl/fl BMDMs) and are expressed as the fold change. D qPCR analysis of Phgdh expression in AE17-TCM-treated BMDMs treated with or without 100 nM rapamycin for 24 h (n = 4 biologically independent samples). E Western blot analysis of the indicated proteins in PHGDH-deficient BMDMs and control BMDMs incubated with or without AE17-TCM for 24 h. F Representative images of cryosectioned AE17 tumors stained with antibodies against p-S6 (green) and CD68 (red) as well as the nuclear stain DAPI. Scale bar, 10 μm. G Western blot analysis of the indicated proteins in PHGDH-deficient BMDMs and control BMDMs incubated with AE17-TCM supplemented with or without 1 mM DM-αKG for 24 h. The data are shown as the mean ± SD (C) or SEM (D). The data were analyzed using two-way ANOVA with Tukey’s multiple comparisons test (C) or a two-tailed unpaired Student’s t test (D)
Fig. 7
Fig. 7
PHGDH depletion downregulates the expression of key chemotactic receptors on TAMs and impairs macrophage migration. A Relative FPKM (Rel. FPKM) of Ccr2 in PHGDH-deficient TEMs and control TEMs (n = 4 biologically independent samples) according to RNA-seq. B Western blot analysis of the indicated proteins in PHGDH-deficient BMDMs and control BMDMs incubated with AE17-TCM supplemented with or without 100 nM rapamycin for 24 h. C qPCR analysis of Ccr2 in TAMs sorted from mice with AE17 tumors (n = 5 tumors per condition). The data are expressed as the fold change relative to the WT. The results represent two independent experiments. D Scheme of the Transwell system with PHGDH-deficient BMDMs in the upper chamber and AE17 cells in the bottom chamber. The migration of macrophages was quantified 24 h after seeding (n = 6 random fields for each condition for two independent experiments with similar results). Scale bars, 100 µm. E Quantification of PHGDH-deficient macrophages incubated with or without 100 nM rapamycin that had migrated across a Transwell insert following coculture with AE17 cells (n = 6 random fields for each condition for two independent experiments with similar results). Scale bars, 100 µm. F Quantification of PHGDH-deficient macrophages that migrated across a Transwell insert following coculture with AE17 cells with or without 1 mM DM-αKG supplementation (n = 6 random fields for each condition for two independent experiments with similar results). Scale bars, 100 µm. The data are shown as the mean ± SEM (A, DF). The data were analyzed using a two-tailed unpaired Student’s t test (A and C-F)

Similar articles

Cited by

References

    1. Glass CK, Natoli G. Molecular control of activation and priming in macrophages. Nat Immunol. 2016;17:26–33. - PMC - PubMed
    1. Kloosterman DJ, Akkari L. Macrophages at the interface of the co-evolving cancer ecosystem. Cell. 2023;186:1627–51. - PubMed
    1. Williams CB, Yeh ES, Soloff AC. Tumor-associated macrophages: unwitting accomplices in breast cancer malignancy. NPJ Breast Cancer. 2016;2:1–12. - PMC - PubMed
    1. Dehne N, Mora J, Namgaladze D, Weigert A, Brüne B. Cancer cell and macrophage cross-talk in the tumor microenvironment. Curr Opin Pharmacol. 2017;35:12–19. - PubMed
    1. Cassetta L, Pollard JW. Targeting macrophages: therapeutic approaches in cancer. Nat Rev Drug Discov. 2018;17:887–904. - PubMed

Publication types

Substances