. 2024 May;21(5):466-478.
doi: 10.1038/s41423-024-01137-x. Epub 2024 Feb 26.

NLRP3 inflammasome activation and NETosis positively regulate each other and exacerbate proinflammatory responses: implications of NETosis inhibition for acne skin inflammation treatment

Affiliations

NLRP3 inflammasome activation and NETosis positively regulate each other and exacerbate proinflammatory responses: implications of NETosis inhibition for acne skin inflammation treatment

Hyo Jeong Kim et al. Cell Mol Immunol. 2024 May.

Abstract

Inflammasomes are multiprotein complexes involved in the host immune response to pathogen infections. Thus, inflammasomes participate in many conditions, such as acne. Recently, it was shown that NETosis, a type of neutrophil cell death, is induced by bacterial infection and is involved in inflammatory diseases such as delayed wound healing in patients with diabetes. However, the relationship between inflammasomes and NETosis in the pathogenesis of inflammatory diseases has not been well studied. In this study, we determined whether NETosis is induced in P. acnes-induced skin inflammation and whether activation of the nucleotide-binding domain, leucine-rich family, and pyrin domain-containing-3 (NLRP3) inflammasome is one of the key factors involved in NETosis induction in a mouse model of acne skin inflammation. We found that NETosis was induced in P. acnes-induced skin inflammation in mice and that inhibition of NETosis ameliorated P. acnes-induced skin inflammation. In addition, our results demonstrated that inhibiting inflammasome activation could suppress NETosis induction in mouse skin. These results indicate that inflammasomes and NETosis can interact with each other to induce P. acnes-induced skin inflammation and suggest that targeting NETosis could be a potential treatment for inflammasome-mediated diseases as well as NETosis-related diseases.

Keywords: P. acnes; NETosis; NLRP3 inflammasome; Skin inflammation.


Conflict of interest statement

The authors declare no competing interests.

Figures

Fig. 1
Fig. 1
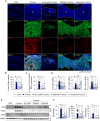
The intradermal injection of P. acnes induces NETosis, suggesting that NETosis is involved in P. acnes-induced skin inflammation in mice. A Phenotype of P. acnes-induced skin inflammation in mice. C57BL/6 mice were injected intradermally with 1 × 107 CFU of P. acnes or PBS, and inflammation-induced ear redness was imaged 24 h postinjection (n = 5 mice/group). B Representative H&E staining of ear tissue sections. In each frame, the red dotted lines and asterisks indicate the aggregation of inflammatory cells surrounding the injection site of P. acnes. The area within the black dotted lines represents the epidermis of the mouse ear and is magnified and displayed in the upper right corner. C Epidermal thickness increased following the intradermal injection of P. acnes. Epidermal thickness was measured at 17 randomly selected points (n = 5/group, **P < 0.01 by the Mann‒Whitney t test). D The NETosis markers Mpo (green) and citrullinated H3 (CitH3; red) were detected in the skin of mice injected with P. acnes. The average percentage of Mpo (E) and colocalization of Mpo and CitH3 areas (F) increased in the P. acnes-injected mouse ear skin. The values for each mouse ear skin sample represent the average of 6 fields of view imaged at 20× magnification. The data are presented as the mean Mpo or Mpo/CitH3 colocalization area over the ear skin area ± standard deviation (SD) of individual ear skin in mice (n = 5/group; **P < 0.01 according to the Mann‒Whitney t test). G The mRNA levels of the NETosis markers Mpo, Padi4, and Elane increased in the P. acnes-injected mouse ear skin (n = 5/group; *P < 0.05 according to the Mann‒Whitney t test). H western blot analysis revealed an increase in the protein levels of the NETosis markers Mpo, Padi4, and CitH3 in the skin of P. acnes-injected mice. I Graphs illustrating the protein levels of Mpo, Padi4, and CitH3 in mouse ear skin. (n = 5/group, **P < 0.01 by the Mann‒Whitney t test). The data are presented as the mean ± SD
Fig. 2
Fig. 2
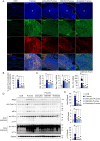
P. acnes exacerbates IMQ-induced psoriasis-like skin inflammation. A Psoriasiform dermatitis was induced on the shaved back skin by applying IMQ for 6 consecutive days, and on the 6th day, IMQ cream was applied, and 4 h later, P. acnes (1 × 107 CFU/point) was intradermally injected into back skin (n = 4 mice/group). B Phenotype of mouse back skin on Day 7. C Representative H&E staining of the dorsal lesions of the mice in the three experimental groups (Vaseline, IMQ, and IMQ + P. acnes). In each frame, the red dotted lines and asterisks indicate the aggregation of inflammatory cells surrounding the injection site of P. acnes. D Epidermal thickness in the IMQ + P. acnes group was significantly greater than that in the IMQ group. Epidermal thickness was measured at 17 randomly selected points (n = 4/group, **P < 0.01 by the Mann‒Whitney t test). E Representative immunofluorescence staining of Mpo (green)- and CitH3 (red)-positive areas in mouse back skin. In the DAPI frame, the white dotted lines and asterisks indicate the aggregation of inflammatory cells surrounding the injection site of P. acnes. The average percentage of Mpo (F) and colocalization of Mpo and CitH3 areas (G) increased in the P. acnes-injected mouse back skin. The values for each mouse ear skin sample represent the average of 6 fields of view imaged at 20× magnification. The data are presented as the mean Mpo or Mpo/CitH3 colocalization area over the back skin area ±SD of individual back skin in mice (n = 4/group; ****P < 0.0001 according to the Mann‒Whitney t test). H The mRNA levels of Mpo, Padi4, and Elane increased in the P. acnes-injected mouse back skin (n = 4/group; *P < 0.05 according to the Mann‒Whitney t test). I western blot analysis revealed an increase in the protein levels of the NETosis markers Mpo, Padi4, and CitH3 in the back skin of P. acnes-injected mice. Graphs illustrating the protein levels of Mpo, Padi4, and CitH3 in mouse back skin. (n = 4/group, *P < 0.05; **P < 0.01 by the Mann‒Whitney t test). J The mRNA levels of inflammatory cytokines were upregulated in the IMQ + P. acnes group (n = 4/group; *P < 0.05; **P < 0.01; ns nonsignificant according to the Mann‒Whitney t test). The data are presented as the mean ± SD
Fig. 3
Fig. 3
NETosis inhibitors ameliorate P.acnes-induced skin inflammation in mice. A Experimental scheme for the acne mouse model treated with the NETosis inhibitors Ly6G, GSK484, or allvestestat (n = 4 mice/group). B Representative images of PBS- or NETosis inhibitor-treated P. acnes-induced edema in the ears of mice. C Representative H&E staining of ear tissue sections. In each frame, the red dotted lines and asterisks indicate the aggregation of inflammatory cells surrounding the injection site of P. acnes. The area within the black dotted line represents the epidermis of the mouse ear and is magnified and displayed in the upper right corner. D The epidermal thickness of the ear skin of P. acnes-treated mice treated with NETosis inhibitors decreased. Epidermal thickness was measured at 17 randomly selected points (n = 4/group; *P < 0.05 by the Mann‒Whitney t test). The data are presented as the mean ± SD
Fig. 4
Fig. 4
Treatment with NETosis inhibitors suppresses P. acnes-induced NET formation in mouse ear skin. A Representative immunofluorescence staining of Mpo (green)- and CitH3 (red)-positive areas in mouse ear skin. In the DAPI frame, the white dotted lines and asterisks indicate the aggregation of inflammatory cells surrounding the injection site of P. acnes. The average percentage of Mpo (B) and colocalization of Mpo and CitH3 areas (C) were inhibited by NETosis inhibitor treatment. The values for each mouse ear skin sample represent the average of 6 fields of view imaged at 20× magnification. The data are presented as the mean Mpo or Mpo/CitH3 colocalization area over the ear skin area ± SD of individual ear skin in mice (n = 4/group; *P < 0.05 according to the Mann‒Whitney t test). D The mRNA expression of Mpo, Padi4, and Elane was suppressed by NETosis inhibitor treatment (n = 4/group; *P < 0.05; Mann‒Whitney t test). E western blot analysis revealed a decrease in the protein levels of Mpo, Padi4, and CitH3 in the skin of NETosis inhibitor-treated P. acnes-injected mice. F Graphs illustrating the protein levels of Mpo, Padi4, and CitH3 in mouse ear skin. (n = 4/group, *P < 0.05 by the Mann‒Whitney t test). The data are presented as the mean ± SD
Fig. 5
Fig. 5
NETosis inhibitors suppress the NLRP3 inflammasome in P. acnes-injected mouse ear skin. A Representative immunofluorescence staining of Nlrp3 (green)- and Il1b (red)-positive areas in mouse ear skin injected with P. acnes. B The average percentage of cells colocalized with Nlrp3 and Il1b was reduced by NETosis inhibitor treatment. The values for each mouse ear skin sample represent the average of 6 fields of view imaged at 20× magnification. The data are presented as the mean Nlrp3/Il1b colocalization area over the ear skin area ± SD of individual ear skin in mice (n = 4/group; *P < 0.05 according to the Mann‒Whitney t test). In the DAPI frame, the white dotted lines and asterisks indicate the aggregation of inflammatory cells surrounding the injection site of P. acnes. C The mRNA expression of Nlrp3, Casp1, and Il1b was inhibited by NETosis inhibitor treatment (n = 4 mice/group; *P < 0.05; Mann‒Whitney t test). D western blot analysis revealed a decrease in the protein levels of Nlrp3, Casp1 (p20), and Il1b (p17) in the skin of NETosis inhibitor-treated P. acnes-injected mice. E Graphs illustrating the protein levels of Nlrp3, Casp1 (p20), and Il1b (p17) in mouse ear skin. (n = 4/group, *P < 0.05 by the Mann‒Whitney t test). The data are presented as the mean ± SD
Fig. 6
Fig. 6
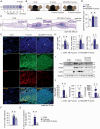
Inhibition of the Nlrp3 inflammasome suppresses NETosis induction in P. acnes-injected mouse ear skin. A Experimental scheme of the skin inflammation model mice treated with the NLRP3 inhibitor MCC950. B Representative images of PBS- or Nlrp3 inhibitor-treated P. acnes-induced edemain the ears of mice. C Representative H&E staining of ear tissue sections. In each frame, the red dotted lines and asterisks indicate the aggregation of inflammatory cells surrounding the injection site of P. acnes. The area within the black dotted line represents the epidermis of the mouse ear and is magnified and displayed in the upper right corner. D The epidermal thickness of P. acnes-treated Nlrp3 inhibitor-treated mouse ear skin decreased. Epidermal thickness was measured at 17 randomly selected points (n = 4/group; *P < 0.05 by the Mann‒Whitney t test). E Representative immunofluorescence staining of Mpo (green)- and CitH3 (red)-positive areas in mouse ear skin. In the DAPI frame, the white dotted lines and asterisks indicate the aggregation of inflammatory cells surrounding the injection site of P. acnes. The average percentage of Mpo (F) and colocalization of Mpo and CitH3 areas (G) were reduced by Nlrp3 inhibitor treatment. The values for each mouse ear skin sample represent the average of 6 fields of view imaged at 20× magnification. The data are presented as the mean Mpo or Mpo/CitH3 colocalization area over the ear skin area ± SD of individual ear skin in mice (n = 4/group; *P < 0.05 according to the Mann‒Whitney t test). H The mRNA expression of Mpo, Padi4, and Elane was suppressed by Nlrp3 inhibitor treatment (n = 4/group; *P < 0.05; Mann‒Whitney t test). I western blot analysis demonstrated a reduction in the protein levels of Mpo, Padi4, and CitH3 in the ear skin of Nlrp3 inhibitor-treated P. acnes-injected mice. J Graphs depicting the protein levels of Mpo, Padi4, and CitH3 in mouse ear skin. (n = 4/group, *P < 0.05 by the Mann‒Whitney t test). The data are presented as the mean ± SD
Fig. 7
Fig. 7
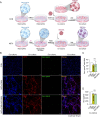
NETosis induces Nlrp3 inflammasome activation in mouse BMDMs. A Experimental setup for the coculture of mouse neutrophils and macrophages. B Representative immunofluorescence staining of CitH3 (red; neutrophils) and Asc speck (green; macrophages) cells. C The average number of Asc speck-positive BMDMs was quantified (n = 10 fields). The average number of Asc specimens and SD for three independent experiments are plotted. ****P < 0.0001; CON vs. PMA, ns nonsignificant; PMA vs. PMA + MCC950 by unpaired t test. D The secretion of Il1b in BMDMs from the supernatant collected during coculture was measured via ELISA. The data are expressed as the mean ± SD. ****P < 0.0001; CON vs. PMA, ns nonsignificant; PMA vs. PMA + MCC950 by unpaired t test. All the experiments were performed in triplicate and repeated three times
Fig. 8
Fig. 8
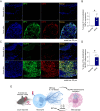
NETosis and the NLRP3 inflammasome are induced in skin tissues of acne patients. A Representative immunofluorescence staining of Mpo (green) and CitH3 (red) was performed to evaluate NETosis in human acne skin tissues and normal skin tissues. B The average percentage of areas colocalized with MPO and CitH3 increased in the acne patient tissues. The values for each human acne skin sample represent the average of 10 fields of view imaged at 20× magnification. *P < 0.05 according to an unpaired t test. C Representative immunofluorescence staining of NLRP3 (green) and IL1b (red) was performed to evaluate NLRP3 inflammasome activation in human acne skin tissues and normal skin tissues. D The average percentage of areas in which NLRP3 and IL1b were colocalized increased in acne patient tissues. The values for each human acne skin sample represent the average of 10 fields of view imaged at 20× magnification. *P < 0.05 according to an unpaired t test. E Schematic diagram illustrating the interplay between NETosis and NLRP3 inflammasome activation. Both processes can mutually activate each other, leading to the exacerbation of inflammatory diseases

References

    1. Bhate K, Williams HC. Epidemiology of acne vulgaris. Br J Dermatol. 2013;168:474–85. doi: 10.1111/bjd.12149. - DOI - PubMed
    1. Cunliffe WJ. Acne and unemployment. Br J Dermatol. 1986;115:386–386. doi: 10.1111/j.1365-2133.1986.tb05757.x. - DOI - PubMed
    1. Ramos-e-Silva M, Ramos-e-Silva S, Carneiro S. Acne in women. Br J Dermatol. 2015;172:20–26. doi: 10.1111/bjd.13638. - DOI - PubMed
    1. Dikicier BS. Topical treatment of acne vulgaris: efficiency, side effects, and adherence rate. J Int Med Res. 2019;47:2987–92. doi: 10.1177/0300060519847367. - DOI - PMC - PubMed
    1. Quanico J, Gimeno J-P, Nadal-Wollbold F, Casas C, Alvarez-Georges S, Redoules D, et al. Proteomic and transcriptomic investigation of acne vulgaris microcystic and papular lesions: Insights in the understanding of its pathophysiology. Biochim Biophys Acta Gen Subj. 2017;1861:652–63. doi: 10.1016/j.bbagen.2016.10.021. - DOI - PubMed

Publication types

Substances

LinkOut - more resources