. 2024 Mar;9(3):631-646.
doi: 10.1038/s41564-024-01601-4. Epub 2024 Feb 26.

Siderophores promote cooperative interspecies and intraspecies cross-protection against antibiotics in vitro

Affiliations

Siderophores promote cooperative interspecies and intraspecies cross-protection against antibiotics in vitro

Anna Clara M Galdino et al. Nat Microbiol. 2024 Mar.

Abstract

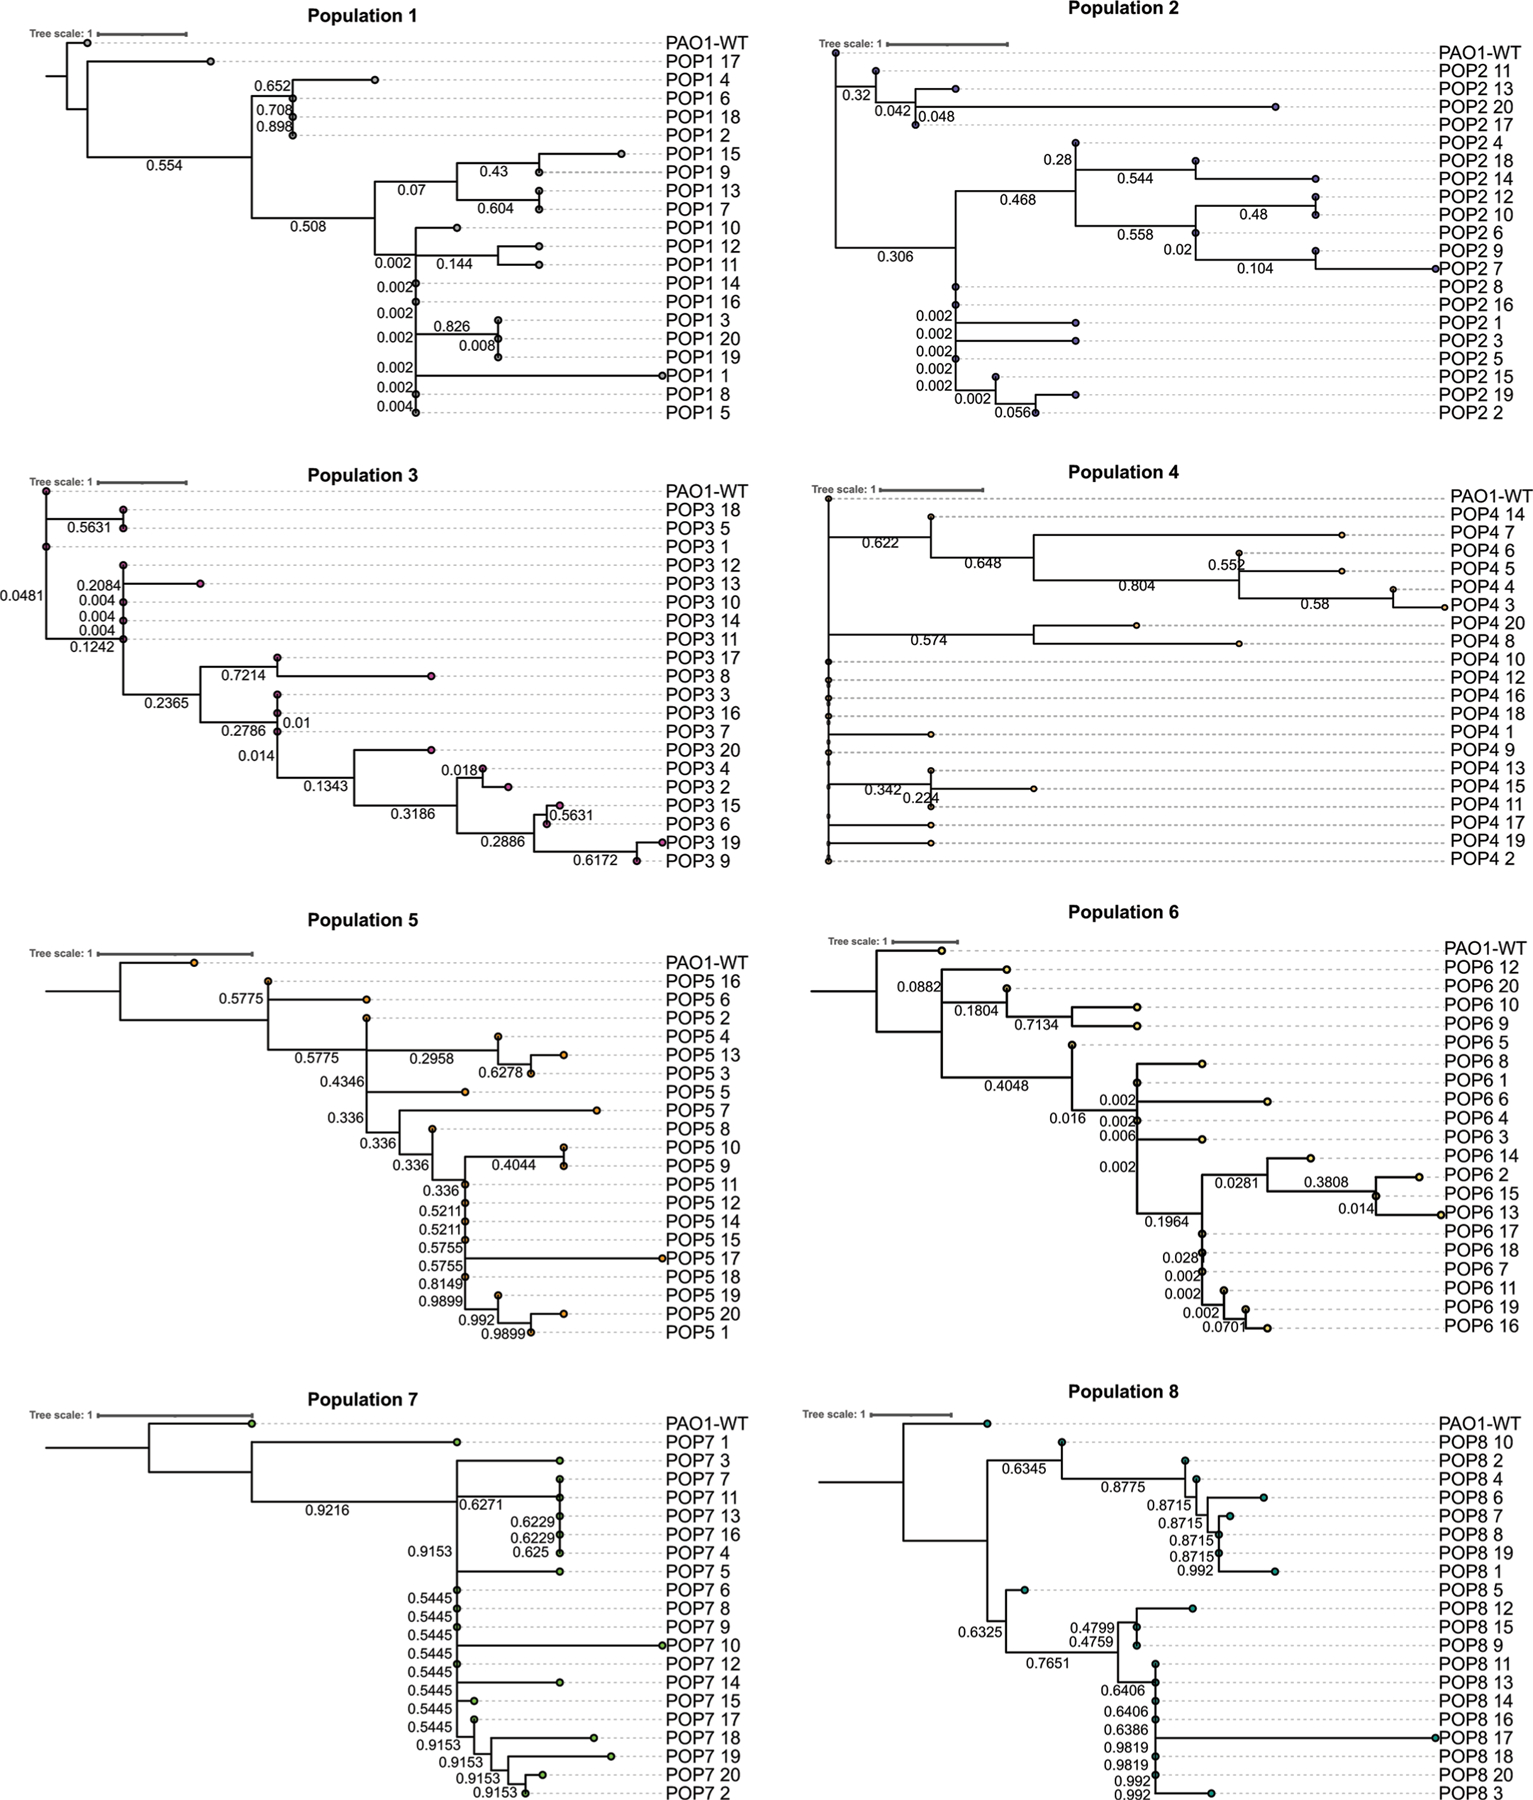
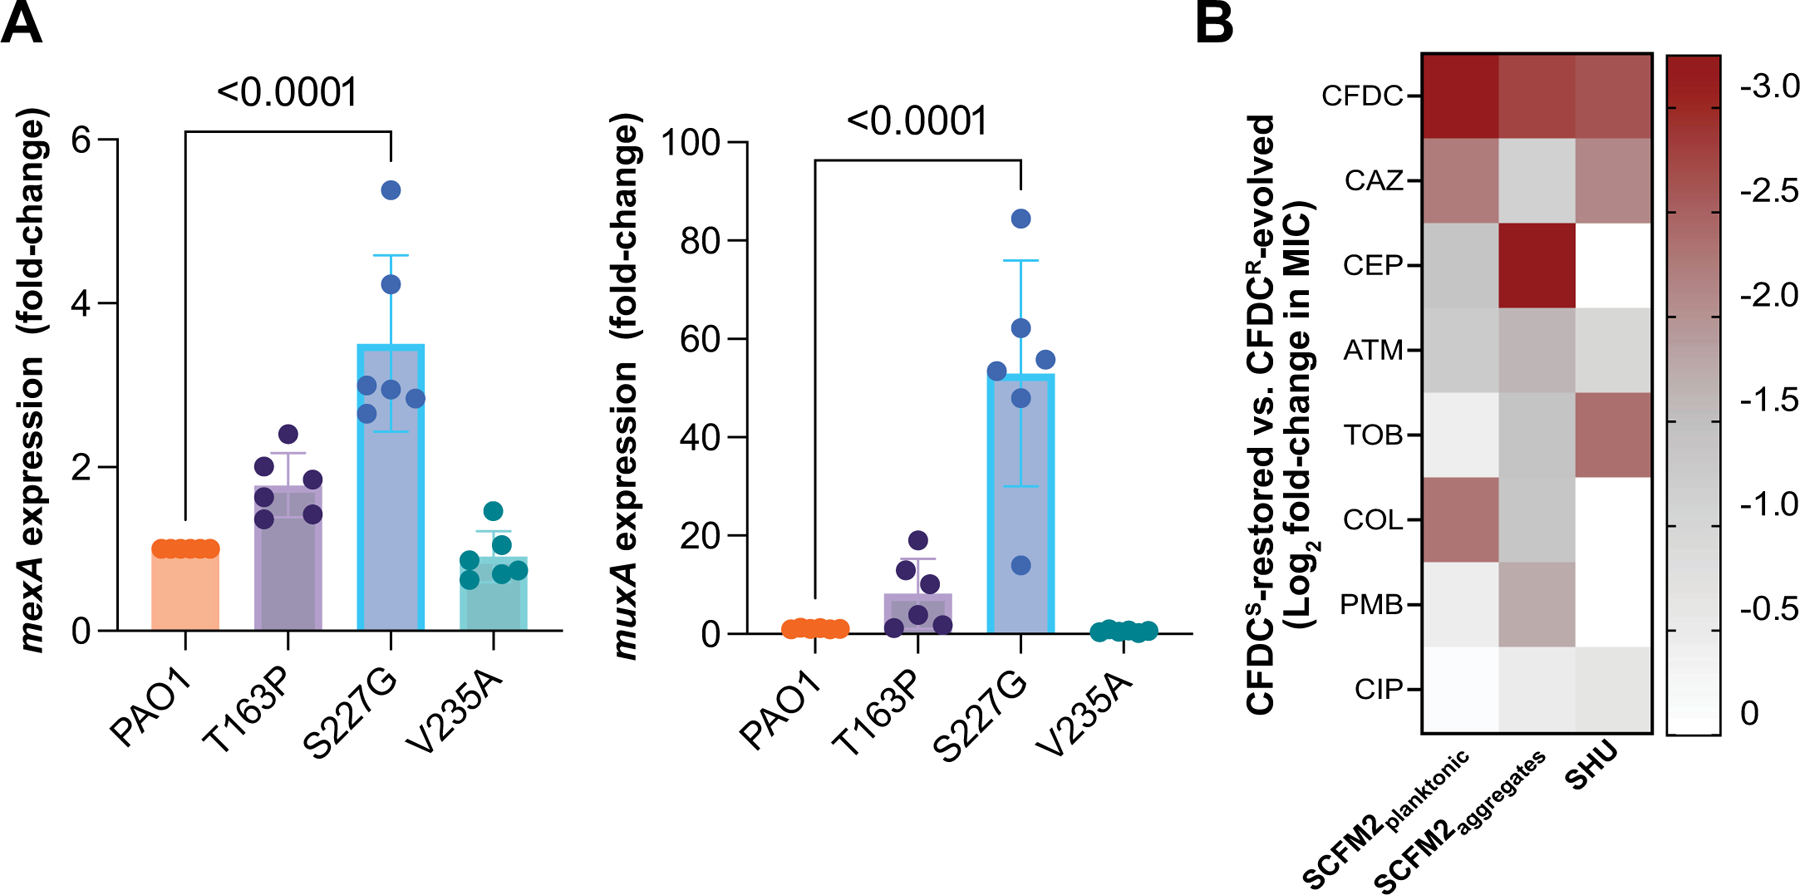
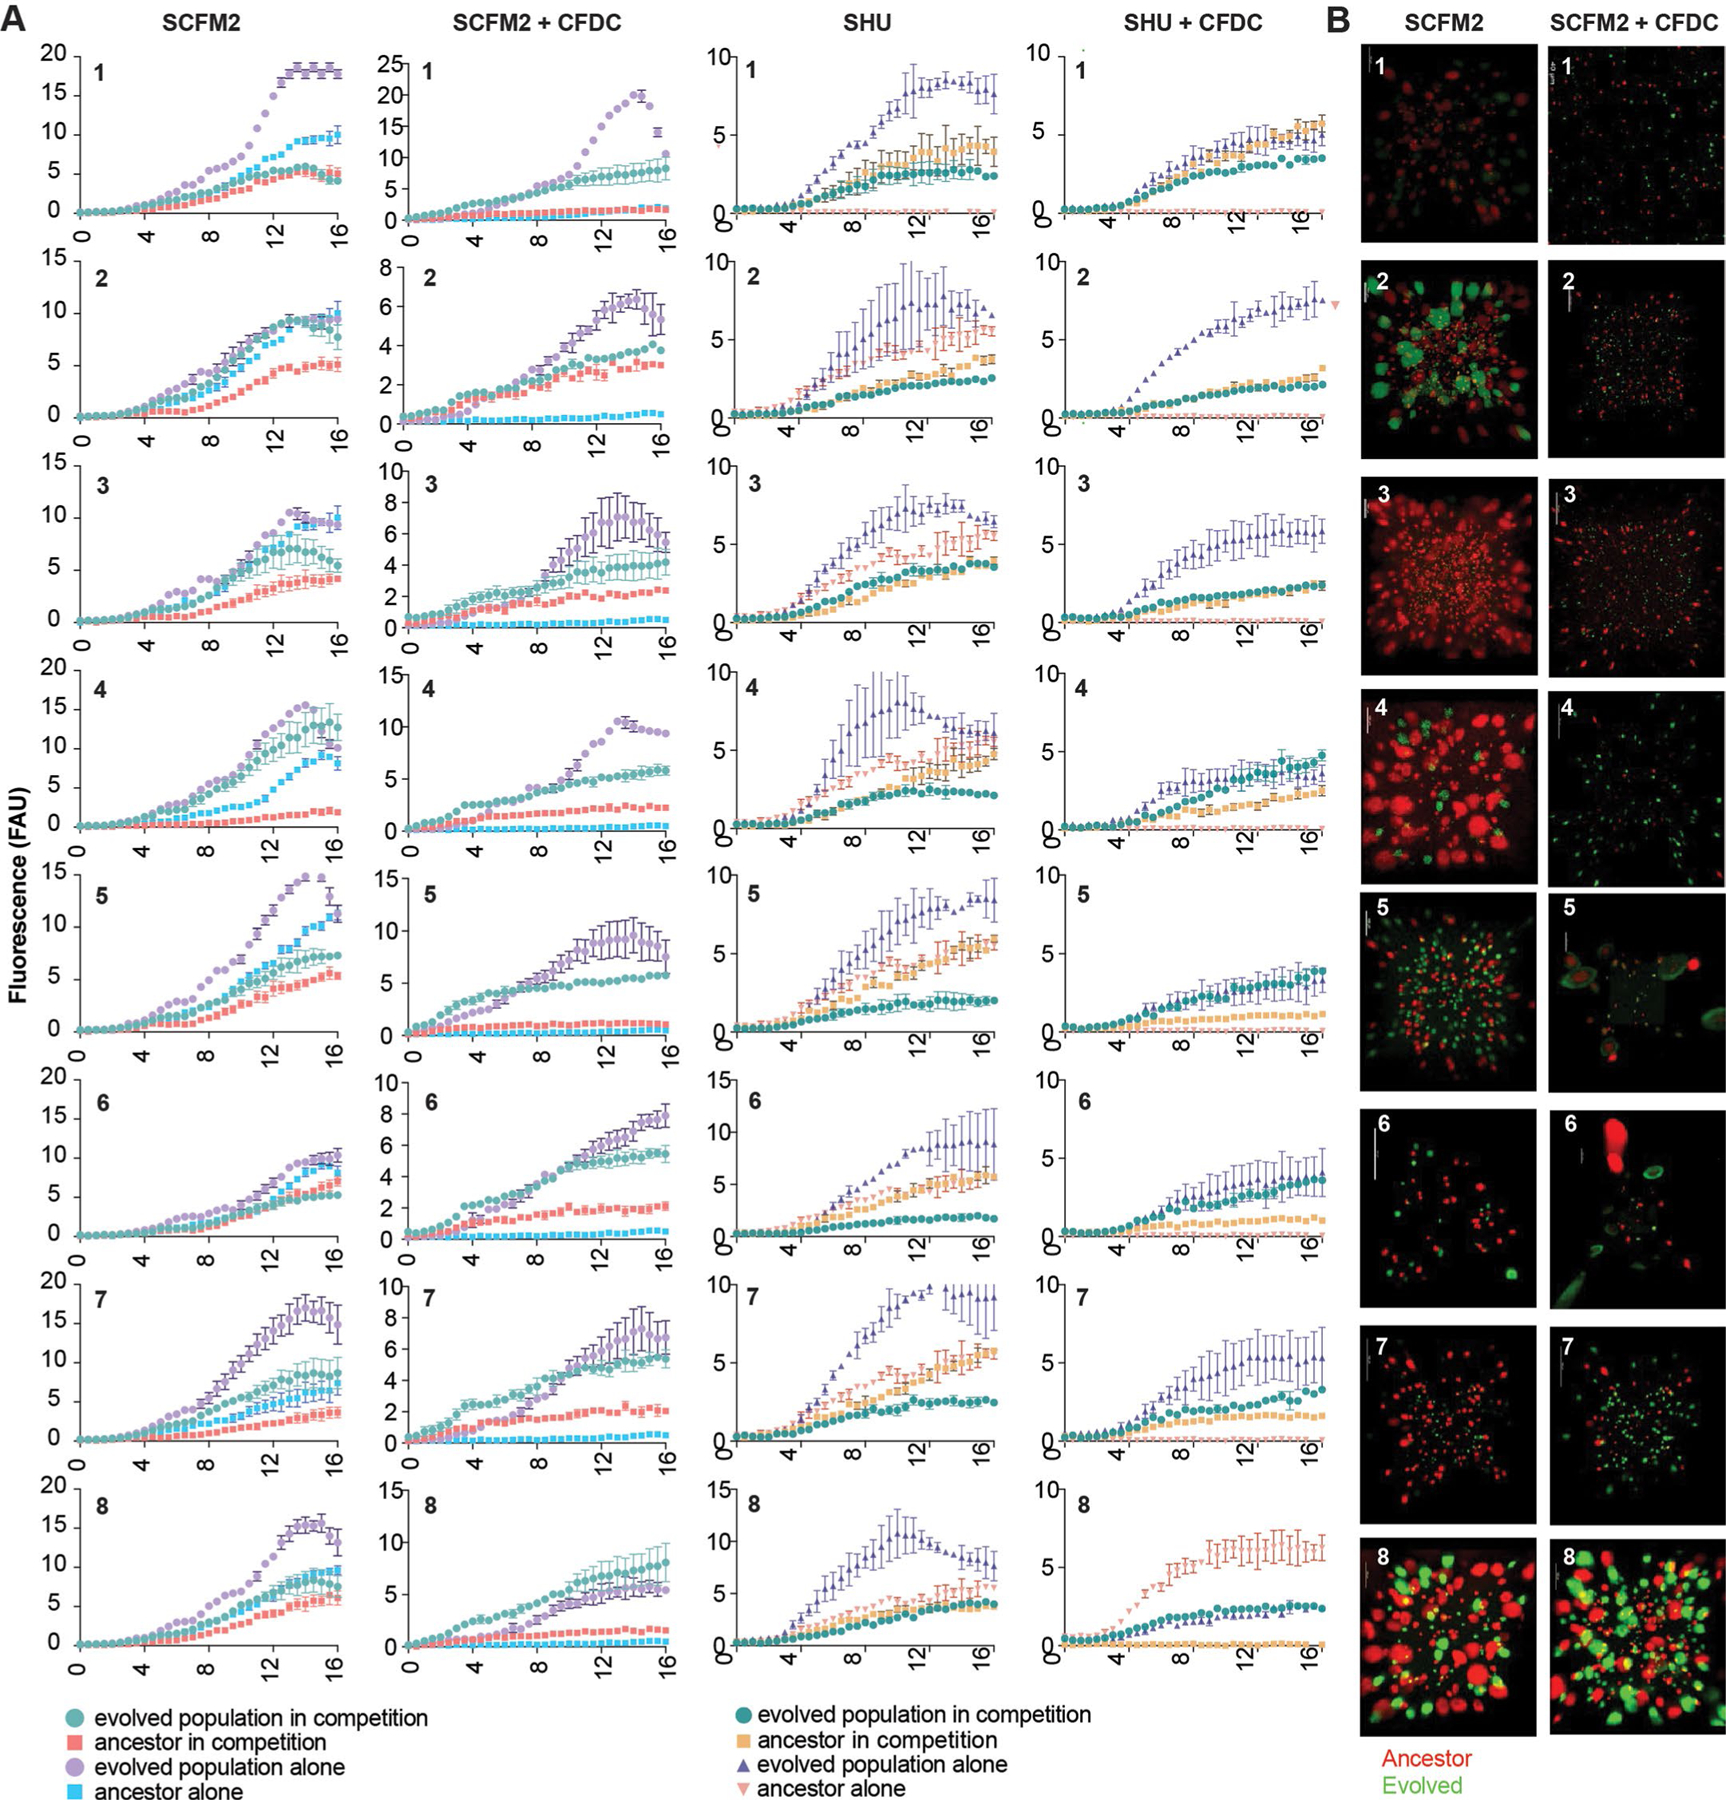
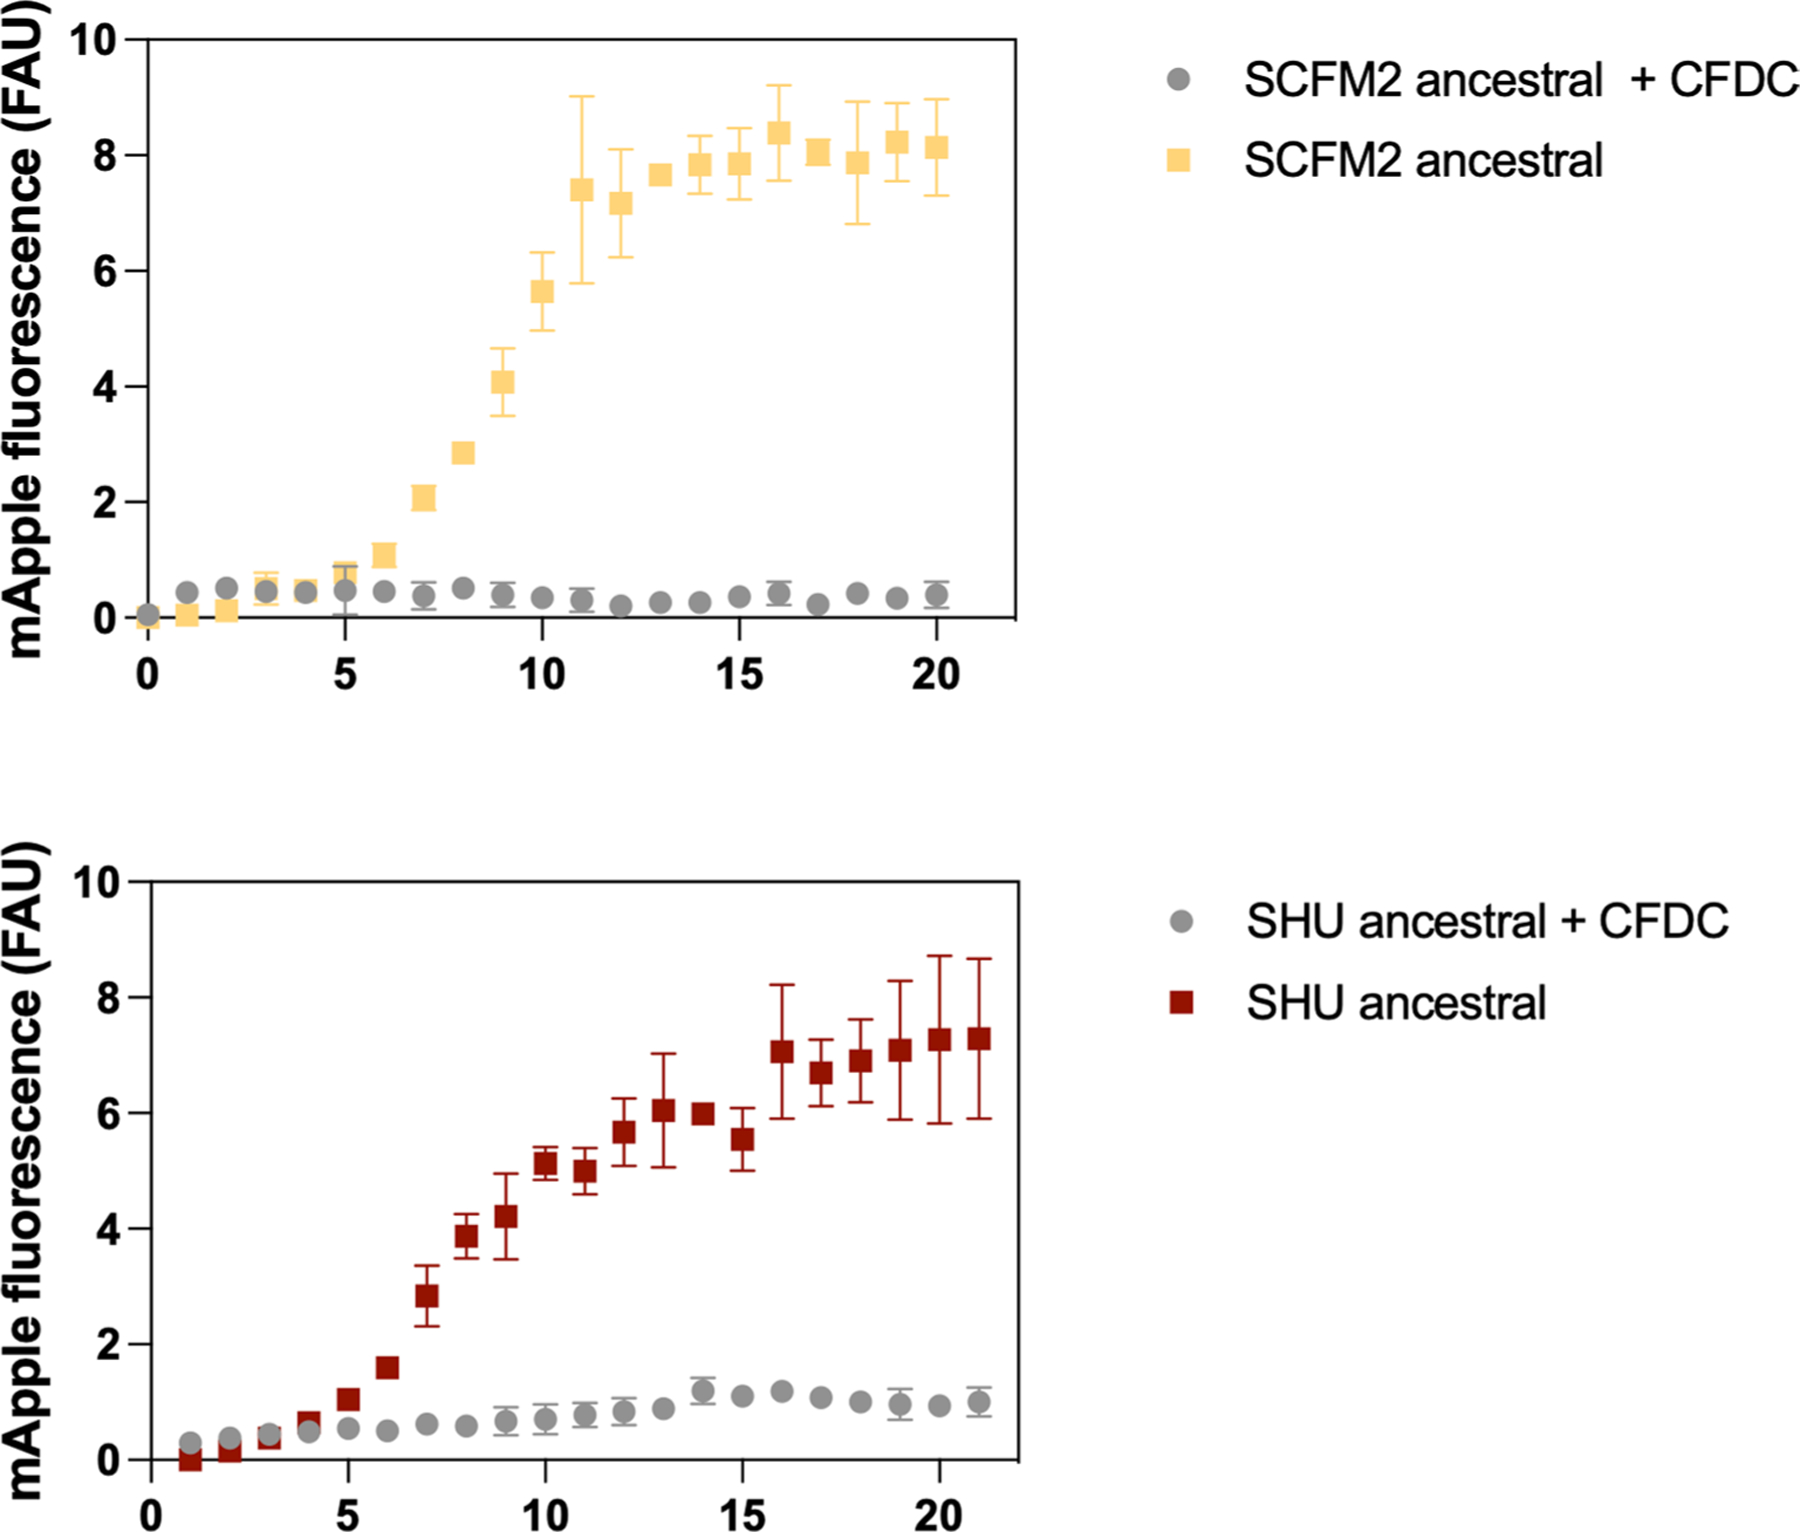
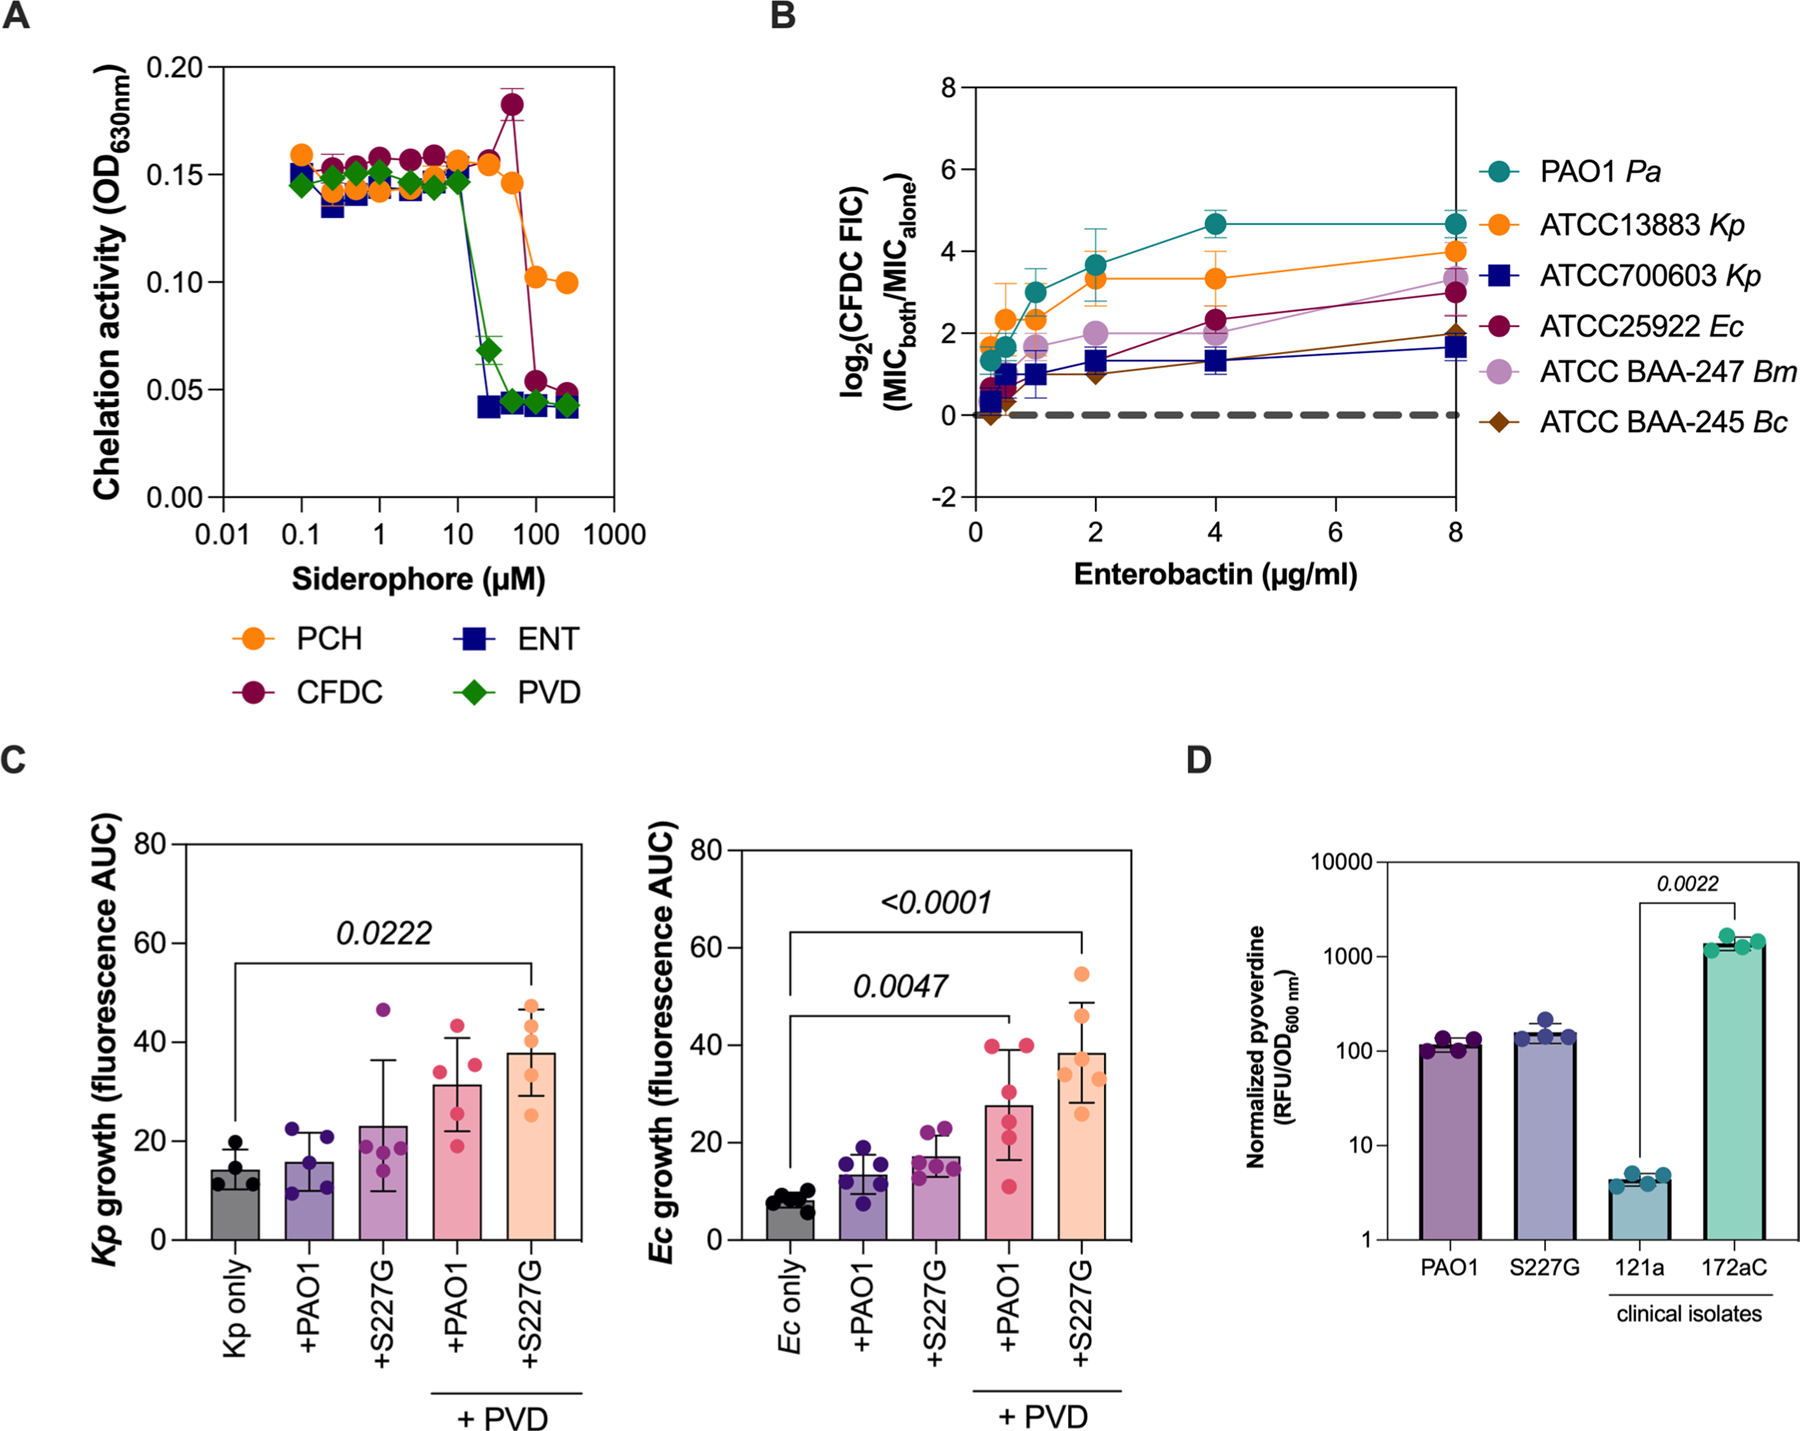
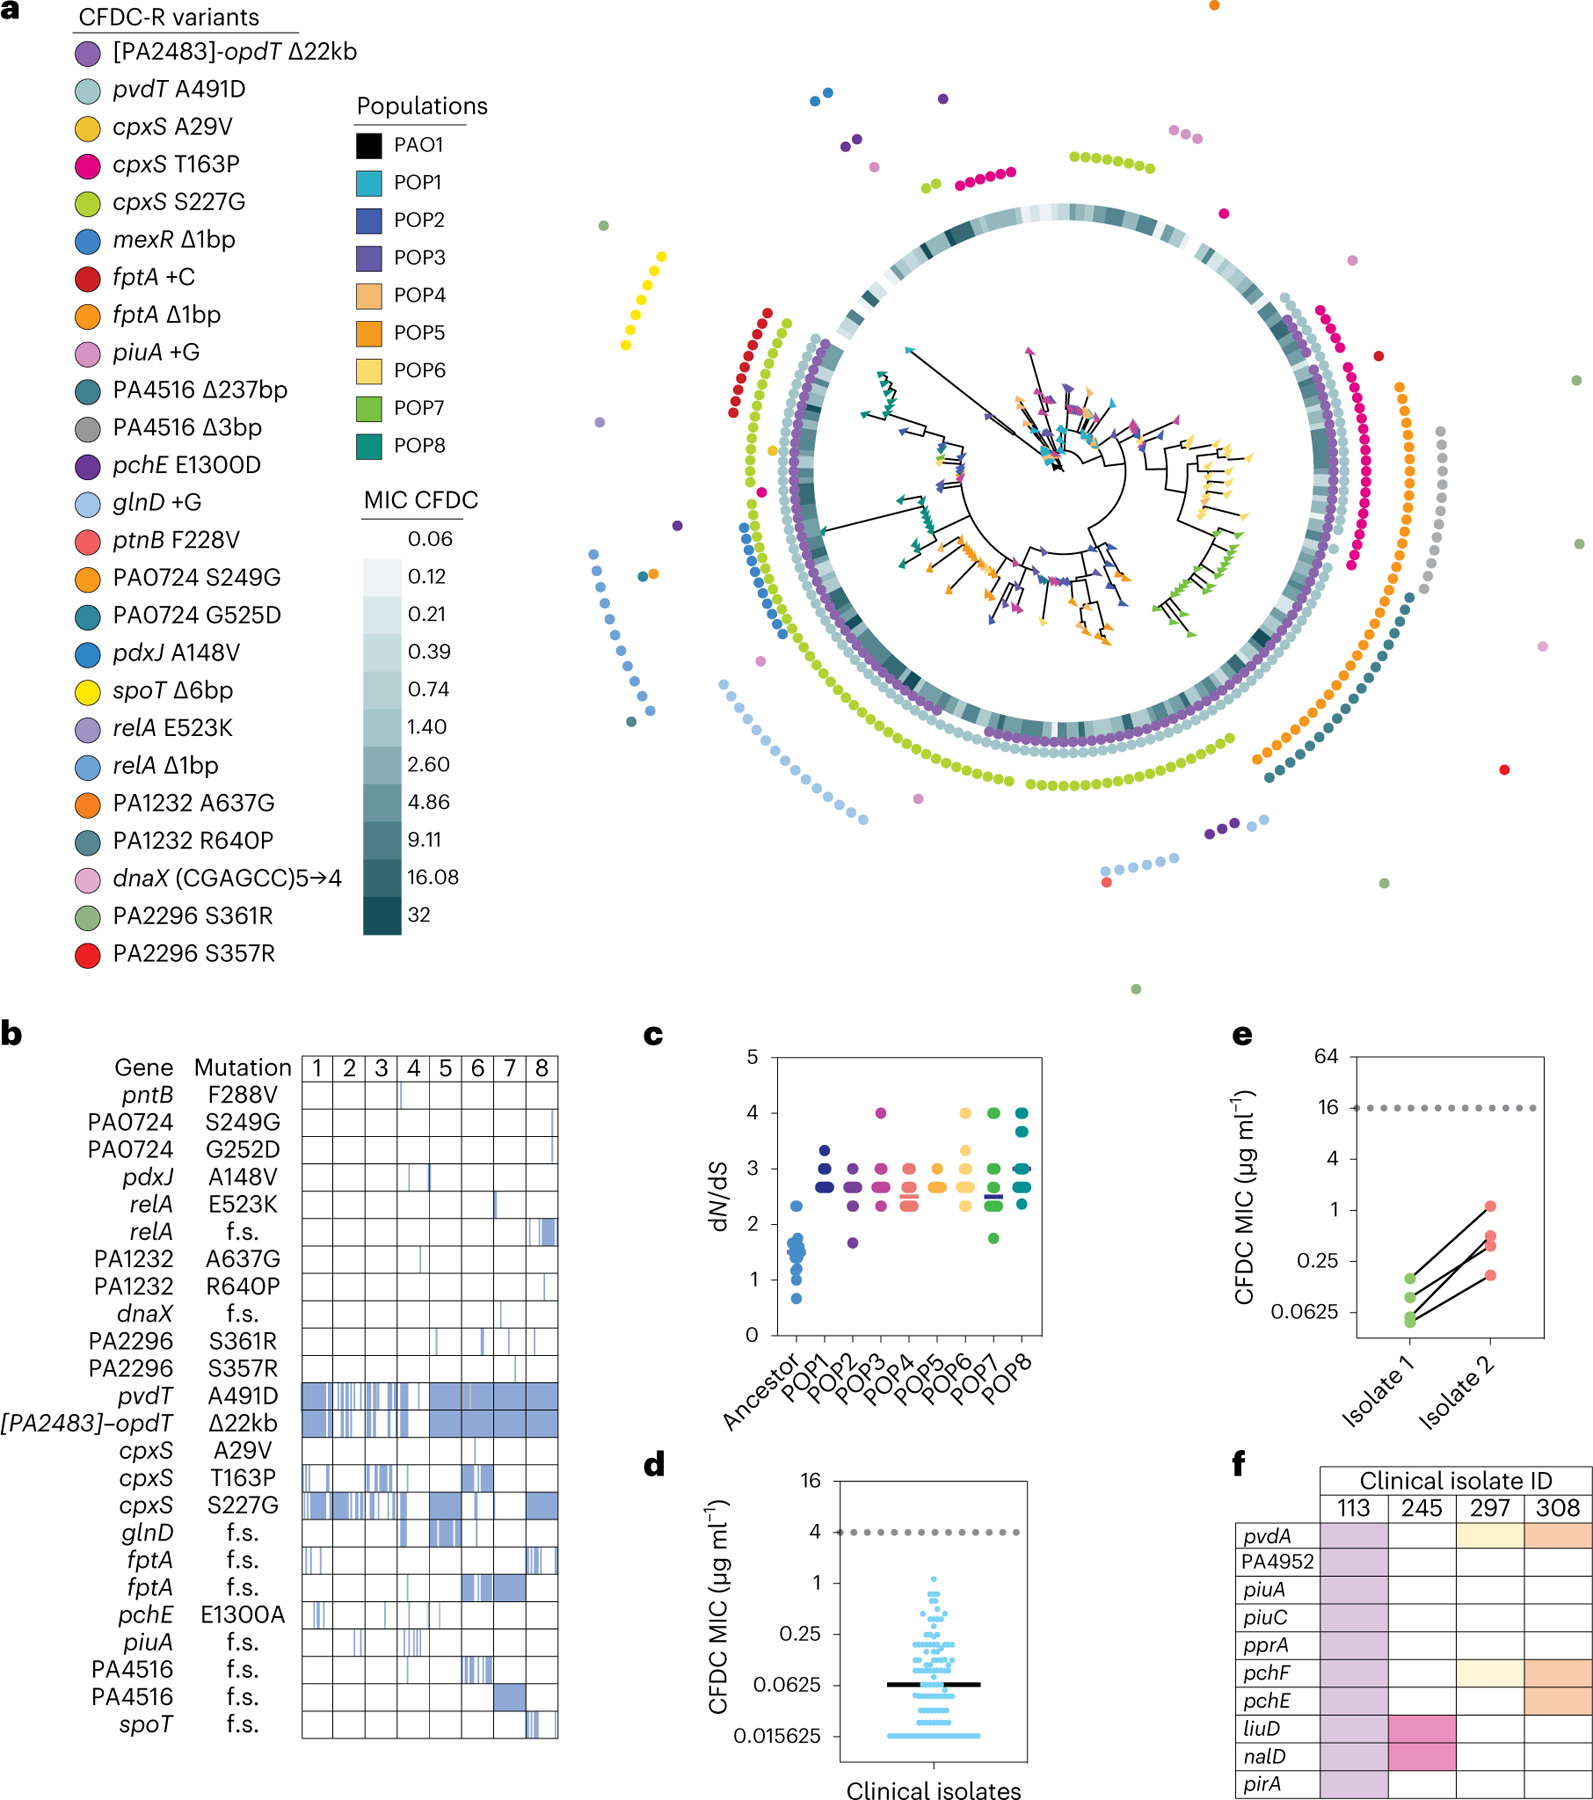
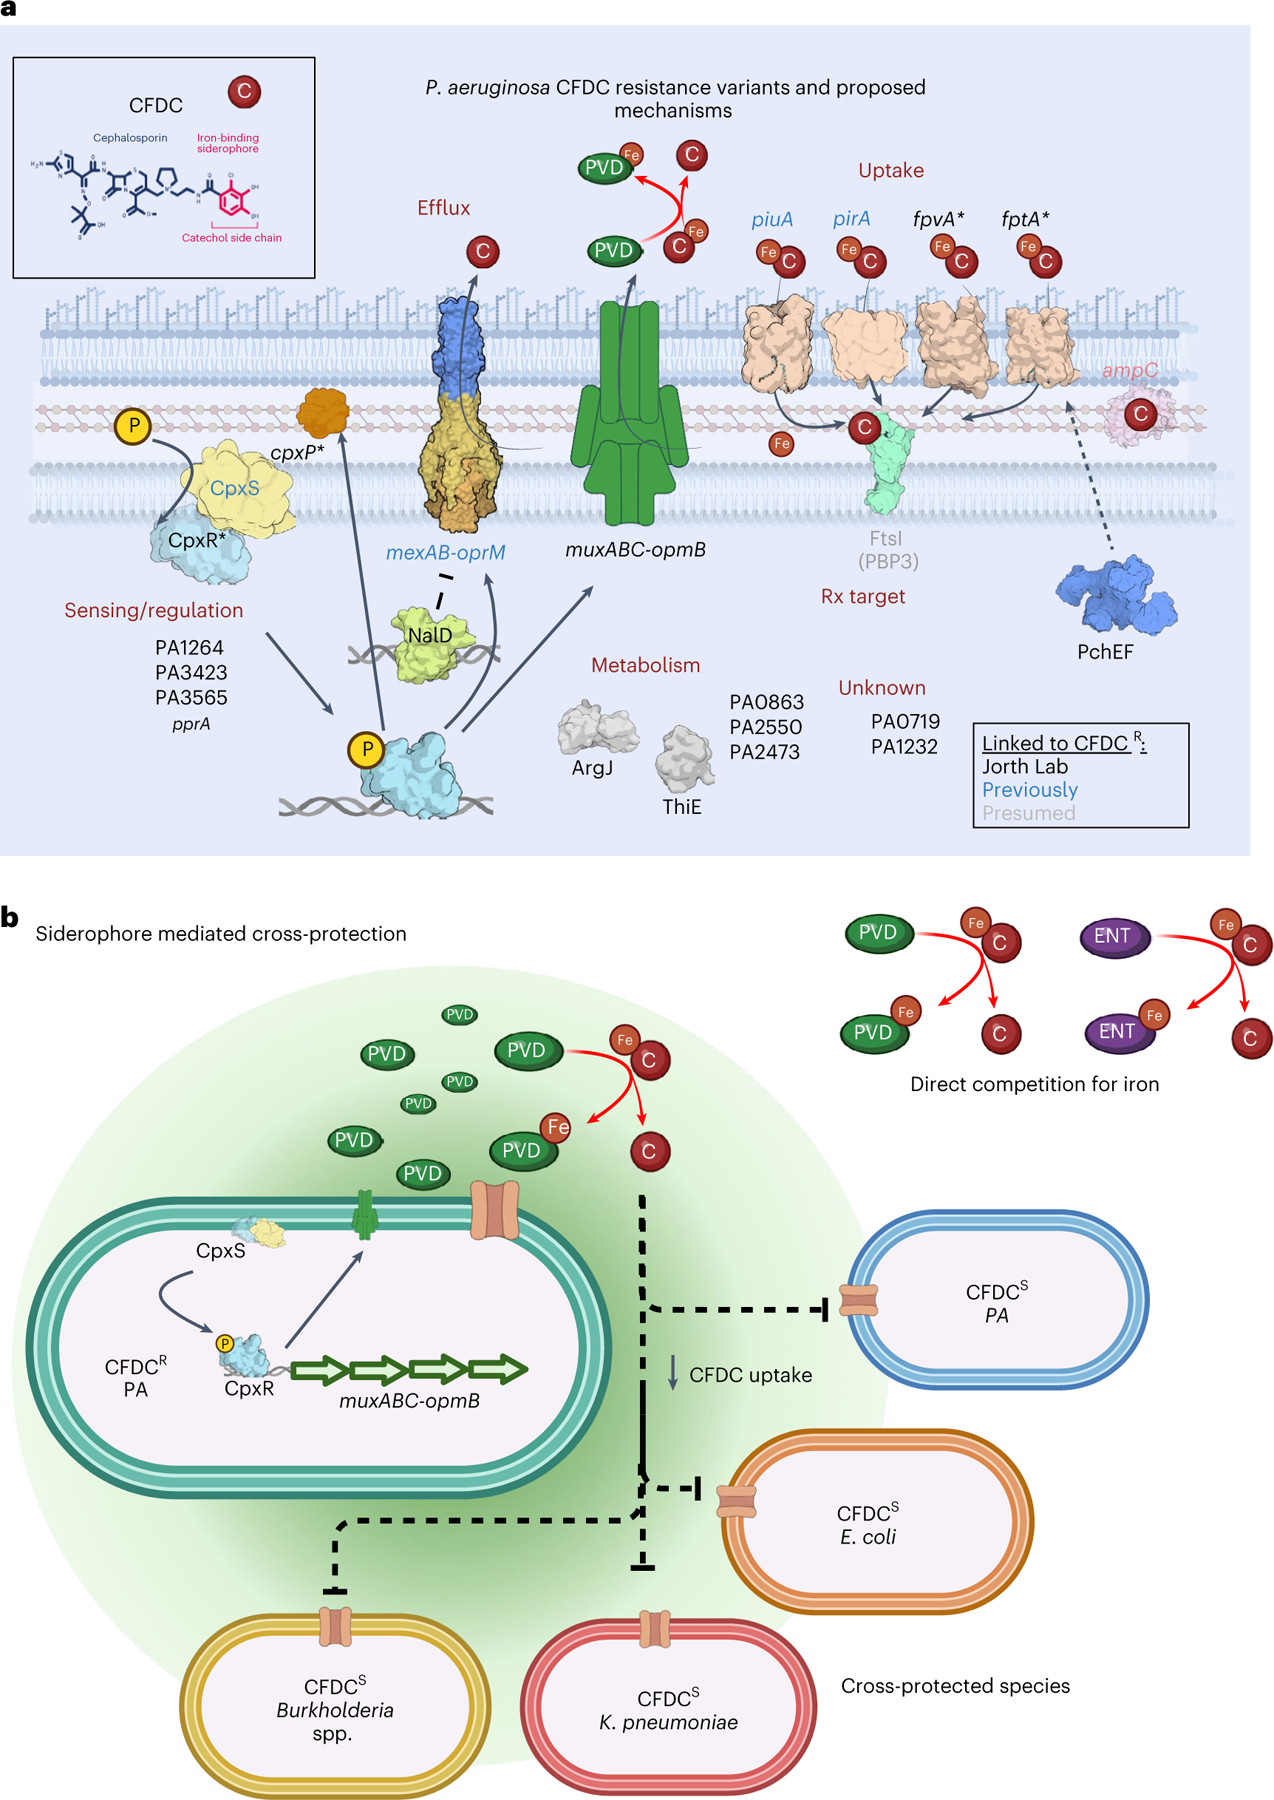
The antibiotic cefiderocol hijacks iron transporters to facilitate its uptake and resists β-lactamase degradation. While effective, resistance has been detected clinically with unknown mechanisms. Here, using experimental evolution, we identified cefiderocol resistance mutations in Pseudomonas aeruginosa. Resistance was multifactorial in host-mimicking growth media, led to multidrug resistance and paid fitness costs in cefiderocol-free environments. However, kin selection drove some resistant populations to cross-protect susceptible individuals from killing by increasing pyoverdine secretion via a two-component sensor mutation. While pyochelin sensitized P. aeruginosa to cefiderocol killing, pyoverdine and the enterobacteria siderophore enterobactin displaced iron from cefiderocol, preventing uptake by susceptible cells. Among 113 P. aeruginosa intensive care unit clinical isolates, pyoverdine production directly correlated with cefiderocol tolerance, and high pyoverdine producing isolates cross-protected susceptible P. aeruginosa and other Gram-negative bacteria. These in vitro data show that antibiotic cross-protection can occur via degradation-independent mechanisms and siderophores can serve unexpected protective cooperative roles in polymicrobial communities.


Conflict of interest statement

Competing interests

The authors declare no competing interests.

Figures

Extended Data Fig. 1 |
Extended Data Fig. 1 |. Time to achieve growth at high cefiderocol concentrations during experimental evolution.
Mean time to achieve growth at (a) 4 µg/ml and (b) 1,024 µg/ml cefiderocol during experimental evolution in cystic fibrosis (SCFM2 planktonic and aggregate populations) and synthetic human urine (SHU) media (Mean ± SD; p-values: one-way ANOVA with Tukey’s multiple comparison test, n = 8 parallel cultures).
Extended Data Fig. 2 |
Extended Data Fig. 2 |. Genetic diversity of populations evolved in the presence or absence of increasing concentrations of cefiderocol.
Shannon diversity indices were calculated from SNV frequencies in control populations passaged in cefiderocol-free media and in cefiderocol-evolved populations (mean; p-values, two-sided unpaired t-test, n = 8 parallel cultures).
Extended Data Fig. 3 |
Extended Data Fig. 3 |. Maximum parsimony phylogenetic trees of evolved isolates show diversity within each cefiderocol resistant population.
Maximum-likelihood phylogenetic trees were constructed based on mutations detected in cefiderocol evolved isolated colonies (20 colonies per evolved population). Phylogenetic trees were rooted on the PAO1 wild-type genome. Bootstrap values are indicated on respective branches. Trees were plotted using iTOL.
Extended Data Fig. 4 |
Extended Data Fig. 4 |. Increased efflux pump gene expression in cpxS variants and decreased antibiotic cross-resistance after drug-free selection.
a, Expression of mexA and muxA genes known to be under the control of the CPX two-component system, by RT-qPCR in PAO1 wild-type and cpxSSNV variants (T163P, S227G, and S235A) (mean ± SEM, ANOVA Dunnett′s multiple comparisons test, n = 6 independent experiments). b, Heatmap of antimicrobial susceptibilities of populations evolved in the absence of cefiderocol for 15 d. Heatmap indicates the mean log2 MIC fold change of drug-free-passaged populations compared to cefiderocol resistant populations (n = 8 populations per growth condition). CFDC, cefiderocol; CAZ, ceftazidime; CEP, cefepime, ATM, aztreonam, TOB, tobramycin, COL, colistin, PMB, polymyxin B, CIP ciprofloxacin.
Extended Data Fig. 5 |
Extended Data Fig. 5 |. In vitro competitions between ancestral and cefiderocol-resistant evolved populations.
a, Planktonic competitions between ancestral and cefiderocol-resistant evolved populations in SCFM2 and SHU. b, Biofilm competitions between ancestral and cefiderocol-resistant evolved populations in SCFM2 with (right) or without (left) cefiderocol. Evolved and ancestral populations were tagged with eYFP and mApple fluorescent proteins, respectively. The fluorescent populations were competed (1:1 ratios) in the presence or absence of cefiderocol (64 µg/ml). Planktonic populations growth was determined by monitoring fluorescence over time (h). Experiments were performed in triplicate, in three independent experimental sets (mean ± SD n = 3 independent experiments). Biofilm competitions were visualized by confocal microscopy.
Extended Data Fig. 6 |
Extended Data Fig. 6 |. Ancestral populations are unable to grow in the presence of cefiderocol.
Growth in the presence and absence of 64 µg/ml cefiderocol of pre-adapted populations was determined by monitoring fluorescence over time (h). Experiments were performed in triplicate, in three independent experimental sets (mean ± SD n = 3 independent experiments).
Extended Data Fig. 7 |
Extended Data Fig. 7 |. Production of pyoverdine and pyochelin and cefiderocol susceptibilities of evolved isolated colonies.
Pyoverdine and pyochelin production by evolved isolated colonies in relation to cefiderocol susceptibility (Two-sided Spearman correlation, n = 160).
Extended Data Fig. 8 |
Extended Data Fig. 8 |. Bacterial siderophores confer cefiderocol cross-protection.
a, Ferric iron chelating activity of cefiderocol and bacterial siderophores. The chelating activity was detected by the colorimetric changes of chrome azurol B (OD630nm) at different chelator concentrations (0, 1, 2.5, 5, 10, 25, 50, 100 and 250 µM) (mean ± SEM, ANOVA, n = 2 independent experiments). b, Enterobactin protects K. pneumoniae (Kp), E. coli (Ec), B. cenocepacia (Bc), and B. multivorans (Bm) from cefiderocol killing in a dose-dependent manner. The combinatorial effect of enterobactin with cefiderocol is expressed by the log2 cefiderocol fractional inhibitory concentration (FIC; n = 3 independent experiments, mean ± SD). c, Planktonic competitions between P. aeruginosa (PAO1::mApple or cpxSS227G::mApple) and K. pneumoniae (ATCC 13883::eYFP – left) or E. coli (ATCC 25922::eYFP – right) in the presence of inhibitory concentrations with or without additional pyoverdine (8 µg/ml). The growth of K. pneumoniae and E. coli was measured by eYFP fluorescence area under the curve (AUC) (mean ± SEM, ANOVA, Dunnett′s multiple comparisons test, n = 5 independent experiments). d, Pyoverdine production by P. aeruginosa lab strains and clinical isolates in SCFM2 (mean ± SEM, ANOVA, Tukey′s multiple comparisons test, n = 3 independent experiments).
Fig. 1 |
Fig. 1 |. Cefiderocol resistance variants affect multiple genes and pathways.
a, Experimental design: P. aeruginosa strain PAO1 was propagated in SCFM2 or SHU for 10 days before cefiderocol exposure. Pre-adapted populations were propagated daily in increasing cefiderocol concentrations planktonically in SHU or SCFM2 and as agar biofilm block assay biofilm aggregates in SCFM2. When evolved populations achieved growth at 1,024 µg µl−1 cefiderocol, evolved populations were collected and sequenced to identify cefiderocol resistance mutations. As controls, eight populations for each medium and lifestyle were propagated in antibiotic-free conditions. b, Cefiderocol resistance increased during experimental evolution. Population-level cefiderocol MICs were calculated using broth microdilution in either SCFM2 or SHU (n = 8 parallel populations, mean ± s.e.m.). c, Heat map of non-synonymous mutations detected after pre-adaptation of PAO1 in SCFM2 and SHU media, including PseudoCAP functional categories for each gene. These gene mutations served as a baseline for cefiderocol adaptation and were not considered in subsequent analyses as candidate cefiderocol resistance mutations. d, Heat map of non-synonymous mutations detected in populations evolved to grow at 1,024 µg ml−1 cefiderocol in SCFM2 (planktonic and aggregates) and SHU. Variants detected in at least 5% of cells in any given population are listed. Each column represents one replicate population, and colour intensity indicates the relative frequency of each gene variant detected in each population. e, Heat map of antimicrobial susceptibilities of mutants with Tn insertions in candidate resistance genes identified via experimental evolution. Results indicate the average fold change in MIC in the Tn mutants compared to the PAO1 wild-type strain (n = 3 independent experiments). CFDC, cefiderocol; WT, wild type; CEP, cefepime; CFDCS, CFDC susceptible; CFDCR, CFDC resistant.
Fig. 2 |
Fig. 2 |. Cefiderocol resistance variants detected in evolved clones and P. aeruginosa clinical isolates.
a, Whole genome maximum-parsimony phylogenetic tree constructed from mutations detected in 180 isolated evolved colonies (20 ancestor and 160 SCFM2 planktonic cefiderocol-evolved colonies, 20 per population, indicated by coloured triangles). Tree was rooted using PAO1. Cefiderocol MICs for each isolate are presented as a heat map, and coloured dots indicate SNVs detected in each clone. b, Heat map showing mutations detected in isolated colonies in the eight SCFM2 planktonic cefiderocol-evolved populations. A full coloured square indicates a fixed mutation. f.s., frameshift mutation. c, The ratio of non-synonymous to synonymous mutations (dN/dS) per colony in ancestor and eight SCFM2 planktonic cefiderocol-evolved populations (lines indicate the mean dN/dS for each population; n = 20 colonies per population). d, Cefiderocol MICs of P. aeruginosa clinical isolates from patients with acute and chronic pneumonia who were never treated with cefiderocol (n = 113 independent clinical isolates; dotted line, MIC breakpoint for cefiderocol resistance; solid line, mean). e, Increased cefiderocol MICs in paired sequential clinical isolates. While not technically cefiderocol resistant (MIC > 4 µg ml−1), clinical isolate pairs were recovered from the same patient in which one isolate showed an increased cefiderocol MIC relative to the other (n = 4 pairs of independent clinical isolates). f, Heat map indicating mutations in genes identified as being under selection during cefiderocol experimental evolution in clinical isolates with reduced cefiderocol susceptibility. Columns and colours represent each clinical isolate. CFDC-R, CFDC resistant.
Fig. 3 |
Fig. 3 |. Evolved cefiderocol resistance pays fitness costs.
a, Change in cefiderocol MICs in cefiderocol-resistant evolved populations during continuous passaging for 14 days in cefiderocol-free SCFM2 or SHU (dotted line, cefiderocol susceptibility breakpoint, MIC < 4 µg µl−1, defined by the US Food and Drug Administration; individual population MICs are indicated in grey; red lines indicate daily mean MIC ± s.e.m., n = 8 populations). b, Heat maps indicate the mean frequencies of genetic mutations that increased or decreased in prevalence after 14 days of propagating populations in cefiderocol-free media. Pie charts indicate the fraction of 8 populations in which the mutations were detected either before or after susceptibility was restored. Arrows indicate whether mutations increased or decreased in frequency after populations became susceptible. c, Antimicrobial susceptibilities of cefiderocol-resistant populations compared to untreated control populations (mean fold change ± s.d. in MIC comparing eight evolved populations to control populations; each point indicates mean of three independent experiments per population). d, Growth of evolved and untreated control populations in the absence of cefiderocol in SCFM2 or SHU (two-sided unpaired t-test, mean of eight evolved populations ± s.d.; compared to one control population with three independent experiments per population). m, minutes. e, In vitro competition between ancestral (mApple) and evolved populations (eYFP). CI > 1 indicates that evolved populations outcompeted their ancestors (two-sided unpaired t-test; competitions were performed three times per evolved population; mean CI is indicated for each competition). TOB, tobramycin; COL, colistin; PMB, polymyxin B.
Fig. 4 |
Fig. 4 |. Cross-protection evolved in cefiderocol-resistant populations.
ad, As expected, in vitro competitions revealed that most evolved populations outcompeted ancestors in SCFM2 under high cefiderocol pressure (64 µg ml−1) both in planktonic (a, mean ± s.e.m., n = 3 independent experiments) and in biofilm conditions (b). However, some cefiderocol-resistant populations evolved cooperative social behaviour allowing ancestral cefiderocol-susceptible cells to survive cefiderocol insult in well-mixed planktonic (c, mean ± s.e.m., n = 3 independent experiments) and structured aggregate biofilm environments (d). Representative 3D confocal micrographs of non-protective (b) and protective (d) interactions between cefiderocol-resistant evolved populations (green) and ancestral susceptible populations (red) in the presence of 64 µg µl−1 cefiderocol (ad, eight populations were tested with three independent experiments each). RFU, relative fluorescence units. e, Heat map showing differential gene expression in protective and non-protective interactions under 64 µg ml−1 cefiderocol pressure (log2 fold change indicated; cutoff, >1.5 log2 fold change and false discovery rate (FDR) < 0.05). f, Volcano plot highlighting differentially expressed genes in protective compared to non-protective interactions (DEG, differentially expressed gene; adjusted P < 0.05 with log2 fold change of >1.5). g, Cefiderocol MICs of PAO1 and cpxS variants (mean ± s.e.m., ANOVA, n = 8 independent experiments). h, Planktonic competitions of PAO1 and cpxS variants (T163P, S227G, V235A) in SCFM2 with ½ × cefiderocol MIC. The growth of PAO1 was measured by mApple fluorescence area under the curve (AUC; mean ± s.e.m., ANOVA, n = 3 independent experiments). i, Biofilm competition between PAO1 and cpxSS227G in SCFM2 in the absence (left) and presence (right) of 2 µg ml−1 cefiderocol. Representative confocal micrograph from a single experiment is shown.
Fig. 5 |
Fig. 5 |. The role of pyoverdine in cross-protection.
a, Pyoverdine (RFU: excitation, 400 nm; emission, 460 nm) production by PAO1 and cpxS variants (T163P, S227G and V235A) in SCFM2 with sub-inhibitory cefiderocol (mean ± s.e.m., ANOVA, Dunnett’s multiple comparisons test, n = 4 independent experiments). b, Pyoverdine removes iron from cefiderocol. Iron binding to pyoverdine indicated by fluorescence quenching: as pyoverdine binds free iron or iron from cefiderocol, fluorescence decreases (mean ± s.d., n = 2 independent experiments). Lines indicate fluorescence of molecules alone, after pre-incubation with 100 µM FeCl3, or after incubation with iron-loaded pyoverdine. RFU, relative fluorescence units. c, Changes in cefiderocol susceptibility in the presence of pyoverdine (PVD) and pyochelin (PCH) expressed by log2 cefiderocol fractional inhibitory concentration (FIC) (mean ± s.e.m., n = 3 independent experiments). d, Pyoverdine production by P. aeruginosa ICU clinical isolates in relation to cefiderocol susceptibility (Spearman correlation, n = 113 clinical isolates). e, Pyochelin production by P. aeruginosa ICU clinical isolates in relation to cefiderocol susceptibility (Spearman correlation, n = 113 clinical isolates). f, Pyoverdine protects K. pneumoniae (Kp), E. coli (Ec), B. cenocepacia (Bc) and B. multivorans (Bm) from cefiderocol killing in a dose-dependent manner. The change in MIC is expressed by the log2 cefiderocol FIC (n = 6 independent experiments, mean ± s.d.). g,h, Interspecies planktonic competitions between P. aeruginosa PAO1::mApple or cpxSS227G::mApple and K. pneumoniae::eYFP (g) or E. coli::eYFP (h) in the presence of inhibitory cefiderocol. Growth of K. pneumoniae and E. coli were measured by eYFP fluorescence AUC (mean ± s.e.m., ANOVA, Kruskal–Wallis test, n = 5 independent experiments). i,j, Interspecies planktonic competitions between P. aeruginosa clinical isolates (121a, a low pyoverdine producer, and 172aC, high pyoverdine producer) and K. pneumoniae (i) or E. coli (j) in the absence of antibiotics. k,l, Interspecies planktonic competitions between P. aeruginosa clinical isolates (121a and 172aC) and K. pneumoniae (k) or E. coli (l) in the presence of cefiderocol. For il, K. pneumoniae and E. coli were quantified by CFUs (mean ± s.e.m., n = 4 independent experiments; dashed line, limit of detection). m, Pyoverdine production in P. aeruginosa PAO1 and cpxSS227G strains in co-culture with K. pneumoniae or E. coli in the presence of cefiderocol (mean ± s.e.m., ANOVA, Kruskal–Wallis test, n = 4 independent experiments). n, Pyoverdine production in P. aeruginosa 121a and 172aC clinical isolates in co-culture with K. pneumoniae or E. coli in the presence of cefiderocol (mean ± s.e.m., ANOVA, Kruskal–Wallis test, n = 4 independent experiments).
Fig. 6 |
Fig. 6 |. Cefiderocol resistance and cross-protection mechanisms.
a, Cefiderocol resistance is multifactorial. We identified variants arising under continuous cefiderocol pressure in genes associated with drug uptake, drug efflux, transcriptional regulation, metabolism and hypothetical genes of unknown function. Mutations in transcriptional regulators (nalD) or two-component systems (cpxS) likely regulate the expression of efflux pumps (mexAB-oprM) or iron transporters (piuA, pirA, fpvA, fptA) involved in cefiderocol uptake. Although drug target modification is a common mechanism of resistance, we did not detect mutations in ftsI (PBP3, labelled in grey). Therefore, cefiderocol resistance is primarily driven by increased drug efflux or limiting cefiderocol uptake. Another resistance mechanism involved increased pyoverdine secretion (via muxABC-opmB), which chelates iron from cefiderocol and restrains its uptake. b, Bacterial siderophores act as public goods and promote bacterial cross-protection via cooperation. Cefiderocol must be in its ferric form to be transported inside bacterial cells. Siderophores with high affinities for ferric iron can directly displace iron from cefiderocol, which limits its uptake. Susceptible P. aeruginosa cells and members of polymicrobial communities are cross-protected by the secretion and diffusion of pyoverdine benevolently produced by cefiderocol-resistant cooperators.

Update of

References

    1. Huemer M, Mairpady Shambat S, Brugger SD & Zinkernagel AS Antibiotic resistance and persistence—implications for human health and treatment perspectives. EMBO Rep 21, e51034 (2020). - PMC - PubMed
    1. Tacconelli E et al. Surveillance for control of antimicrobial resistance. Lancet Infect. Dis 18, e99–e106 (2018). - PubMed
    1. Nathwani D, Raman G, Sulham K, Gavaghan M & Menon V Clinical and economic consequences of hospital-acquired resistant and multidrug-resistant Pseudomonas aeruginosa infections: a systematic review and meta-analysis. Antimicrob. Resist. Infect. Control 3, 32 (2014). - PMC - PubMed
    1. Mittal R, Aggarwal S, Sharma S, Chhibber S & Harjai K Urinary tract infections caused by Pseudomonas aeruginosa: a minireview. J. Infect. Public Health 2, 101–111 (2009). - PubMed
    1. Ferreiro JLL et al. Pseudomonas aeruginosa urinary tract infections in hospitalized patients: mortality and prognostic factors. PLoS ONE 12, e0178178 (2017). - PMC - PubMed

LinkOut - more resources