. 2024 Mar;25(3):432-447.
doi: 10.1038/s41590-024-01756-6. Epub 2024 Feb 26.

The astrocyte-produced growth factor HB-EGF limits autoimmune CNS pathology

Affiliations

The astrocyte-produced growth factor HB-EGF limits autoimmune CNS pathology

Mathias Linnerbauer et al. Nat Immunol. 2024 Mar.

Abstract

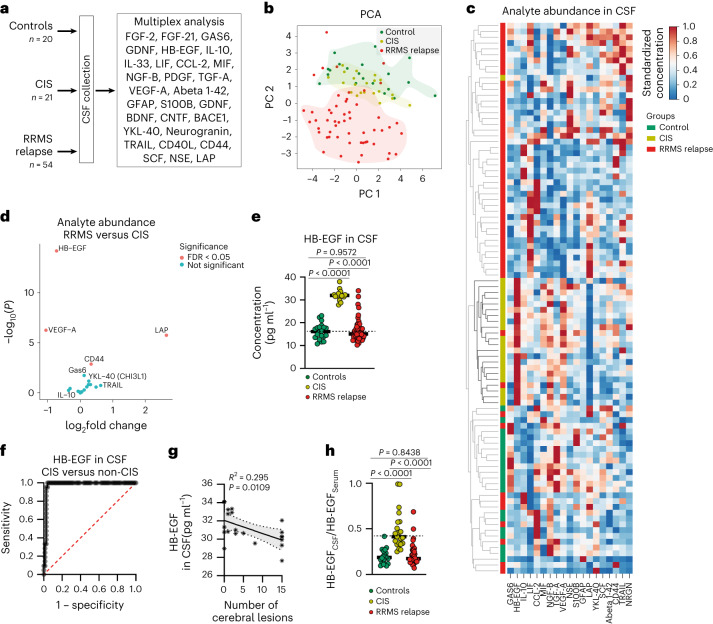
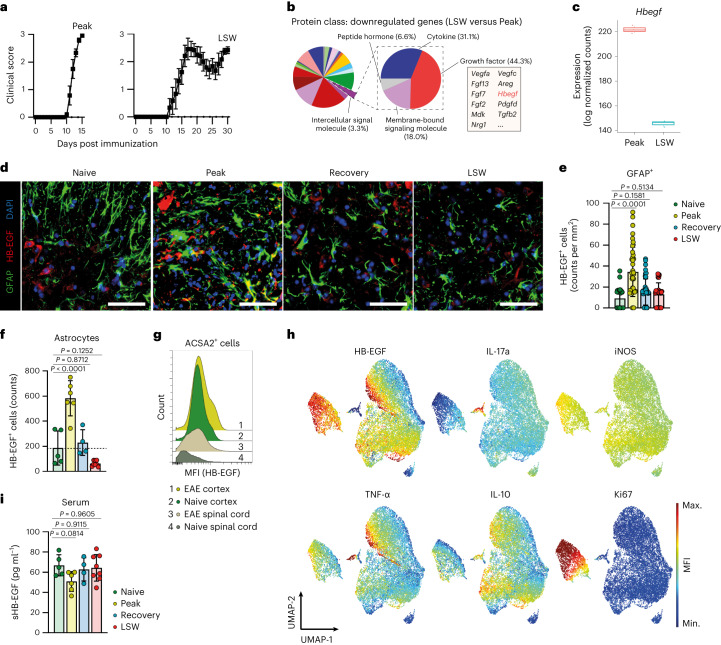
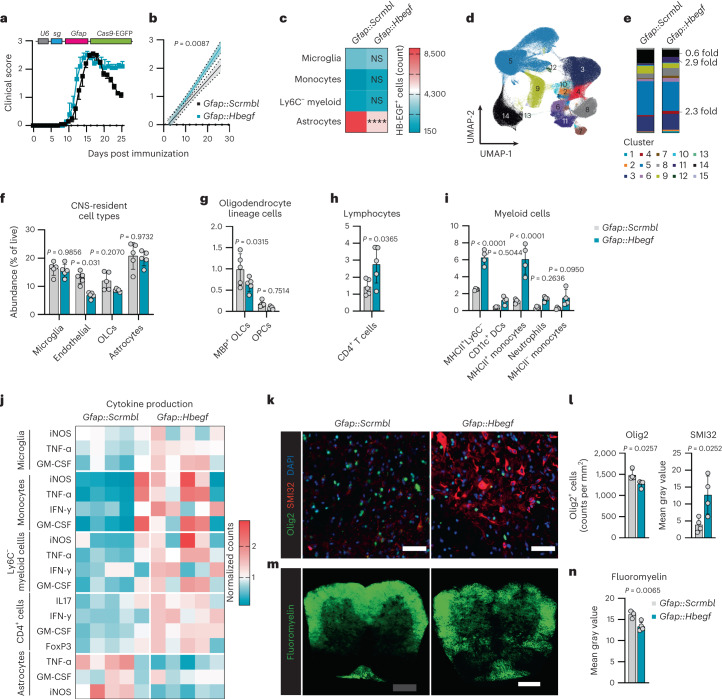
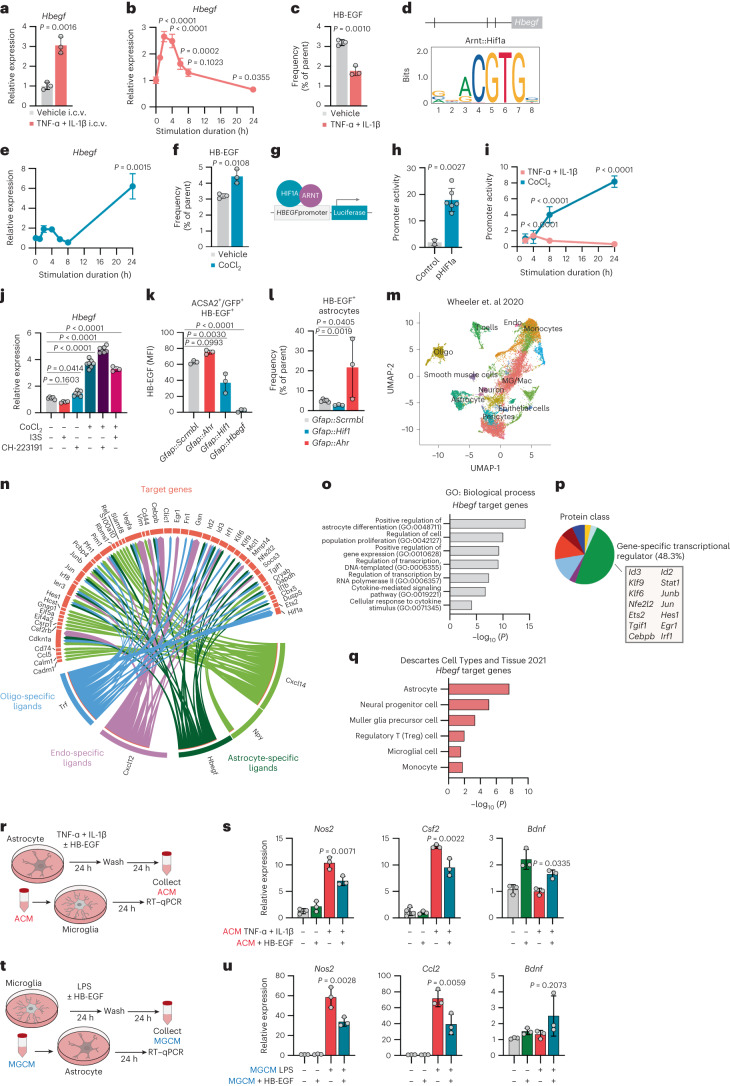
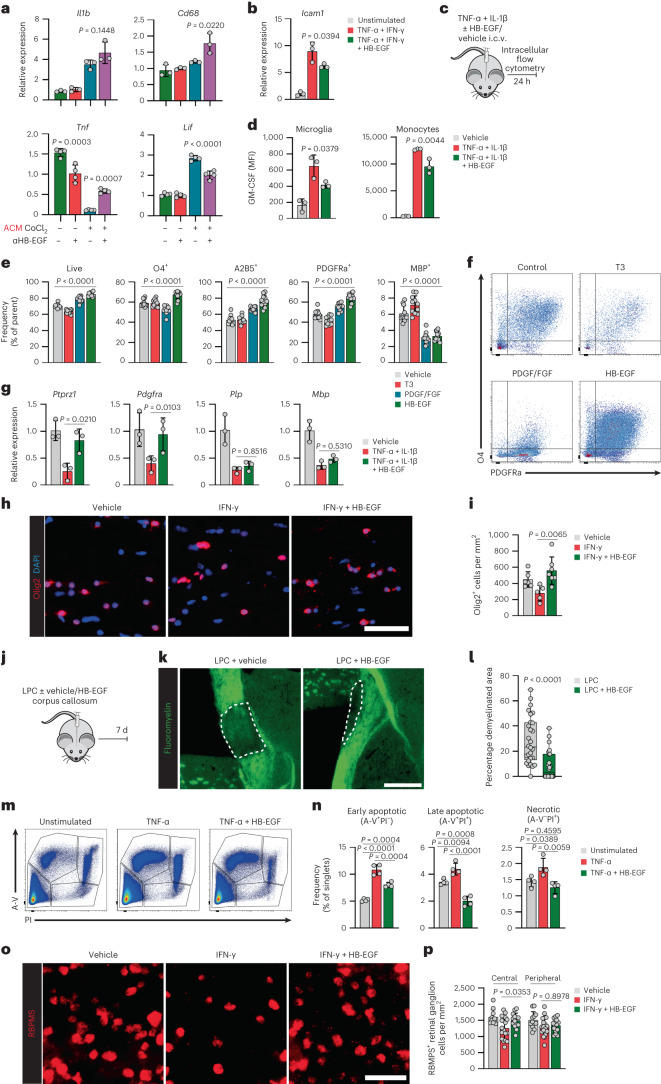
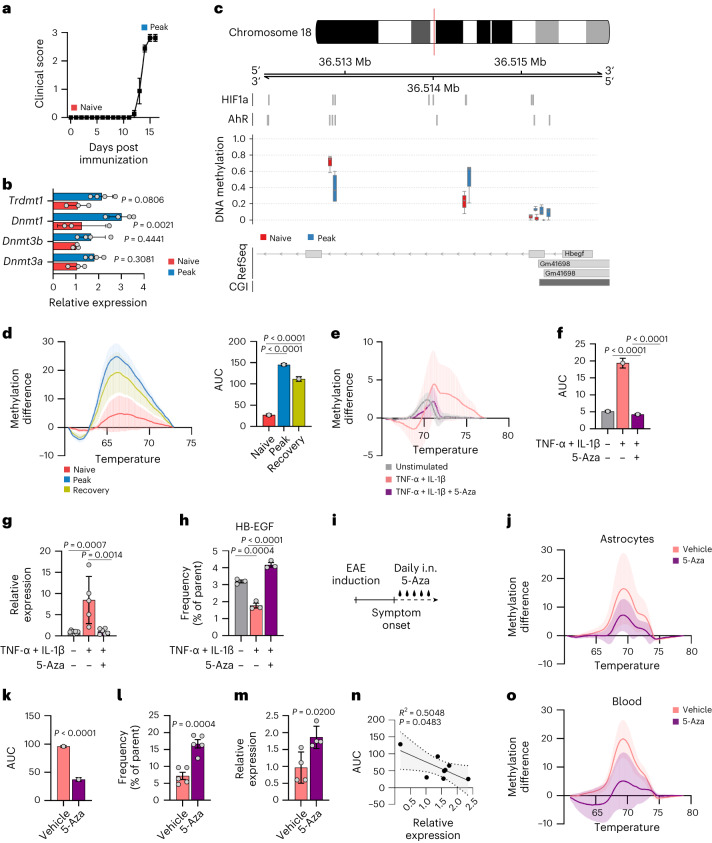
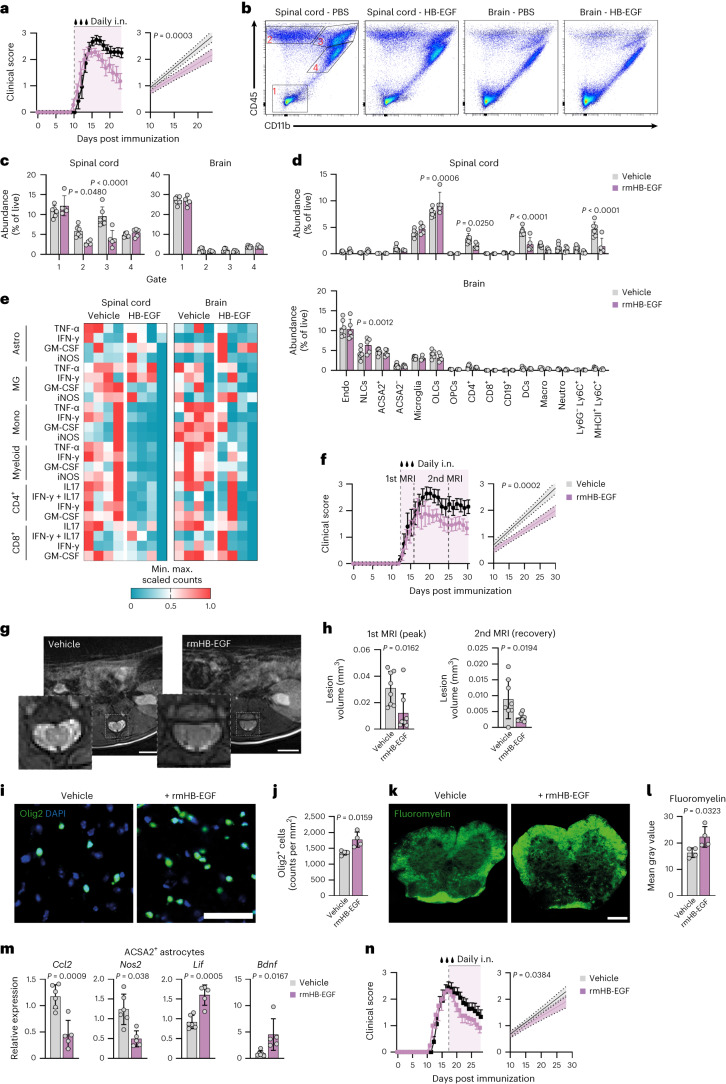
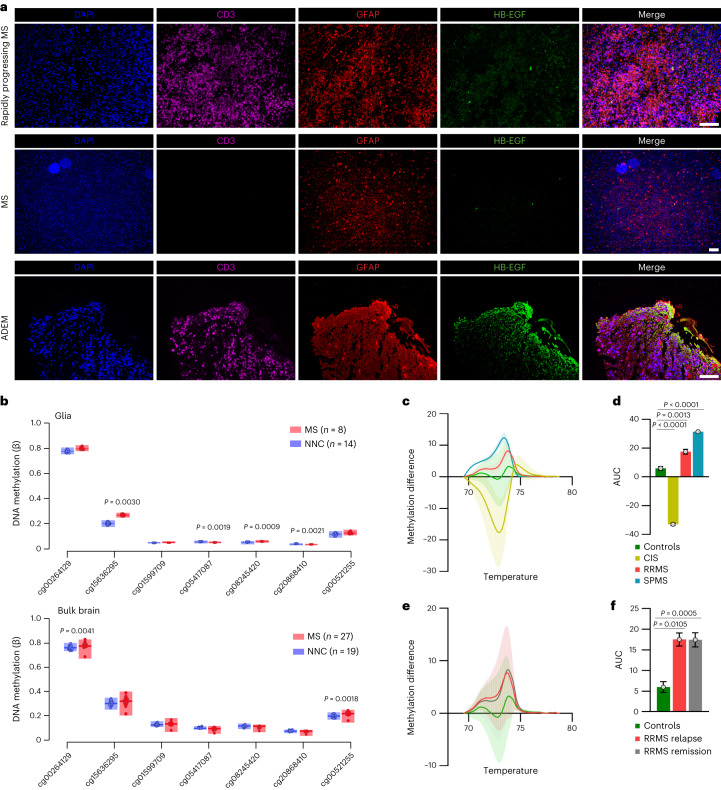
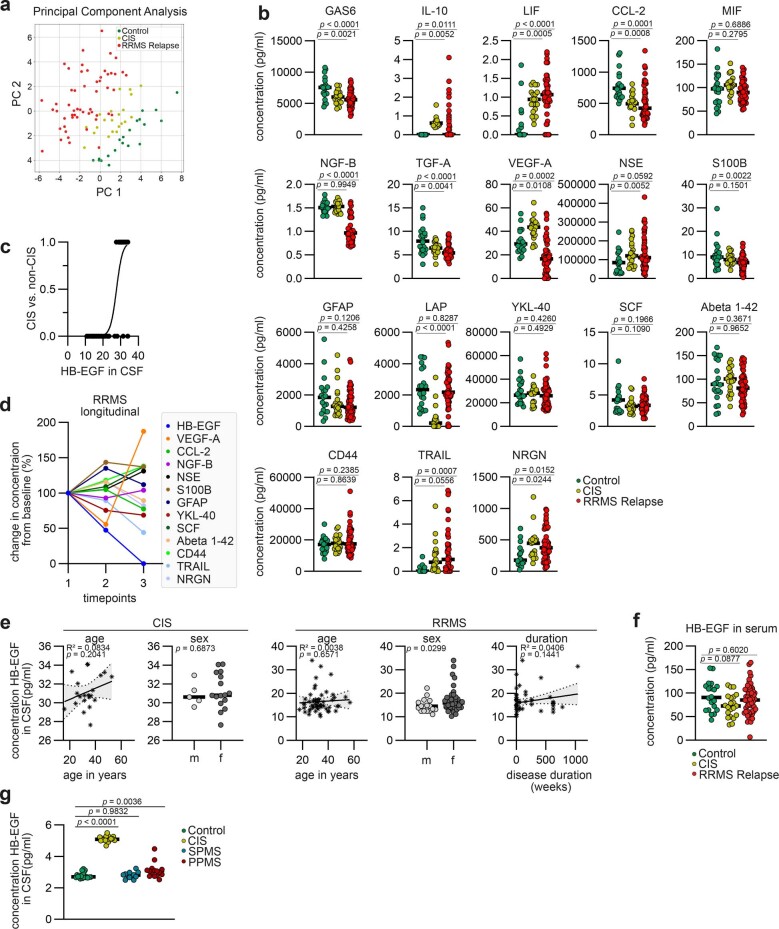
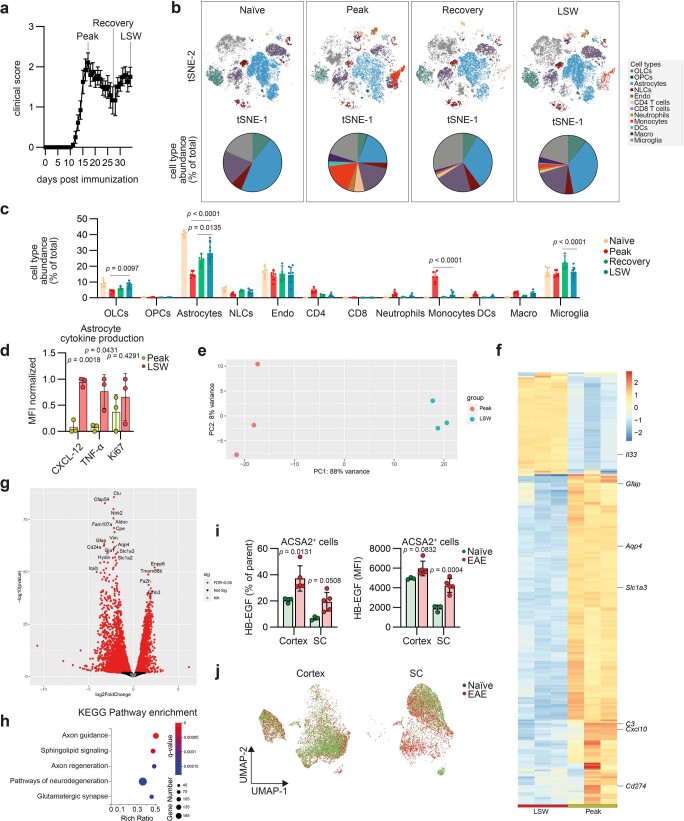
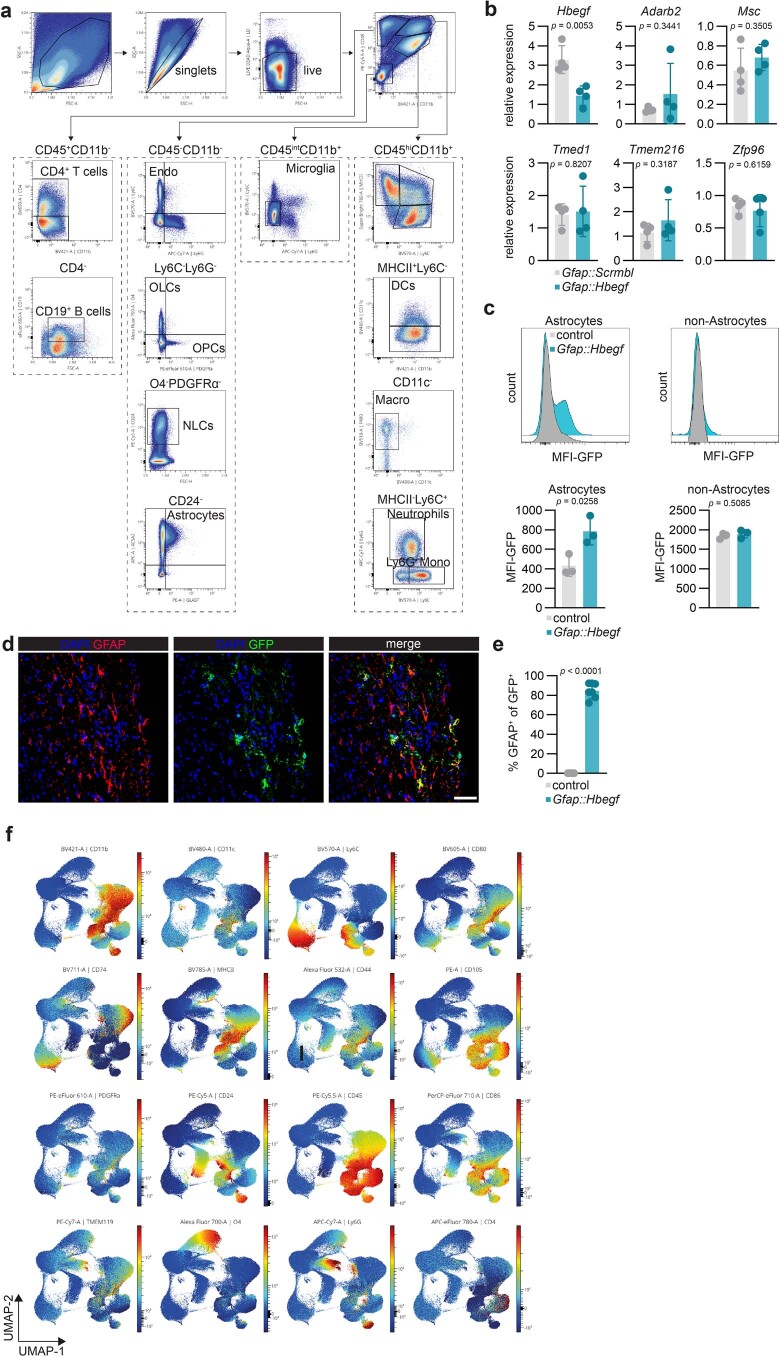
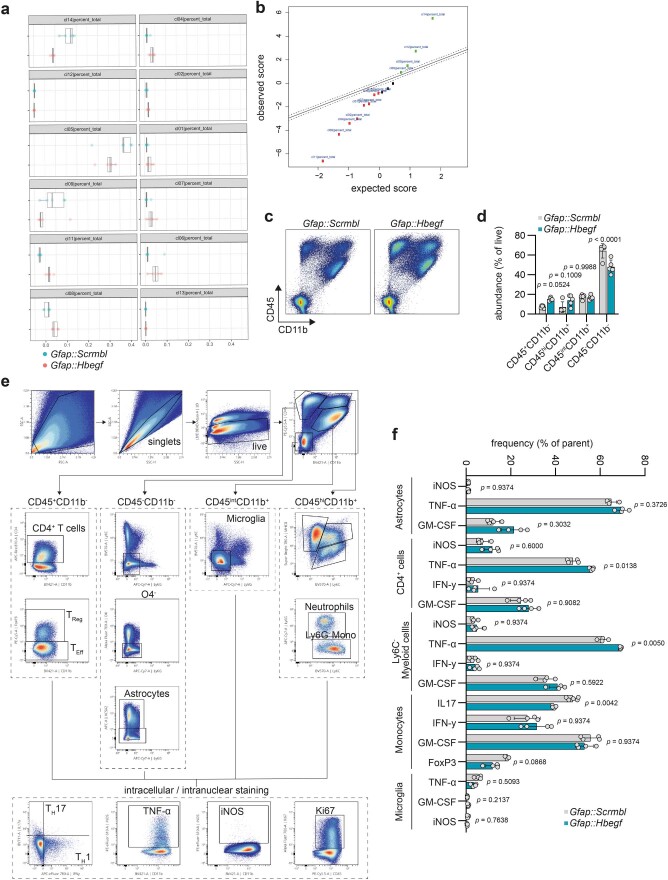
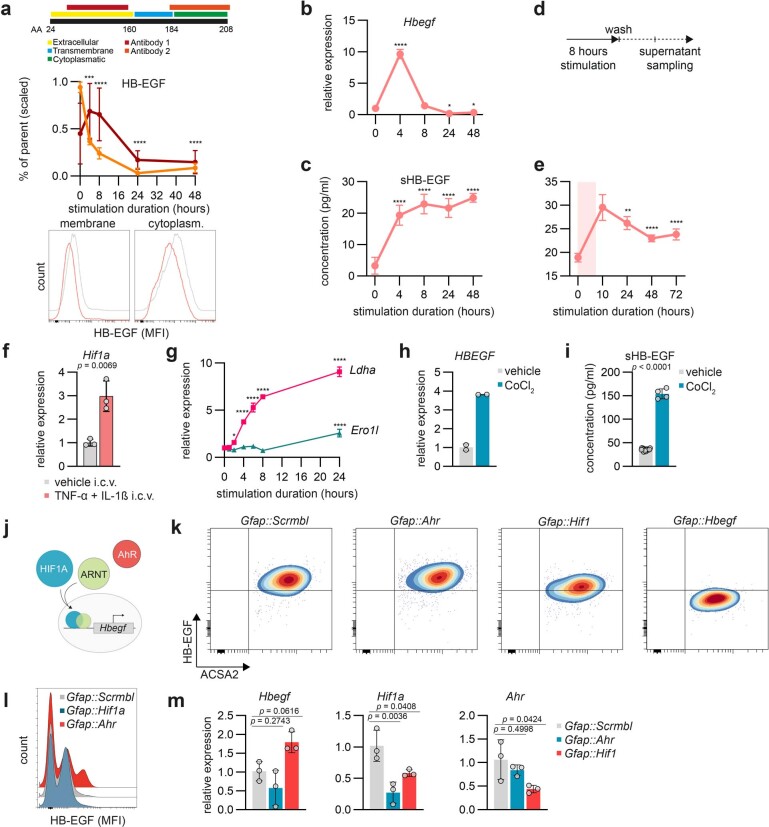
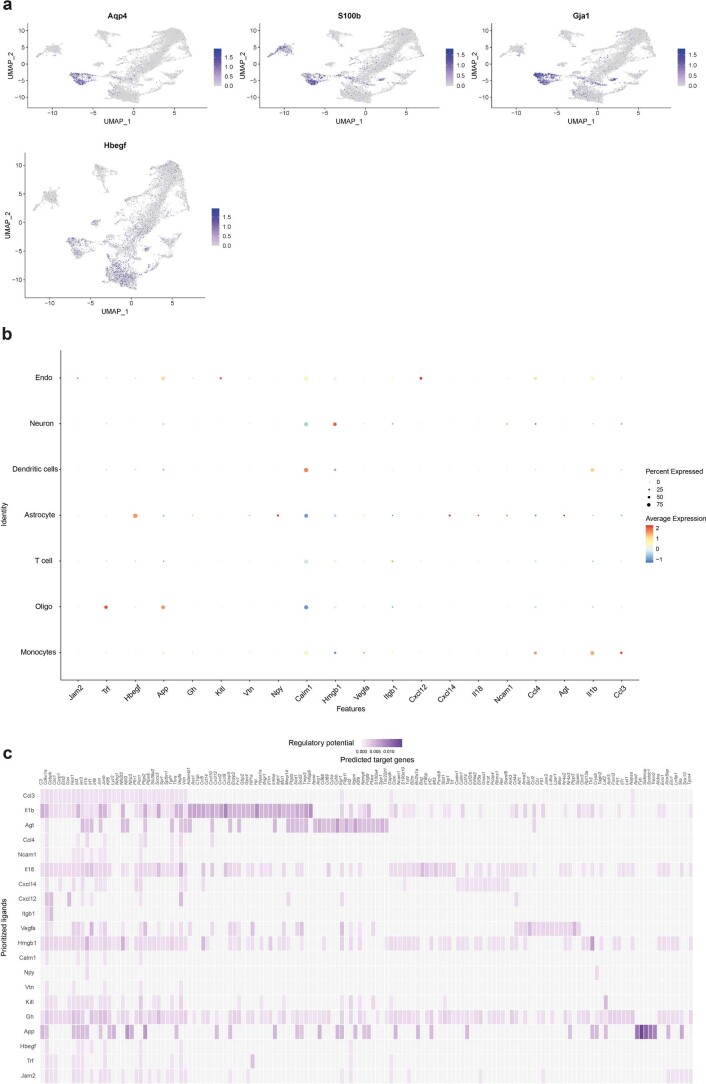
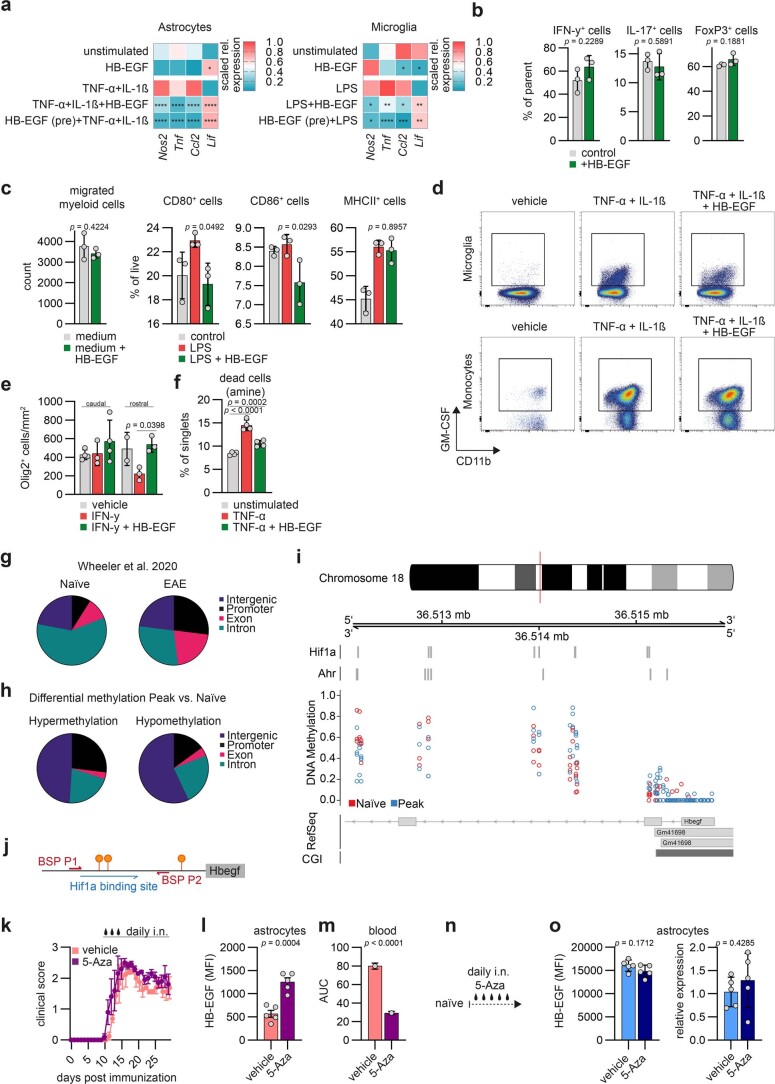
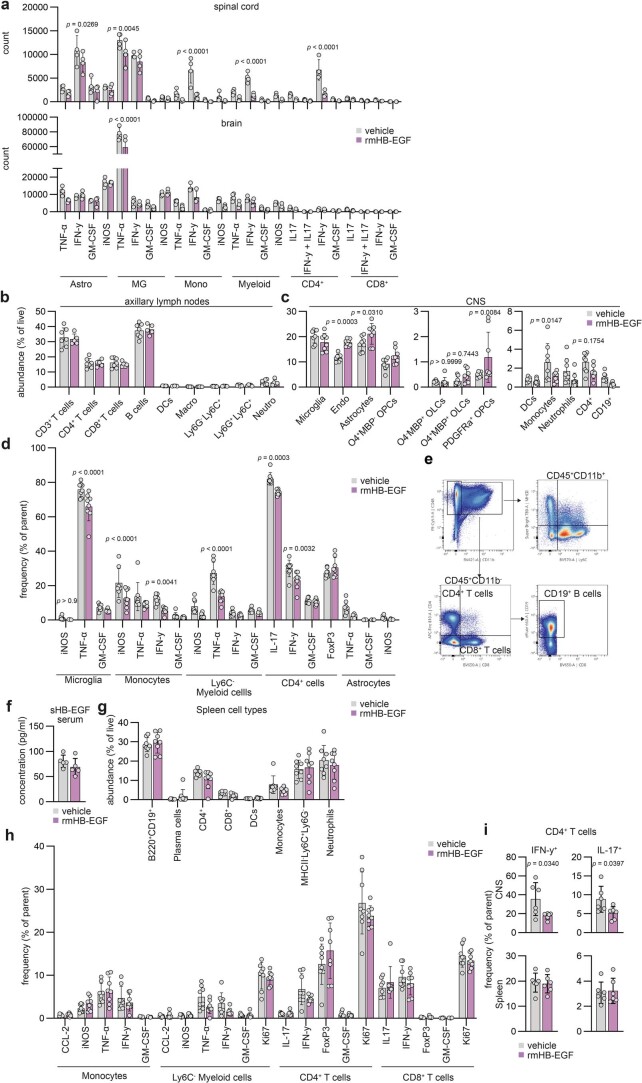
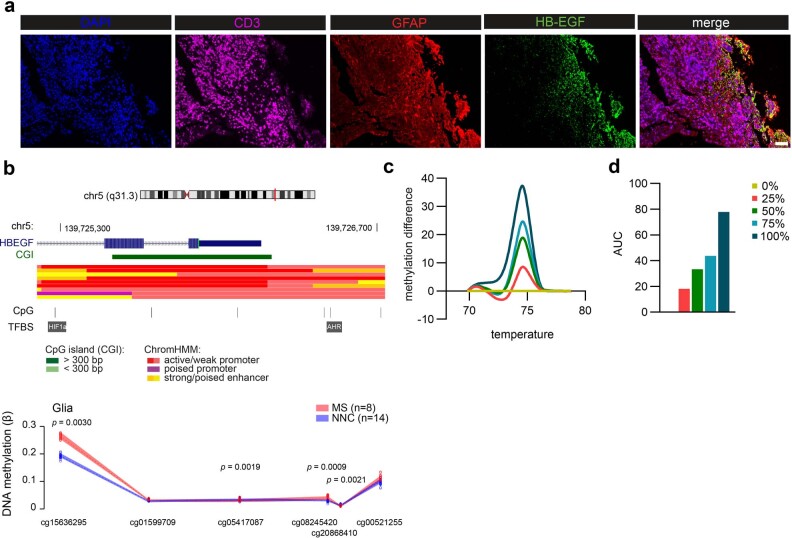
Central nervous system (CNS)-resident cells such as microglia, oligodendrocytes and astrocytes are gaining increasing attention in respect to their contribution to CNS pathologies including multiple sclerosis (MS). Several studies have demonstrated the involvement of pro-inflammatory glial subsets in the pathogenesis and propagation of inflammatory events in MS and its animal models. However, it has only recently become clear that the underlying heterogeneity of astrocytes and microglia can not only drive inflammation, but also lead to its resolution through direct and indirect mechanisms. Failure of these tissue-protective mechanisms may potentiate disease and increase the risk of conversion to progressive stages of MS, for which currently available therapies are limited. Using proteomic analyses of cerebrospinal fluid specimens from patients with MS in combination with experimental studies, we here identify Heparin-binding EGF-like growth factor (HB-EGF) as a central mediator of tissue-protective and anti-inflammatory effects important for the recovery from acute inflammatory lesions in CNS autoimmunity. Hypoxic conditions drive the rapid upregulation of HB-EGF by astrocytes during early CNS inflammation, while pro-inflammatory conditions suppress trophic HB-EGF signaling through epigenetic modifications. Finally, we demonstrate both anti-inflammatory and tissue-protective effects of HB-EGF in a broad variety of cell types in vitro and use intranasal administration of HB-EGF in acute and post-acute stages of autoimmune neuroinflammation to attenuate disease in a preclinical mouse model of MS. Altogether, we identify astrocyte-derived HB-EGF and its epigenetic regulation as a modulator of autoimmune CNS inflammation and potential therapeutic target in MS.


Conflict of interest statement

The authors declare no competing interests.

Figures

Fig. 1
Fig. 1. Regulation of HB-EGF during autoimmune CNS inflammation.
a, Multiplex analysis of CSF of controls (n = 20) and CIS (n = 21) and RRMS (n = 54) patients. b, PCA of the CSF abundance of the measured analytes in controls (n = 20) and CIS (n = 21) and RRMS (n = 54) patients. c, Absolute CSF concentrations of the measured analytes in the CSF of controls (n = 20) and CIS (n = 21) and RRMS (n = 54) patients clustered by Euclidian distance. d, Volcano plot depicting the log2 fold change in analyte abundance in the CSF of CIS (n = 21) versus RRMS (n = 54) patients. e, CSF concentration of HB-EGF in controls (n = 20) and CIS (n = 21) and RRMS (n = 54) patients. f, Receiver operating curve describing CSF HB-EGF concentration as classifier for CIS versus non-CIS diagnosis. g, Linear regression analysis with 95% confidence intervals of HB-EGF concentration in the CSF of CIS patients (n = 21) and the number of cerebral lesions. h, Patient-specific ratio between HB-EGF in the CSF (HB-EGFCSF) and HB-EGF in the serum (HB-EGFSerum) in controls (n = 20) and CIS (n = 21) and RRMS (n = 54) patients. Data are shown as mean ± s.d. Ordinary one-way ANOVA with Tukey’s multiple comparisons test in e and h. PC, Principal Component. Source data
Fig. 2
Fig. 2. Expression of HB-EGF by reactive astrocytes.
a, EAE development and timepoints (peak, LSW) used for RNA-seq analysis of ACSA2+ cortical astrocytes (n = 5 per group). b, PANTHER Protein class analysis of genes downregulated in LSW compared with peak astrocytes. c, Normalized RNA expression of Hbegf by LSW and peak astrocytes (n = 3 per group). Data are shown as mean with the 25th and 75th percentiles. d,e, Immunostaining (d) and quantification (e) of HB-EGF+GFAP+ cells in spinal cords of EAE (peak, recovery, LSW; n = 4 per timepoint) and naive mice (n = 3). Scale bar, 50 µm. f, Flow cytometric analysis of HB-EGF+ astrocytes during peak (n = 6), recovery (n = 4) and LSW (n = 7) and in naive mice (n = 5). g, Representative histogram depicting median fluorescence intensity (MFI) of HB-EGF in cortex and spinal cord astrocytes of EAE and naive mice (n = 3/5 per group). h, UMAP plot of ACSA2+ astrocytes analyzed by multidimensional intracellular flow cytometry; colors indicate MFI. i, Serum levels of sHB-EGF in EAE mice over the course of disease. Peak n = 6, recovery n = 4, LSW n = 8, naive n = 5. Data are shown as mean ± s.d. Data are shown as mean ± s.e.m. in a. Ordinary one-way ANOVA with Dunnett’s multiple comparisons test (tested against naive) in e, f and i. Source data
Fig. 3
Fig. 3. Astrocyte-derived HB-EGF is important for recovery from EAE.
a,b, EAE development (a) and regression analysis from EAE start (b) in mice transduced with Gfap::Scrmbl (n = 5) and Gfap::Hbegf (n = 5). The experiment was repeated twice. c, Absolute counts of HB-EGF+ cells in the CNS of Gfap::Scrmbl (n = 4) and Gfap::Hbegf (n = 4) mice analyzed by intracellular flow cytometry. d,e, UMAP plot of CNS cells (d) with FlowSOM clusters (e) analyzed by high-dimensional flow cytometry in Gfap::Scrmbl (n = 5) and Gfap::Hbegf (n = 5) mice. fi, Abundance of microglia, endothelial cells and OLCs (f), myelinating OLCs and OPCs (g), CD4+ T cells (h) and infiltrating myeloid cells (i) in the CNS of Gfap::Scrmbl (n = 4/5) and Gfap::Hbegf (n = 4/5) mice. A detailed gating strategy is provided in Extended Data Fig. 3b. j, Cytokine production by microglia, monocytes, Ly6C myeloid cells, CD4+ T cells and astrocytes in the CNS of Gfap::Scrmbl (n = 5) and Gfap::Hbegf (n = 5) mice analyzed by intracellular flow cytometry. Counts were normalized to vehicle-treated mice. Additional statistics and gating strategy are provided in Extended Data Figs. 3b and 4e. k,l, Immunostaining (k) and analyses (l) of Olig2 and SMI32 in spinal cords of Gfap::Scrmbl (n = 4) and Gfap::Hbegf (n = 4). Scale bar, 50 µm. m,n, Immunostaining (m) and analysis (n) of fluoromyelin in spinal cords of Gfap::Scrmbl (n = 3) and Gfap::Hbegf (n = 5). Scale bar, 200 µm. All data were collected at day 25 post immunization. Data are shown as mean ± s.d. if not indicated otherwise. Data are shown as mean ± s.e.m. in a. Two-way ANOVA with Sidak’s multiple comparisons test in c, f, g, h and i; unpaired t-test in l and n. ****pP < 0.0001. DC, dendritic cell; NS, not significant. Source data
Fig. 4
Fig. 4. HIF1α and AhR oppositely control HB-EGF in astrocytes.
a, RT–qPCR analysis of Hbegf expression by ACSA2+ astrocytes following i.c.v. injection of TNF-α and IL-1β or vehicle. n = 3 per group. b, RT–qPCR analysis of Hbegf expression by primary mouse astrocytes over 24 h following stimulation with TNF-α and IL-1β or vehicle. Unstimulated controls (timepoint 0) were used as reference. n = 4 per timepoint. c, Relative expression (% of parent) of HB-EGF by primary mouse astrocytes following stimulation with TNF-α and IL-1β or vehicle, quantified by intracellular flow cytometry. n = 3 per group. d, Representative example of a predicted Arnt::Hif1a-binding site in the Hbegf promoter identified by JASPAR. e, RT–qPCR analysis of Hbegf expression by primary mouse astrocytes stimulated with CoCl2 over 24 h. n = 4 per timepoint. f, Intracellular flow cytometric analysis of HB-EGF expression by primary mouse astrocytes under pseudohypoxic conditions (CoCl2) for 24 h. n = 3 per group. g, Schematic depicting the HBEGF luciferase promoter–reporter construct, where activation of the HBEGF promoter drives the expression of a Gaussia luciferase. h, HBEGF promoter activity in HEK293T cells co-transfected with an HBEGF promoter activity reporter construct and a stably active HIF1α (pHIF1a, n = 6) or control vector (n = 2). i, HBEGF promoter activity in HEK293T cells following stimulation with TNF-α and IL-1β, or CoCl2, over 24 h. n = 5 per group and timepoint. j, RT–qPCR analysis of Hbegf expression in primary mouse astrocytes following stimulation with CoCl2, I3S, CH-223191 or a combination. n = 3–7 per group. k, Flow cytometric quantification of HB-EGF expression in primary mouse astrocytes (ACSA2+GFP+) transduced with a control (Gfap::Scrmbl), AhR (Gfap::Ahr), HIF1α (Gfap::Hif1) or HB-EGF (Gfap::Hbegf) targeting CRISPR–Cas9 vector, quantified by intracellular flow cytometry. n = 3 per group. l, Relative expression (% of parent) of HB-EGF by astrocytes in Gfap::Scrmbl (n = 5), Gfap::Hif1a (n = 3) and Gfap::Ahr (n = 3) mice quantified by intracellular flow cytometry. m, UMAP plot of CNS cells from mice with EAE; data were obtained from Wheeler et al.. MG, microglia; Mac, macrophages; Endo, endothelial cells; Oligo, oligodendrocytes. n, NicheNet circle plot depicting ligand–target genes in CNS cells from EAE mice. o, GO enrichment analysis (Biological Process) of Hbegf target genes. p, PANTHER Protein class analysis of Hbegf target genes. q, Enrichment analysis (Descartes Cell Types and Tissue 2021) of Hbegf target genes. r,s, Schematic (r) and RT–qPCR analysis (s) of Nos2, Csf2 and Bdnf expression in microglia stimulated with ACM from primary mouse astrocytes activated with TNF-α, IL-1β ± HB-EGF. n = 3 per group. Astrocytes were stimulated for 24 h and extensively washed before the addition of fresh medium and collection of ACM 24 h later. t,u, Schematic (t) and RT–qPCR analysis (u) of Nos2, Ccl2 and Bdnf expression in astrocytes stimulated with microglia-conditioned medium (MGCM) from primary mouse microglia activated with LPS ± HB-EGF. n = 3 per group. Microglia were stimulated for 24 h and extensively washed before the addition of fresh medium and collection of MGCM 24 h later. Data are shown as mean ± s.d. if not indicated otherwise. Unpaired t-test in a, c, f and h; one-way ANOVA with Dunnett’s multiple comparisons test (tested against control) in b, e, j, k, l, s and u; two-way ANOVA with Sidak’s multiple comparisons test in i. Source data
Fig. 5
Fig. 5. HB-EGF exerts anti-inflammatory and tissue-protective effects on CNS-resident and -infiltrating cell types.
a, RT–qPCR analysis of Il1b, Cd68, Tnf and Lif expression in microglia pre-activated with LPS for 8 h and stimulated with ACM derived from pseudohypoxic (CoCl2) astrocytes, where astrocyte-derived HB-EGF was blocked by an anti-HB-EGF (αHB-EGF) antibody for 24 h. n = 3/4 per group. b, RT–qPCR analysis of Icam1 expressed by primary mouse BMVECs stimulated with TNF-α, IFN-γ ± HB-EGF or vehicle. n = 3 per group. c, Schematic of i.c.v. injection of TNF-α and IL-1β ± HB-EGF or vehicle, followed by intracellular flow cytometry after 24 h. d, MFI of GM-CSF production by CD45intCD11b+ microglia (left) and CD45hiCD11b+Ly6C+ monocytes (right) following i.c.v. injection of TNF-α and IL-1β ± HB-EGF or vehicle. n = 3 per group. e, Quantification of survival and the expression (% of parent) of differentiation markers by primary mouse oligodendrocytes at day 5 of culture in the presence of HB-EGF, T3, PDGF/FGF or vehicle quantified by flow cytometry. n = 11 per group. f, Representative scatter plots depicting PDGFRα and O4 expression by primary mouse oligodendrocytes at day 5 of culture in the presence of HB-EGF, T3, PDGF/FGF or vehicle. g, RT–qPCR analysis of Ptprz1, Pdgfra, Plp and Mbp expression by O4+ oligodendrocytes following i.c.v. injection of TNF-α, IL-1β ± HB-EGF. n = 3 per group. h,i, Immunostaining (h) and quantification (i) of Olig2+ cells in optic nerves stimulated with IFN-γ ± HB-EGF or vehicle. n = 5–7. Scale bar, 50 µm. jl, Schematic (j), fluoromyelin staining (k) and quantification (l) of LPC-induced demyelination in the corpus callosum. n = 28. Scale bar, 400 µm. Data are shown as median with the 25th and 75th percentiles. m, Representative scatter plots of neuronal cells stained with Annexin V (A-V) and propidium iodide (PI) following stimulation with TNF-α ± HB-EGF or vehicle. n, Quantification of early apoptotic (A-V+PI), late apoptotic (A-V+PI+) and necrotic (A-VPI+) neuronal cells following stimulation with TNF-α ± HB-EGF, or vehicle. n = 4 per group. o,p, Immunostaining (o) and quantification (p) of RBPMS+ retinal ganglion cells in retinae stimulated with IFN-γ ± HB-EGF or vehicle. n = 11–19 per group. Scale bar, 50 µm. Data are shown as mean ± s.d. One-way ANOVA with Dunnett’s (tested against control) or Tukey’s multiple comparisons test if not indicated otherwise. Unpaired t-test in l. Source data
Fig. 6
Fig. 6. Epigenetic mechanisms govern HB-EGF expression during autoimmune CNS inflammation.
a, EAE development and timepoints (peak, naive) used for WGBS of astrocytes isolated by FACS. n = 4 per timepoint. b, RT–qPCR analysis of DNA-methyltransferases (DNMT) expressed in FACS-isolated astrocytes during peak EAE (n = 4) and naive (n = 3) stages. c, Quantification of DNA methylation at HIF1α and AhR binding sites in the Hbegf locus in astrocytes during peak EAE (n = 4) and naive (n = 4) stages. d, HRM with difference plot and area under the curve (AUC) of bisulfite-converted gDNA of the Hbegf promoter region from FACS-sorted astrocytes obtained from the CNS of naive or EAE mice at peak or recovery stages. n = 4 (3 replicates per sample) per timepoint. Group means were used for AUC analysis. e,f, HRM with difference plot (e) and AUC analysis (f) of methylation at HIF1α binding sites in the Hbegf promoter in mouse following stimulation with TNF-α and IL-1β ± 5-Aza. n = 4 per group. Group means were used for AUC analysis. g, 5-mC ChIP of the Hbegf promoter region in primary mouse astrocytes following stimulation with TNF-α and IL-1β ± 5-Aza. n = 5–8 per group. h, Intracellular flow cytometric analysis of HB-EGF expression by primary mouse astrocytes following stimulation with TNF-α and IL-1β ± the hypomethylating agent 5-Aza. n = 3 per group. i, Schematic of daily intranasal treatment with 5-Aza during EAE. jm, HRM with difference plot (j), AUC analysis (k), relative levels (% of parent) of HB-EGF by flow cytometry (l) and relative mRNA expression of Hbegf by RT–qPCR in ACSA2+ astrocytes (m) from vehicle- or 5-Aza-treated mice during late-stage EAE. n = 4/5 per group. Group means were used for AUC analysis. n, Linear regression analysis with 95% confidence intervals of methylation in Hbegf promoter regions by AUC and relative Hbegf expression in ACSA2+ astrocytes obtained from vehicle- or 5-Aza-treated mice during late-stage EAE. n = 8. o, HRM analysis of methylation in the Hbegf promoter of cells obtained from whole blood of vehicle- or 5-Aza-treated mice during late-stage EAE. n = 4 per group (3 replicates per sample). Data are shown as mean ± s.d. if not indicated otherwise. Data are shown as mean ± s.e.m. in a. Two-way ANOVA with Sidak’s multiple comparisons test in b; one-way ANOVA with Dunnett’s multiple comparisons test (tested against control) in d, f, g and h; unpaired t-test in k, l and m. i.n., intranasal; Mb, megabases. Source data
Fig. 7
Fig. 7. Intranasal administration of recombinant HB-EGF attenuates neuroinflammation.
a, EAE development and linear regression analysis (from treatment start) of mice treated with rmHB-EGF or vehicle starting at symptom onset (day 10 post immunization). Vehicle n = 7, rmHB-EGF n = 7. Experiments were repeated three times. b,c, Representative scatter plots (b) and quantification (% of live cells; c) of CNS-resident cells (gate 1; CD45-CD11b), infiltrating lymphocytes (gate 2; CD45+CD11b), infiltrating myeloid cells (gate 3; CD45hiCD11b+) and microglia (gate 4; CD45intCD11b+) in the spinal cord and brain of EAE mice treated with rmHB-EGF or vehicle analyzed by flow cytometry after peak of disease. Vehicle n = 6, rmHB-EGF n = 5. d, Representation (% of live) of cell populations in the spinal cord (upper) and brain (lower) of vehicle- or rmHB-EGF-treated mice quantified by high-dimensional flow cytometry. NLCs, neuronal lineage cells; Macro, macrophages; Neutro, neutrophils. Vehicle n = 6, rmHB-EF n = 5. A detailed gating strategy is provided in Extended Data Fig. 3b. e, Heatmap of min. max. scaled cytokine expression by astrocytes (Astro), microglia (MG), monocytes (Mono), myeloid cells (Myeloid), CD4+ T cells and CD8+ T cells in the spinal cord and brains of vehicle- or rmHB-EGF-treated mice. n = 4 per group. A detailed gating strategy is provided in Extended Data Fig. 4e. f, EAE development and linear regression analysis (from treatment start) of mice treated with rmHB-EGF or vehicle starting at symptom onset (day 10 post immunization). Vehicle n = 5, rmHB-EGF n = 6. g, Representative MRI images (T1) of spinal cords from vehicle- and rmHB-EGF-treated EAE mice. Scale bar, 2 mm. h, Lesion volume in spinal cords quantified by MRI in vehicle- or rmHB-EGF-treated mice during peak (left) or recovery (right) stages of EAE. n = 8 per group. i,j, Immunostaining (i) and quantification (j) of Olig2+ cells in the spinal cord of vehicle- or rmHB-EGF-treated mice. n = 4 per group. Scale bar, 50 µm. k,l, Immunostaining (k) and quantification (l) of fluoromyelin in the spinal cord of vehicle- or rmHB-EGF-treated mice. n = 4 per group. Scale bar, 200 µm. m, RT–qPCR analysis of Ccl2, Nos2, Lif and Bdnf expression by ACSA2+ astrocytes derived from vehicle- or rmHB-EGF-treated mice during late-stage EAE. n = 5/6 per group. n, EAE development (left) and linear regression analysis (right, from treatment start) of mice treated with rmHB-EGF or vehicle starting at peak of disease (day 16 post immunization). Vehicle n = 9, rmHB-EGF n = 6. Data are shown as mean ± s.d. if not indicated otherwise. Data are shown as mean ± s.e.m. in a, f and n. Unpaired t-test in h, j, l and m; two-way ANOVA with Sidak’s multiple comparisons test in c and d. Details for linear regression analyses are provided in the Methods section. Source data
Fig. 8
Fig. 8. Expression and epigenetic modulation of HB-EGF in the context of MS.
a, Immunostaining of a stereotactic biopsy from a patient with rapidly progressing MS (upper), established, stable MS (middle) and ADEM (lower). DAPI staining (blue) of nuclei, CD3 staining (purple) of T cells, GFAP staining (red) of astrocytes and HB-EGF staining (green). Scale bar, 100 μm. Patient characteristics are provided in Supplementary Table 4. b, DNA methylation in the HBEGF locus in NeuN glial cells (upper) and bulk tissue (lower) from patients with MS or non-neurological controls (NNCs). n = 8 MS patients, n = 14 NNCs for the methylation analysis in NeuN glial cells; n = 27 MS patients, n = 19 NNCs for the methylation analysis in bulk tissue. c,d, HRM with difference plot (c) and AUC analysis (d) of methylation at HIF1α binding sites in the HBEGF promoter of whole blood samples derived from noninflammatory controls (n = 18), CIS patients (n = 3), RRMS patients (n = 79) or SPMS patients (n = 14). Group means were used for AUC analysis. e,f, HRM with difference plot (e) and AUC analysis (f) of methylation at HIF1α binding sites in the HBEGF promoter of whole blood samples derived from noninflammatory controls (n = 18), RRMS patients during relapse (n = 14) and RRMS patients during remission (n = 64). Group means were used for AUC analysis. Data are shown as mean ± s.d. Limma moderated t-test was used in b; one-way ANOVA with Dunnett’s multiple comparisons test (tested against controls) was used in d and f. Source data
Extended Data Fig. 1
Extended Data Fig. 1. Proteomic profiling of CSF from MS and control patients.
a, Principal Component Analysis (PCA) of the CSF abundance of the measured analytes together with clinical parameters (Supplementary Table 1; Age, EDSS, Therapy, number of cerebral lesions, number of spinal lesions, optic neuritis, relapse frequency, number of relapses, disease duration (in weeks), cell count CSF) in controls (n = 20), CIS (n = 21), and RRMS (n = 54) patients. b, CSF levels of GAS6, IL-10, LIF, CCL-2, MIF, NGF-β, TGF-α, VEGF-A, NSE, S100B, GFAP, LAP, YKL-40, SCF, Aβ1-42, CD44, TRAIL, and NRGN in (n = 20), CIS (n = 21), and RRMS (n = 54) patients. c, logistic regression of CSF HB-EGF levels in CIS (n = 21) vs. non-CIS (n = 74). d, change in concentration of HB-EGF, VEGF-A, NGF-β, CCL-2, NSE, S100B, GFAP, YKL-40, SCF, Aβ1-42, CD44, TRAIL, NRGN from baseline (first timepoint) in a RRMS patient (mean time between timepoints is 85 days). e, correlation between HB-EGF levels in the CSF with age, sex, and disease duration in CIS (left) and RRMS (right) patients. CIS n = 21, RRMS n = 54. f, serum concentration of HB-EGF in controls (n = 43), CIS (n = 21), and RRMS (n = 54) patients. g, CSF concentration of HB-EGF in control (n = 20), CIS (n = 21), SPMS (n = 12), and PPMS patients (n = 15) measured by single-plex ELISA. Patient characteristics are provided in Supplementary Table 2. Data shown as mean ± SD. Unpaired t-test in (e), One-way ANOVA with Dunnett’s multiple comparisons test (tested against controls) in (b, f, g). Source data
Extended Data Fig. 2
Extended Data Fig. 2. Regulation of HB-EGF by astrocytes during autoimmune neuroinflammation.
a, EAE development in wild-type mice with the timepoints analyzed (naïve, peak, recovery, LSW) indicated. n = 20. b, tSNE plots of CNS cells (upper, downsampled to 30000 cells) and cell type abundance (% of singlets; c) analyzed by high-dimensional flow cytometry. OLCs, oligodendrocyte lineage cells; OPCs, oligodendrocyte precursor cells; NLCs, neuronal lineage cells; Endo, endothelial cells; DCs, dendritic cells; Macro, macrophages. Naïve n = 5, Peak n = 6, Recovery n = 4, LSW n = 8. d, median fluorescence intensity (MFI) of CXCL-12, TNF-α, and Ki67 in astrocytes during peak and late-stage worsening (LSW) quantified by intracellular flow cytometry. n = 3 per group. e, principal component analysis (PCA), heatmap (f), and volcano plot (g) of differential gene expression in ACSA2+ astrocytes during peak and LSW analyzed by RNA-Seq. n = 3 per group. h, KEGG Pathway enrichment of LSW astrocytes. i, relative expression (% of parent, left) and MFI (right) of HB-EGF production by cortical and spinal cord astrocytes in naïve (n = 3) and EAE mice (n = 5). j, UMAP plot of ACSA2+ cells (downsampled to 5000 cells) in naïve and EAE mice analyzed by high dimensional flow cytometry. Data shown as mean ± SD if not indicated otherwise. Data shown as mean ± SEM in (a). Two-way ANOVA with Tukey’s multiple comparisons test in (c), unpaired t-test with Holm-Sidak correction in (d), Two-way ANOVA with Sidak’s multiple comparisons test in (h). Source data
Extended Data Fig. 3
Extended Data Fig. 3. Loss of astrocyte-derived HB-EGF worsens neuroinflammation.
a, gating strategy used for the identification of CNS-resident and -infiltrating cell populations by high dimensional flow cytometry. b, RT-qPCR analysis of potential off target genes in ACSA2+ astrocytes isolated from mice injected with a Hbegf-targeting (Gfap::Hbegf) or control (Gfap::Scrmbl) CRISPR/Cas9 construct. n = 4 per group. c, representative histograms and flow cytometric quantification of GFP-reporter signal in astrocytes vs. non-astrocytes obtained from mice injected with Hbegf-targeting (Gfap::Hbegf) CRISPR/Cas9 lentiviral particles or PBS (control). n = 3 per group. d, representative immunostaining and quantification (e) of GFP+ GFAP+ cells in spinal cords from injected with Hbegf-targeting (Gfap::Hbegf, n = 7) CRISPR/Cas9 lentiviral particles or PBS (control, n = 6). f, UMAP plots of CNS cells in Gfap::Scrmbl and Gfap::Hbegf mice analyzed by high-dimensional flow cytometry; colors indicate median fluorescence intensity (MFI). Data shown as mean ± SD. Unpaired t-test in (b, c, e). Source data
Extended Data Fig. 4
Extended Data Fig. 4. The effect of astrocyte-specific HB-EGF abrogation during EAE.
a, Significance Analysis of Microarrays (SAM) of FlowSOM clusters from CNS cells obtained from Gfap::Scrmbl and Gfap::Hbegf mice analyzed by high-dimensional flow cytometry. n = 5 per group. b, SAM plot depicting significant alterations in cluster abundance in Gfap::Scrmbland Gfap::Hbegf mice analyzed by high-dimensional flow cytometry. n = 5 per group. c, representative scatter plots and quantification (d) of CD45+CD11b infiltrating lymphocytes, CD45hiCD11b+ myeloid cells, CD45intCD11b+ microglia, and CD45CD11b cells in the CNS of Gfap::Scrmbl and Gfap::Hbegf mice. n = 5 per group. e, gating strategy used for the quantification of cytokines and intranuclear factors by intracellular flow cytometry. f, cytokine expression (% of parent) by major cell populations in the CNS of Gfap::Scrmbl and Gfap::Hbegf mice. n = 4 per group. Data shown as mean ± SD. Two-way ANOVA with Sidak’s multiple comparisons test in (d, f). Source data
Extended Data Fig. 5
Extended Data Fig. 5. Inflammatory and hypoxic regulators of HB-EGF in astrocytes.
a, schematic of binding domains, flow cytometric quantification, and representative histograms of membranous HB-EGF (antibody 1) and cytoplasmatic HB-EGF (antibody 2) in astrocytes in response to stimulation with TNF-α and IL-1β over 48 hours. n = 4 per timepoint. b, RT-qPCR analysis of Hbegf expression and quantification of soluble HB-EGF (sHB-EGF) in the supernatant of primary mouse astrocyte in response to stimulation with TNF-α and IL-1β over 48 hours. n = 4 per timepoint. d, schematic of stimulation and supernatant sampling, as well as quantification of sHB-EGF (e) in primary mouse astrocytes stimulated with TNF-α and IL-1β for 8 hours, followed by extensive washing before supernatant sampling. n = 4/6 per timepoint. f, RT-qPCR analysis of Hif1a expression by ACSA2+ astrocytes following i.c.v. injection of TNF-α and IL-1β or vehicle. n = 3 per group. g, RT-qPCR analysis of Ldha and Ero1l expression as positive controls for HIF1α related signaling in primary mouse astrocytes stimulated with CoCl2 over 24 hours. n = 4 per timepoint. h, RT-qPCR analysis of HBEGF expression by human astrocytes under pseudohypoxic conditions (CoCl2). n = 2 per group. i, and Enzyme-linked Immunosorbent Assay (ELISA) of soluble HB-EGF (sHB-EGF) in the supernatant of primary mouse astrocytes under pseudohypoxic conditions (CoCl2). n = 4/16 per group. j, schematic of transcriptional competition between HIF1α and AhR. k, representative scatterplots of HB-EGF expression in primary mouse astrocytes (ACSA2 + GFP+) transduced with a control (Gfap::Scrmbl), AhR (Gfap::Ahr), HIF1α (Gfap::Hif1), or HB-EGF (Gfap::Hbegf) targeting CRISPR/Cas9 vector, quantified by intracellular flow cytometry. n = 3 per group. l, representative histograms depicting HB-EGF staining in astrocytes obtained from Gfap::Scrmbl, Gfap::Ahr and Gfap::Hif1a mice during late-stage EAE. m, RT-qPCR analysis of Hbegf, Ahr, Hif1a, and Ldha in ACSA2+ astrocytes in Gfap::Scrmbl, Gfap::Hif1a, and Gfap::Ahr mice. n = 3 per group. Data shown as mean ± SD. One-way ANOVA with Dunett’s multiple comparisons test (tested against control) in (a, b, c, e, m), unpaired t-test in (f, i), Two-way ANOVA with Sidak’s multiple comparisons test in (g). Source data
Extended Data Fig. 6
Extended Data Fig. 6. NicheNet analysis of Hbegf target genes.
a, UMAP plots of CNS cells analyzed by single-cell RNA Seq by Wheeler et al.; color coded expression of the astrocyte markers Apq4, S100b, Gja1 and Hbegf. b, NicheNet 20 top-ranked ligands and their average expression by cell types in single-cell RNA Seq data of CNS cells by Wheeler et al.. c, active ligand-target genes identified by NicheNet in single-cell RNA Seq data of CNS cells by Wheeler et al..
Extended Data Fig. 7
Extended Data Fig. 7. Anti-inflammatory and tissue-protective effects of HB-EGF on CNS-resident and non-resident cell types.
a, Min. max. normalized expression of inflammatory genes in astrocytes (left) and microglia (right) ± stimulation with TNF-α, IL-1β or LPS ± HB-EGF, or after pre-stimulation with HB-EGF (pre). n = 2/4 per group. b, percent of parent of IFN-γ, IL-17, and FoxP3 by CD4+ T cells differentiated ± HB-EGF quantified by flow cytometry. n = 3 per group. c, counts of migrated CD11b+ myeloid cells (left), and expression of co-regulatory molecules CD80, CD86 and MHCII by monocytes (right). n = 3 per group. d, representative scatter plots of GM-CSF production by CD45intCD11b+ microglia and CD45hiCD11b+Ly6C+ monocytes in mice i.c.v. injected with vehicle or TNF-α, IL-1β ± HB-EGF. n = 3 per group. e, Olig2+ immunostaining in ON stimulated with vehicle or IFN-γ ± HB-EGF. n = 2-4 per group. f, live/dead staining of neuronal cells following TNF-α ± HB-EGF stimulation. n = 4 per group. g, DNA methylation in EAE astrocytes. Data obtained from Wheeler et al.. h, DNA hyper- (left) and hypomethylation (right) in EAE astrocytes (naïve and peak). i, quantification of DNA methylation at HIF1α and AhR-binding sites in the Hbegf locus in astrocytes during peak EAE (n = 4) and naïve (n = 3) stages. j, schematic of HRM-PCR amplification. k, EAE in mice intranasally treated with vehicle (n = 4) / 5-Aza (n = 5) starting at symptom onset. l, MFI of HB-EGF in EAE astrocytes following vehicle or 5-Aza treatment. n = 5 per group. m, AUC of methylation at HIF1α binding sites in the Hbegf promoter after vehicle / 5-Aza treatment. n = 4 per group. n, schematic of treatment with 5-Aza in naïve mice. o, MFI of HB-EGF expression (left) and relative Hbegf expression (right) in astrocytes from naïve mice intranasally treated with 5-Aza / vehicle for 14 days. n = 5 per group. Data shown as mean ± SD / as mean ± SEM in (k). Two-way ANOVA with Dunnett’s multiple comparisons test in (a) / with Sidak’s multiple comparisons test in (e), unpaired t-test in (b, c, l, m, o), One-way ANOVA with Dunnett’s multiple comparisons test in (f). Source data
Extended Data Fig. 8
Extended Data Fig. 8. Intranasal treatment with recombinant HB-EGF ameliorates CNS inflammation.
a, absolute counts of cytokines produced by microglia, monocytes, Ly6C myeloid cells, CD4+ T cells, and astrocytes in the spinal cord or brain of vehicle or rmHB-EGF treated mice (starting symptom onset). n = 4 per group. b, abundance (% of live) of major immune cell populations in draining axillary lymph nodes of mice intranasally treated with vehicle (n = 7) or recombinant HB-EGF (rmHB-EGF, n = 5) starting at symptom onset. c, abundance (% of live) of CNS-resident and CNS-infiltrating cell types in EAE mice intranasally treated with vehicle or recombinant mouse HB-EGF (rmHB-EGF) starting at symptom onset. DC, dendritic cells, Endo, endothelial cells; OPCs, oligodendrocyte progenitor cells; OLCs, oligodendrocyte lineage cells. n = 8 per group. d, relative expression (% of parent) of cytokines produced by microglia, monocytes, Ly6C myeloid cells, CD4+ T cells, and astrocytes in the CNS of vehicle or rmHB-EGF treated mice. n = 8 per group. e, gating strategy used for the analysis of splenic cell types by high dimensional flow cytometry. f, concentration of soluble HB-EGF (sHB-EGF) in sera of vehicle- or rmHB-EGF treated mice. n = 5 per group. g, abundance of cell populations (% of live) in spleens of mice treated with vehicle or rmHB-EGF. n = 8 per group. h, relative expression (% of parent) of cytokines produced by monocytes, Ly6C- myeloid cells, CD4+ and CD8+ T cells, in spleens of vehicle or rmHB-EGF treated mice. n = 8 per group. i, frequency of TH1 (IFNγ+) and TH17 (IL-17+) CD4+ T cells in the CNS and spleen of mice that were intranasally treated with vehicle or rmHB-EGF starting at peak of disease. n = 6 per group. Data shown as mean ± SD. Two-way ANOVA with Sidak’s multiple comparisons test in (a-d, g, h). Unpaired t-test in (f, i). Source data
Extended Data Fig. 9
Extended Data Fig. 9. Analysis of HB-EGF in human pathology.
a, immunostaining of a stereotactic biopsy from a patient with acute disseminated encephalomyelitis (ADEM; lower). DAPI staining (blue) of nuclei, CD3 staining (purple) of T cells, GFAP staining (red) of astrocytes, HB-EGF staining (green). Scale bar 100 μm. Patient characteristics are provided in Supplementary Table 4. b, ChromHMM features and genomic location of differentially methylated CpGs in the HBEGF locus in NeuN glial cells from MS patients or non-neurological controls (NNCs). n = 8 MS, n = 14 NNCs. c, difference plot and area under the curve (AUC; d) of 0%, 25%, 50%, 75%, and 100% methylated genomic DNA used as a standard control. Source data

References

    1. Lassmann H. Multiple sclerosis pathology. Cold Spring Harb. Perspect. Med. 2018;8:a028936. doi: 10.1101/cshperspect.a028936. - DOI - PMC - PubMed
    1. Thompson AJ, et al. Diagnosis of multiple sclerosis: 2017 revisions of the McDonald criteria. Lancet Neurol. 2018;17:162–173. doi: 10.1016/S1474-4422(17)30470-2. - DOI - PubMed
    1. Polman CH, et al. Diagnostic criteria for multiple sclerosis: 2010 revisions to the McDonald criteria. Ann. Neurol. 2011;69:292–302. doi: 10.1002/ana.22366. - DOI - PMC - PubMed
    1. Miller D, Barkhof F, Montalban X, Thompson A, Filippi M. Clinically isolated syndromes suggestive of multiple sclerosis, part I: natural history, pathogenesis, diagnosis, and prognosis. Lancet Neurol. 2005;4:281–288. doi: 10.1016/S1474-4422(05)70071-5. - DOI - PubMed
    1. Lebrun-Frénay C, et al. Risk factors and time to clinical symptoms of multiple sclerosis among patients with radiologically isolated syndrome. JAMA Netw. Open. 2021;4:e2128271. doi: 10.1001/jamanetworkopen.2021.28271. - DOI - PMC - PubMed

Substances