. 2024 Apr;25(4):1773-1791.
doi: 10.1038/s44319-024-00093-x. Epub 2024 Feb 26.

Gli1 labels progenitors during chondrogenesis in postnatal mice

Affiliations

Gli1 labels progenitors during chondrogenesis in postnatal mice

Boer Li et al. EMBO Rep. 2024 Apr.

Abstract

Skeletal growth promoted by endochondral ossification is tightly coordinated by self-renewal and differentiation of chondrogenic progenitors. Emerging evidence has shown that multiple skeletal stem cells (SSCs) participate in cartilage formation. However, as yet, no study has reported the existence of common long-lasting chondrogenic progenitors in various types of cartilage. Here, we identify Gli1+ chondrogenic progenitors (Gli1+ CPs), which are distinct from PTHrP+ or FoxA2+ SSCs, are responsible for the lifelong generation of chondrocytes in the growth plate, vertebrae, ribs, and other cartilage. The absence of Gli1+ CPs leads to cartilage defects and dwarfishness phenotype in mice. Furthermore, we show that the BMP signal plays an important role in self-renewal and maintenance of Gli1+ CPs. Deletion of Bmpr1α triggers Gli1+ CPs quiescence exit and causes the exhaustion of Gli1+ CPs, consequently disrupting columnar cartilage. Collectively, our data demonstrate that Gli1+ CPs are common long-term chondrogenic progenitors in multiple types of cartilage and are essential to maintain cartilage homeostasis.

Keywords: BMP; Chondrogenic Progenitors; Gli1+ Cells; Hedgehog; Stem Cell Maintenance.


Conflict of interest statement

The authors declare no competing interests.

Figures

Figure 1
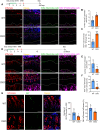
Figure 1. Gli1+ chondrogenic progenitors are the source of columnar chondrocytes.
(A, B) Gli1-CreERT2; tdTomato mice were administrated tamoxifen (TAM) at 1 month old and harvested at indicated days. (A) Representative confocal images from frozen sections of growth plate from the tibia. The white dashed lines indicate the region of growth plate. GP, growth plate. Red: tdTomato; Green: Aggrecan; Blue: DAPI. Scale bars=100 µm. (B) The percentage of tdTomato+ cells to all cells from growth plate region was quantified. n = 4 mice per group. (C, D): Gli1-CreERT2; tdTomato mice were administrated tamoxifen (TAM) at 12-months old and harvested after 1 day or 1 month. (C) Representative confocal images from frozen sections of growth plate from the tibia. The white dashed lines indicate the region of growth plate. GP, growth plate. Red: tdTomato; Green: Aggrecan; blue: DAPI. Scale bars=100 µm. (D) The percentage of tdTomato+ cells to all cells from growth plate region was quantified. n = 3 mice per group. Data information: In (B, D), data are presented as mean ± s.d. Significance was determined using one-way ANOVA followed by Tukey’s test (B) or unpaired t-tests (D). **P < 0.01, ***P < 0.001. Source data are available online for this figure.
Figure 2
Figure 2. Gli1+ chondrogenic progenitors behave as skeletal stem cells.
(AC) Gli1-CreERT2; tdTomato mice were administrated tamoxifen (TAM) at 1 month old and harvested at Day1 for primary chondrogenic cells isolation. (A) Quantification of the colony numbers at Passage 0 in CFU assay. n = 3 mice per group, data are presented as mean ± s.d. (B) Representative images of colony-forming unit assay and subsequent passaging of individual tdTomato+ colonies. (C) The subsequent passage number of tdTomato cells (Gli1) and tdTomato+ cells (Gli1+). n = 4 mice per group, data are presented as mean ± s.d. (D) Representative confocal images of immunofluorescence staining of Ki67 from 1-month-old Gli1-CreERT2; tdTomato mice. The percentage of the tdTomato+ Ki67+/ tdTomato+ cells was quantified. GP, growth plate; CC, Costal cartilage. Vb, Vertebrae. n = 3 mice per group, data are presented as mean ± s.d. (E) MA plot (Log2 fold change) of differentially expressed genes (DEGs) between Gli1+ cells vs. Gli1 cells with representative upregulated genes in each cell population. (F) Representative confocal images to monitor the expression of tdTomato, Pthrp and FOXA2 in growth plate of proximal tibia from 1-month-old mice. The pie chart showed the percentage of indicated population in tdTomato+ cells. n = 3 mice per group, data are presented as mean ± s.d. Scale bars = 100 µm. Significance was determined using unpaired t-tests (A, C, F). *P < 0.05, **P < 0.01. Source data are available online for this figure.
Figure 3
Figure 3. Gli1+ chondrogenic progenitors deletion leads to severe cartilage formation and growth retardation.
Gli1-CreERT2; tdTomato;Rosa-DTA (DTA) mice were administrated tamoxifen (TAM) at 1-month-old and harvested at 2-month-old. (A) Representative images of gross morphology of Ctrl (Gli1-CreERT2; tdTomato+/−) and DTA (Gli1-CreERT2; tdTomato+/−; DTA) mice. (B) The X-ray images of gross morphology from Ctrl and DTA mice. (C) µCT images of growth plate region in the proximal tibia. Top, 3D reconstruction image; Bottom, longitudinal sections of the proximal tibia. (D) Representative safranin O/fast green staining of longitudinal tibial sections. Boxed regions are shown at higher magnification to the right. (E) Representative safranin O/fast green staining of articular cartilage in proximal tibia, costal cartilage and lumbar vertebrae. (F) Immunofluorescence staining of aggrecan in growth plate, costal cartilage and lumbar vertebrae. (G) The number of tdTomato+ cells (upper panel) and the number of tdTomato+ columns (contained more than 5 tdTomato+ cells in each column, lower panel) in growth plate were quantified. n = 3 mice per group, data are presented as mean ± s.d. (H) Proliferating cells (EdU+) were examined in growth plate of tibia from Ctrl and DTA mice. The percentage of EdU+tdTomato+/tdTomato+ was quantified and shown in bar graph. n = 3 mice per group. Data Information: In (G, H), data are presented as mean ± s.d. Significance was determined using unpaired t-tests (G, H). **P < 0.01, ***P < 0.001. In (DF, H), scale bars=100 µm. Source data are available online for this figure.
Figure 4
Figure 4. Hh signal is required for expansion and chondrogenesis of Gli1+ chondrogenic progenitors.
Gli1-CreERT2; tdTomato mice were administrated tamoxifen (TAM) at 1 month old and injected with vehicle or GDC-0449 (GDC) before harvest. (A) Representative images of gross morphology of Gli1-CreERT2;tdTomato mice injected with vehicle or GDC-0449. (B) µCT images of growth plate region in proximal tibia. Top, 3D reconstruction image; bottom, longitudinal sections of the proximal tibia. (C) Representative safranin O/fast green staining of growth plate in tibia, costal cartilage and lumbar vertebrae. (D) Representative images of immunofluorescence staining of aggrecan on frozen sections of proximal tibia, costal cartilage and lumbar vertebrae. Red: tdTomato; Green: aggrecan; Blue: DAPI. The dashed line indicated the boundary of cartilage in tissues. (E) Quantification of the tdTomato+ cells number in the growth plate region, costal cartilage and vertebra, respectively. n = 4 mice per group. Data are presented as mean ± s.d. (F) Quantification of column number containing different number of tdTomato+ cells in growth plate. n = 4 mice per group. Data are presented as mean ± s.d. (G) Quantification of column number in the growth plate region, costal cartilage and vertebra, respectively. n = 4 mice per group. Data are presented as mean ± s.d. (H) Representative images of EdU staining of on longitudinal sections of the proximal tibia. The dashed line indicated the boundary of growth plate. (I) Quantification of the percentage of EdU+tdTomato+/tdTomato+ was shown. n = 4 mice per group. Data Information: In (EG, I), data are presented as mean ± s.d. Significance was determined using unpaired t-tests (E, G, I) or two-way ANOVA followed by Sidak’s test (F). *P < 0.05, **P < 0.01, ***P < 0.001. In (C, D, H), scale bars = 100 µm. Source data are available online for this figure.
Figure 5
Figure 5. BMP signal is essential to maintain Gli1+ chondrogenic progenitors and cartilage formation.
(A) Comparative RNA-seq analysis of Gli1+ cells and Gli1 cells. Dot plot of KEGG enrichment analysis of upregulated genes in Gli1+ cells vs. Gli1 cells. KEGG enrichment analysis was implemented by the ClusterProfiler package (R package) based on the hypergeometric distribution. (BF) WT and BMPR1α CKO mice were administrated TAM at 1-month-old and harvested at Day30. (B) Representative images of gross morphology of WT and CKO mice. (C) Representative images of safranin O/fast green staining of growth plate from longitudinal tibial sections, costal cartilage and lumbar vertebrae. (D) H&E staining of sagittal sections from proximal tibia. Boxed regions are shown at higher magnification to the right. The dashed line circle indicated the cluster we defined. (E) The quantification of the percentage and the number of single cells, clusters and columns formation from H&E staining at Day30 after TAM administration. n = 3 mice per group, data are presented as mean ± s.d. Significance was determined using two-way ANOVA followed by Sidak’s test. *P < 0.05, **P < 0.01. (F) Immunofluorescence staining of p-SMAD1/5/9 on frozen sections of growth plate, costal cartilage and lumbar vertebrae. n = 3 mice per group. Data Information: In (C, D, F), scale bars=100 µm. Source data are available online for this figure.
Figure 6
Figure 6. BMPR1α ablation accelerates Gli1+ chondrogenic progenitors’ proliferation and exhaustion.
(A) Top panel is the schematic graph of the chemical administration protocol. Representative images of immunofluorescence staining of Ki67 and EdU on frozen sections of proximal tibia. Green: Edu; Red: tdTomato; Magenta: Ki67; Blue: DAPI. The dashed line indicated the region of growth plate. (B) The quantification of EdU+tdTomato+ cells from WT and CKO mice. n = 4 mice per group. (C) The percentage of Ki67+EdU+tdTomato+ in EdU+tdTomato+ population. n = 4 mice per group. (D) Top panel is the schematic graph of the chemical administration protocol. Representative images of immunofluorescence staining of Ki67 and EdU on frozen sections of proximal tibia. Green: Edu; Red: tdTomato; Magenta: Ki67; Blue: DAPI. The dashed line indicated the region of growth plate. (E) The quantification of EdU+tdTomato+ cells from WT and CKO mice. n = 4 mice per group. (F) The percentage of Ki67+EdU+tdTomato+ in EdU+tdTomato+ population. n = 4 mice per group. (G) The detection of tdTomato and Gli1 expression in growth plate from WT and CKO mice. The quantification of the number and percentage was shown to the right. n = 4 mice per group. Data Information: In (B, C, EG), data are presented as mean ± s.d. Significance was determined using unpaired t-test (B, C, EG). *P < 0.05, **P < 0.01. Scale bars = 100 µm (A, D), 25 µm (G). Source data are available online for this figure.
Figure 7
Figure 7. The relationship between BMP and stemness in Gli1+ chondrogenic progenitors.
(A) CFU assay of sorted tdTomato+ chondrogenic cells from the growth plate of WT and CKO mice. Quantification of the number of colonies (per 0.5 × 104 cells) was presented. n = 6 independent experiments. (B) Representative image of colony formation with tdTomato+ chondrogenic cells. The quantification of average cell number of each colony was shown to the right. Cells are the sorted tdTomato+ chondrogenic cells from the growth plate of WT and CKO mice. n = 6 independent experiments. (C) The experimental strategy for the isolation and assessment of self-renewability by colony formation and subculture. Cells were digested and sorted from the growth plate of WT and CKO mice. Gli1+ cells were seeded at 1 × 104 cells per well at P0. (D) The quantification of the number of colonies during subsequent passaging of individual tdTomato+ colonies. n = 4 independent experiments. (E) The percentage of remaining colonies after each passaging to the number of colonies at P0 was presented. n = 4 independent experiments. Data Information: In (A, B, D, E), data are presented as mean ± s.d. Significance was determined using unpaired t-tests (A,B) or two-way ANOVA followed by Sidak’s test (D, E). *P < 0.05, **P < 0.01. Scale bars = 100 µm (B). Source data are available online for this figure.
Figure EV1
Figure EV1. (related to Fig. 1).
(A) Gli1-CreERT2; tdTomato mice were administrated tamoxifen (TAM) at 1 month old and harvested after 1 day or 1 month. Representative confocal images from frozen sections of articular cartilage from tibia, costal cartilage and vertebrae. AC, articular cartilage; GP, growth plate; CC, costal cartilage; VB: vertebrae. Red: tdTomato; Green: aggrecan; Blue: DAPI. Scale bars = 100 µm. (B) Gli1-CreERT2; tdTomato mice were administrated tamoxifen (TAM) at 12 months old and harvested after 1 day or 1 month. Representative confocal images from frozen sections of articular cartilage from tibia, costal cartilage and vertebrae. AC, articular cartilage; GP, growth plate; CC, costal cartilage; VB: vertebrae. Red: tdTomato; Green: aggrecan; Blue: DAPI. Scale bars = 100 µm. (C) Gli1-CreERT2; tdTomato mice were administrated tamoxifen (TAM) at 1-month old and harvested after 12 months. Representative confocal images from frozen sections of the tibia. Boxed areas are shown at higher magnification in corresponding panels to the right. Green box, articular cartilage; Orange box, growth plate. GP, growth plate; Tb: trabecular bone. Red: tdTomato; Green: aggrecan; Blue: DAPI. bars = 100 µm. (D) The percentage of tdTomato+ Acan+ to Acan+ cells was quantified. Gli1-CreERT2; tdTomato mice were administrated tamoxifen (TAM) at 1 month old and harvested after 24 h, 3 months and 12 months, respectively. n = 3 mice per group, data are presented as mean ± s.d. Significance was determined using one-way ANOVA followed by Tukey’s test. *P < 0.05, ***P < 0.001. (E) Representative confocal images of EdU staining of temporomandibular joint. Scale bars = 100 µm.
Figure EV2
Figure EV2. (related to Fig. 2).
(A) Flow cytometry analysis of skeletal stem and progenitor cell-surface-marker in primary chondrogenic cells from growth plate. tdTomato, tdTomato fraction of CD45CD31Ter119 cells; tdTomato+, tdTomato+ fraction of CD45CD31Ter119 cells. Blue box, CD45CD31Ter119CD51+ tdTomato fraction (Gli1). Red box, CD45CD31Ter119CD51+ tdTomato+ fraction (Gli1+). The left bar graph showed the percentage of CD105CD200+ and CD105+ cells within Gli1 and Gli1+ fractions. The right bar graph showed the fold change of Gli1+ fractions compared with Gli1 fraction. n = 3 mice per group, data are presented as mean ± s.d. Significance was determined using unpaired t-tests. *P < 0.05, **P < 0.01. (B) Representative tri-lineage differentiation images of Gli1-CreERT2–tdTomato+ cells. Alizarin Red stain was used for osteogenesis; oil red stain was used for adipogenesis; toluidine blue stain was used for chondrogenesis. (C) Representative confocal images to monitor the expression of tdTomato, Pthrp in 1-month-old mice using RNAscope assay. (D) Representative confocal images of immunofluorescence staining of FOXA2 in costal cartilage and vertebrae from 1-month-old Gli1-CreERT2; tdTomato mice. (E) Representative confocal images to monitor the expression of Gli1, Pthrp and FOXA2 in the growth plate of proximal tibia from 12-month-old mice using RNAscope assay. Data Information: In (B), scale bars = 1 mm (Osteogenesis),100 µm (Adipogenesis, Chondrogenesis). In (CE), scale bars = 25 µm.
Figure EV3
Figure EV3. (related to Fig. 5).
WT and BMPR1α CKO mice were administrated tamoxifen (TAM) at 1-month-old and harvested after 3 days or 10 days of chase respectively. (A) Representative images of TUNEL staining for apoptosis in growth plate region on indicated days. Green: TUNEL; Red: tdTomato; Blue: DAPI. (B) Immunofluorescence staining of COLX on frozen sections of growth plate on indicated days. Green: COLX. Scale bars = 100 µm.
Figure EV4
Figure EV4. (related to Fig. 6).
(A) The schematic graph of the chemical administration protocol. (B) Representative images of immunofluorescence staining of Ki67 on frozen sections of proximal tibia. Red: tdTomato; Green: Ki67; Blue: DAPI. The dashed line indicated the region of growth plate. Scale bars = 100 µm  (C) The percentage of Ki67+ tdTomato+ cells in tdTomato+ population in growth plate. n = 3 mice per group. Data are presented as mean ± s.d. Significance was determined using unpaired t-test (C). *P < 0.05.

Similar articles

Cited by

References

    1. Ahn S, Joyner AL. Dynamic changes in the response of cells to positive hedgehog signaling during mouse limb patterning. Cell. 2004;118:505–516. doi: 10.1016/j.cell.2004.07.023. - DOI - PubMed
    1. Andl T, Ahn K, Kairo A, Chu EY, Wine-Lee L, Reddy ST, Croft NJ, Cebra-Thomas JA, Metzger D, Chambon P, et al. Epithelial Bmpr1a regulates differentiation and proliferation in postnatal hair follicles and is essential for tooth development. Development. 2004;131:2257–2268. doi: 10.1242/dev.01125. - DOI - PubMed
    1. Bandyopadhyay A, Tsuji K, Cox K, Harfe BD, Rosen V, Tabin CJ. Genetic analysis of the roles of BMP2, BMP4, and BMP7 in limb patterning and skeletogenesis. PLoS Genet. 2006;2:e216. doi: 10.1371/journal.pgen.0020216. - DOI - PMC - PubMed
    1. Candela ME, Cantley L, Yasuaha R, Iwamoto M, Pacifici M, Enomoto-Iwamoto M. Distribution of slow-cycling cells in epiphyseal cartilage and requirement of beta-catenin signaling for their maintenance in growth plate. J Orthop Res. 2014;32:661–668. doi: 10.1002/jor.22583. - DOI - PMC - PubMed
    1. Chagin AS, Vuppalapati KK, Kobayashi T, Guo J, Hirai T, Chen M, Offermanns S, Weinstein LS, Kronenberg HM. G-protein stimulatory subunit alpha and Gq/11alpha G-proteins are both required to maintain quiescent stem-like chondrocytes. Nat Commun. 2014;5:3673. doi: 10.1038/ncomms4673. - DOI - PMC - PubMed

Substances