. 2024 Feb;6(2):359-377.
doi: 10.1038/s42255-024-00984-2. Epub 2024 Feb 19.

Identification of a leucine-mediated threshold effect governing macrophage mTOR signalling and cardiovascular risk

Affiliations

Identification of a leucine-mediated threshold effect governing macrophage mTOR signalling and cardiovascular risk

Xiangyu Zhang et al. Nat Metab. 2024 Feb.

Abstract

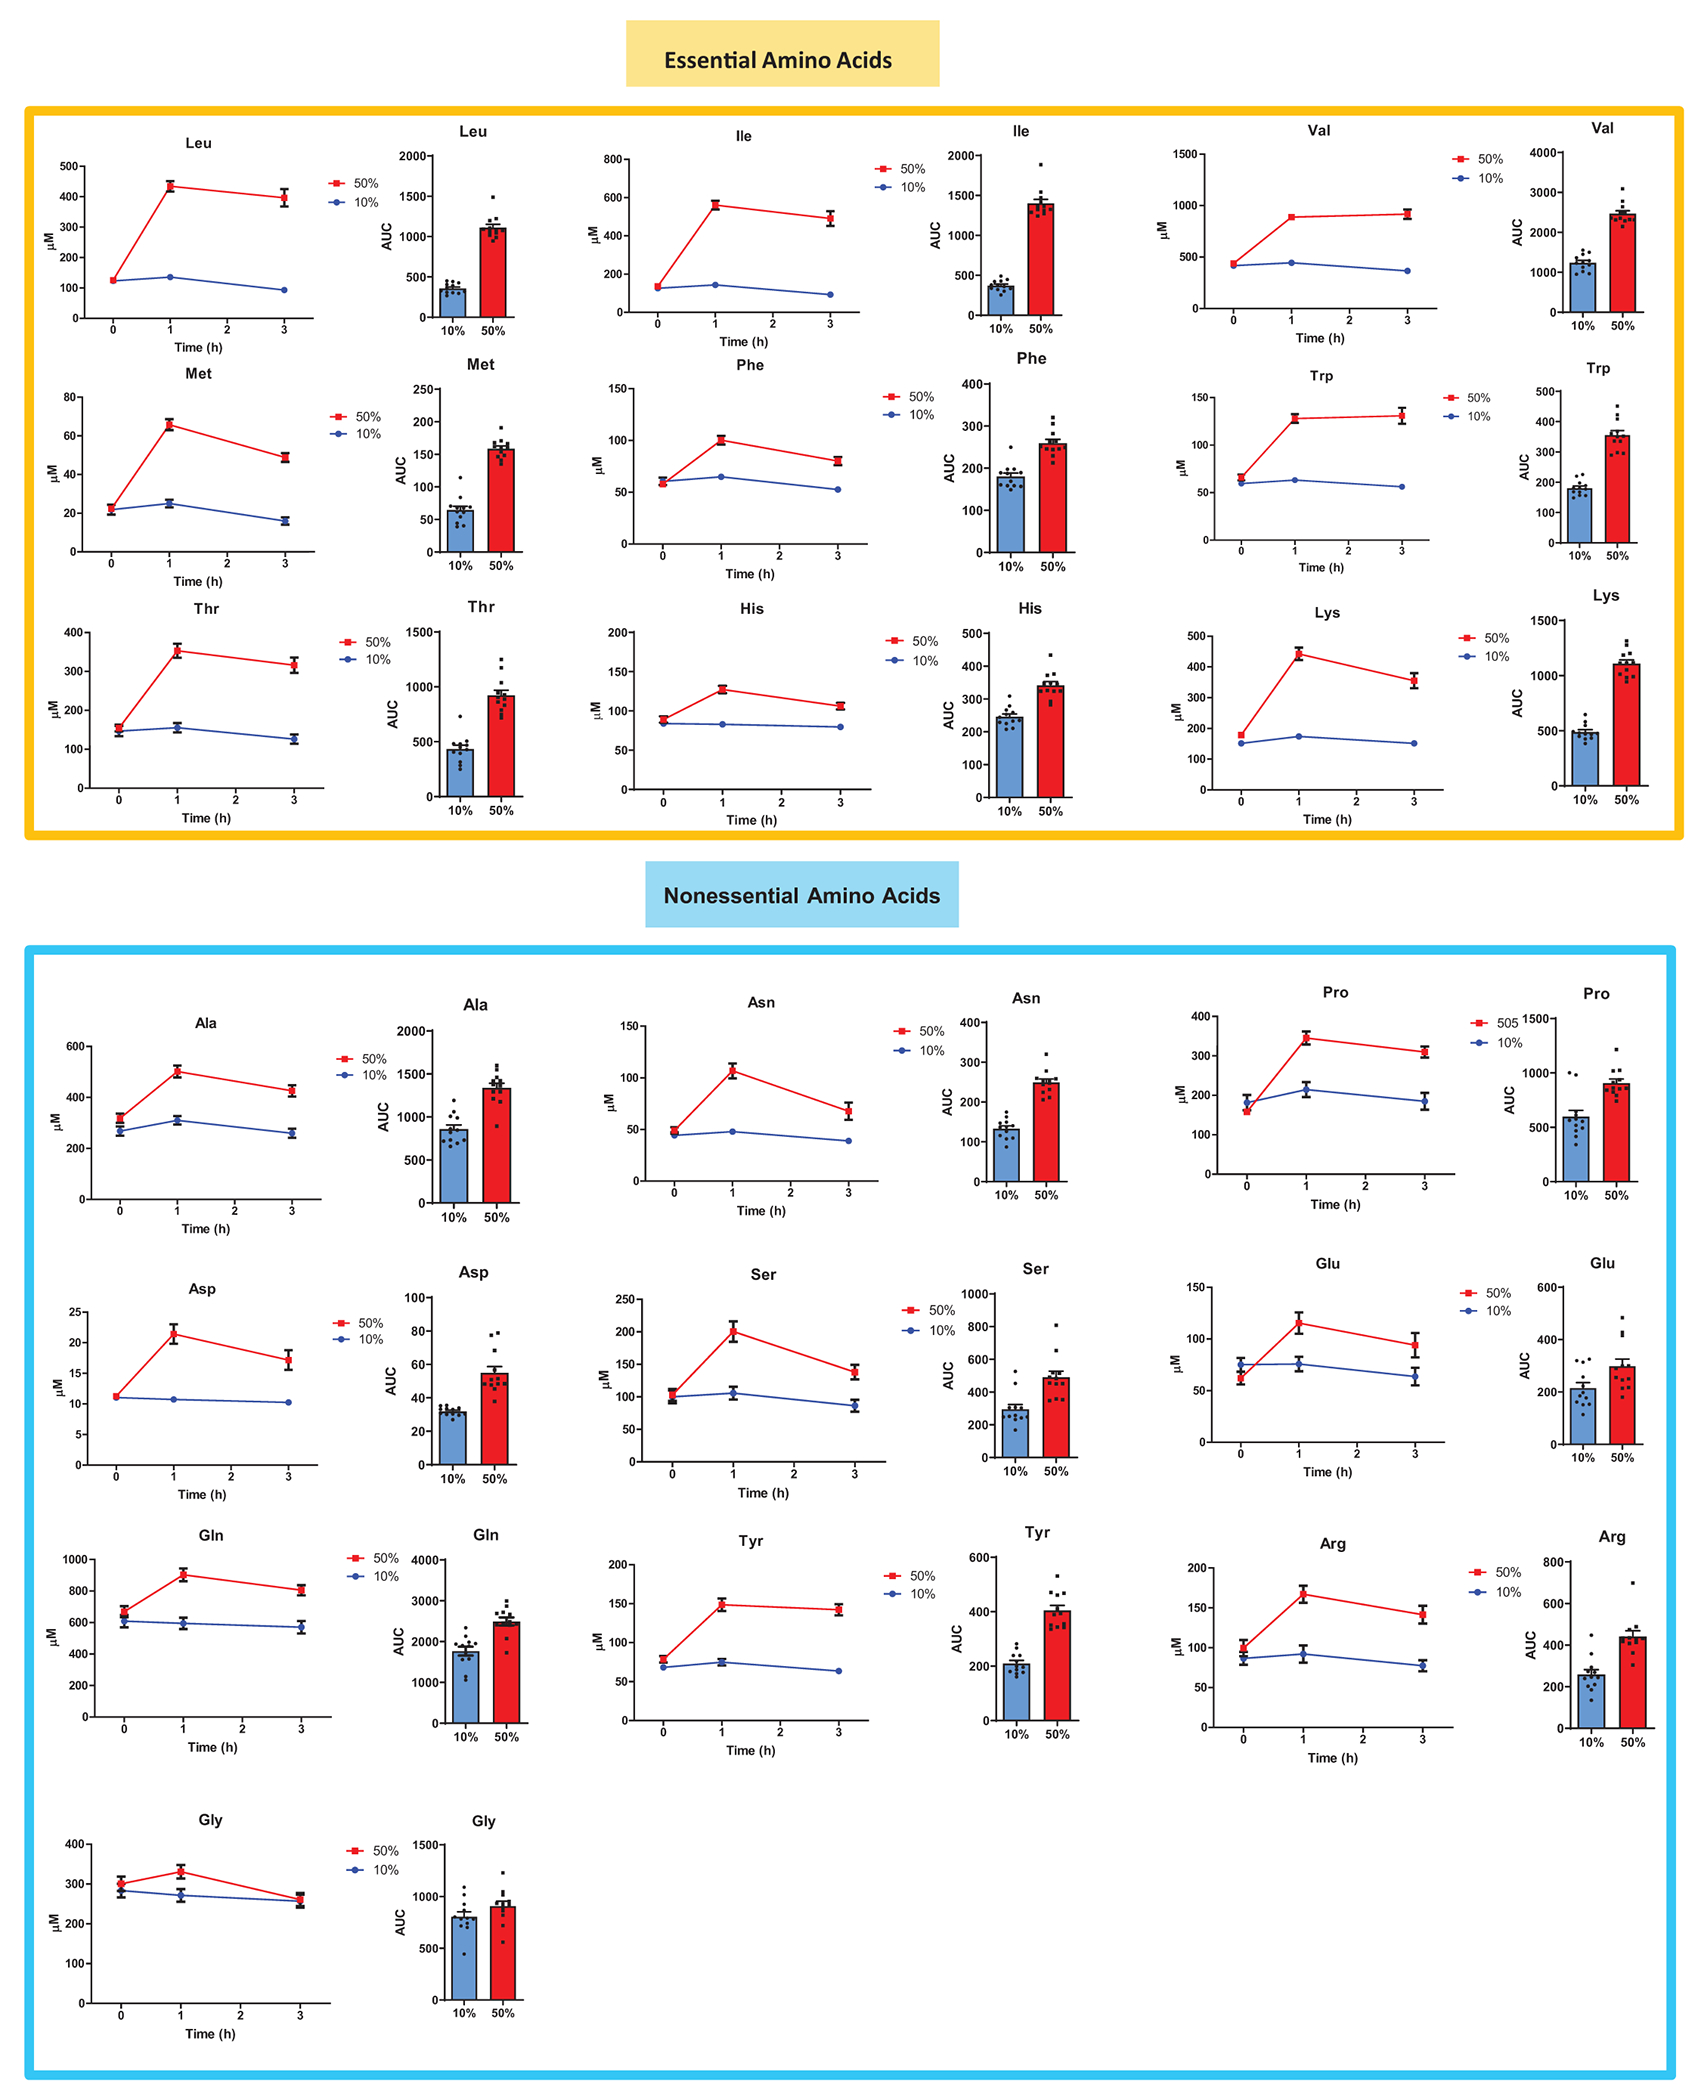
High protein intake is common in western societies and is often promoted as part of a healthy lifestyle; however, amino-acid-mediated mammalian target of rapamycin (mTOR) signalling in macrophages has been implicated in the pathogenesis of ischaemic cardiovascular disease. In a series of clinical studies on male and female participants ( NCT03946774 and NCT03994367 ) that involved graded amounts of protein ingestion together with detailed plasma amino acid analysis and human monocyte/macrophage experiments, we identify leucine as the key activator of mTOR signalling in macrophages. We describe a threshold effect of high protein intake and circulating leucine on monocytes/macrophages wherein only protein in excess of ∼25 g per meal induces mTOR activation and functional effects. By designing specific diets modified in protein and leucine content representative of the intake in the general population, we confirm this threshold effect in mouse models and find ingestion of protein in excess of ∼22% of dietary energy requirements drives atherosclerosis in male mice. These data demonstrate a mechanistic basis for the adverse impact of excessive dietary protein on cardiovascular risk.


Conflict of interest statement

DECLARATION OF INTEREST STATEMENT

All authors declare they have no conflict of interest.

Figures

Extended Data Figure 1.
(A) Study #1 evaluated the effect of consuming extremes of protein intake as liquid meals (10% kcal protein vs 50% kcal protein) on monocyte mTORC1 activation and downstream functional events. Study #2 focused on a “real-world” setting and evaluated the effects of a standard mixed meal and a high-protein mixed meal (15% kcal vs 22% kcal as protein) on the same outcomes. Blood samples from participants were obtained at baseline and at defined time intervals after meal consumption, plasma was isolated for evaluating amino acid mass concentration, and CD14+/CD16− monocytes were isolated for mTORC1 signaling evaluation using Western blotting (WB), immunofluorescence microscopy (IF), and fluorescence-activated cell sorting (FACS). (B) Representative FACS pictures showing high efficiency of circulating monocytes isolation from participants’ blood. (C) Plasma triglyceride (TG) concentration before and after participants (n=12) consumed a very high protein (50% kcal) or a low protein (10% kcal) liquid meal (time as indicated). (D) Representative FACS pictures for Fig 2D. (E) Quantification of mTORC1-LAMP2 colocalization in isolated circulating monocytes participants (n=5) consumed a very high protein (50% kcal) or a low protein (10% kcal) liquid meals (time as indicated). P <10e-8 and determined by Two-way ANOVA with Sidak’s multiple comparisons. Representative pictures on the right. (F) Plasma TG concentration before and after participants (n=9) consumed a standard mixed meal (15% kcal protein) or a high protein (22% kcal protein) mixed meal (time as indicated). For all graphs, data are presented as mean ± SEM. ***P < 0.001.
Extended Data Figure 2.
Plasma concentrations of 20 amino acids before and after participants (n=12) consumed a very high protein (50% kcal) or a low protein (10% kcal) liquid meal (time as indicated). For all graphs, data are presented as mean ± SEM.
Extended Data Figure 3.
Plasma concentrations of 20 amino acids before and after participants (n=9) consumed a standard mixed meal (15% kcal protein) or a high protein (22% kcal protein) mixed meal (time as indicated). For all graphs, data are presented as mean ± SEM.
Extended Data Figure 4.
(A) Representative images of cultured human monocytes-derived macrophages (HMDMs) from isolated human circulating monocytes before and after 12 days of differentiation. The picture represents for three independent experiments. (B-C) FACS (B) and immunofluorescence (C) analysis of differentiated HMDMs by macrophage markers CD11b, CD18, and CD68. The picture represents for three independent experiments. (D) Western blot analysis of mTOR activation in HMDM (using phospho-S6 and -S6K) after treatment with leucine (2mM) or full amino acids. The picture represents for three independent experiments. (E-F) Immunofluorescence microscopy analysis and quantification of mTORC1 activation (using phospho-S6) (E) and autophagy inhibition (using LC3 puncta formation) (F) in HMDMs treated with 2 mM leucine. The IF data (E and F) were obtained from three independent experiments with analysis of n ≥ 15 cells per experiment (n=45 in Group -aa and n=40 in Group Leu for E; n=58 in Group –aa and n=58 in Group Leu for F). P<10e-8 for E and F. (G) Representative images of LC3 in HMDMs for Figure 5D. (H) Immunoblot analysis of the phosphorylation of AMPK and ULK1 in HMDMs by the selected amino acids (applied at 2mM). n=4 independent experiments per group. P=0.00132 and determined by One-way ANOVA with Dunnett`s multiple comparisons. (I) Representative images of LC3 in HMDMs for Figure 5G. For all graphs, data are presented as mean ± SEM, **P < 0.01 and ***P < 0.001.
Extended Data Figure 5.
(A) Western blot analysis of the dose-dependent effect of leucine on mTORC1 activation (using phospho-S6K) in human monocyte-derived macrophages (HMDMs). The picture represents for three independent experiments. (B) Representative FACS plots for Fig 6E.
Extended Data Figure 6.
(A) Plasma concentrations of 20 amino acids before and after male mice were gavaged with a solution that contained 1.6 g/kg protein or vehicle (times as indicated). n=3 mice for each group. (B) FACS analysis of mTORC1 activation in blood monocytes (using phosphorylated S6) from female mice gavaged with the same protein solution compared with vehicle (times as indicated). n=4 mice for each group. P=0.00829 and determined by Two-way ANOVA with Sidak’s multiple comparisons. For all graphs, data are presented as mean ± SEM. **P < 0.01.
Extended Data Figure 7.
(A) Body composition (fat and lean weights) of ApoE−/− mice fed Western diets with low protein (LP WD), moderate protein (MP WD), or high protein (HP WD) contents for 8 weeks. n=5 mice for each group. P=0.00057. (B-C) Serum cholesterol (B) and triglyceride (C) concentrations in ApoE−/− mice before and after placement on low, moderate, or high protein Western diets for 8 weeks. n=5 mice for each group. (D-E) Serum cholesterol (D) and triglyceride (E) concentrations after ApoE−/− mice were fed six different diets with varying protein and leucine contents, including: 1) a moderate-protein Western Diet (MP WD, n=10), 2) a high-protein Western Diet (HP WD, n=7), 3) a MP WD to which an amount of leucine, but no other amino acids, was added to match the leucine content of the HP WD (MP WD+Leu, n=10), 4) a MP WD to which amino acids were added to match the total amino acid content of the HP WD (MP WD+AA, n=10), 5) a MP WD to which amino acids, except for leucine, were added to match the content of all amino acids, except for leucine, of the HP WD (MP WD+AA (Normal Leu), n=15), and 6) an isonitrogenous MP-WD+AA-Leu diet (MP WD+AA (Normal Leu (IsoN), n=15) which consisted of the MP-WD+AA-Leu diet with additional amino acids to match the total amino acid nitrogen content of the HPWD. (F-H) Plaque composition quantified by immunofluorescence (IF) microscopy of aortic root sections for (F) macrophages (MOMA-2), (G) apoptosis (TUNEL+), and (H) necrotic core (MP WD, n=10; HP WD, n=7; MP WD+Leu, n=10; MP WD+AA, n=10; MP-WD+AA(Normal Leu), n=15; isoMP-WD+AA, n=15 biologically independent animals). P=0.0159 for F, and P= 0.000329, 0.02219, and 0.00417 for G. For all graphs, data are presented as mean ± SEM, and determined by One-way ANOVA with Dunnett’s multiple comparisons. *P ≤ 0.05, **P < 0.01 and ***P < 0.001.
Extended Data Figure 8.
(A,B) CONSORT diagram of participant enrollment in Trial NCT03946774 (A) and Trial NCT03994367 (B).
Extended Data Figure 9.
(A,B) Gating strategy used to assess human (A) and mouse (B) circulating monocytes. (A) Dead cells and cell aggregates were removed in (a) and (b) to enrich single live cells, (c) human leukocytes were selected using CD45, and (d) human circulating monocytes were enriched by CD11b and F4/80 gating for further analysis. (B) Dead cells and cell aggregates were removed in (a) and (b) to enrich single live cells, (c) mouse leukocytes were selected using CD45, and (d) mouse circulating monocytes were enriched by CD11b and Ly6c gating for further analysis.
Figure 1.
Figure 1.. Very high-protein intake induces mTORC1 activation and inhibition of autophagy in isolated human monocytes.
(A) Protein intake distribution in the U.S. population. The Recommended Daily Intake (RDI) for protein is 0.8 g/kg/d. About 15% of the population consumes less and 85% of the population consumes more than the RDI. Average protein intake is about 15% of total energy and nearly 25% of the population consumes at least twice the RDI. (B) Schematic of the cross-over feeding study design. Fourteen participants (8 men, 6 women) consumed both very high protein and low protein liquid meals. The low protein meal provided 500 kcal of energy, 10% kcal as protein, 17% kcal as fat, and 73% kcal as carbohydrate. The very high protein meal provided 500 kcal of energy, 50% kcal as protein, 17% kcal as fat, and 33% kcal as carbohydrate. (C) Total plasma amino acid concentration before and at 1 h and 3 h after consuming the low and very high protein meals (n=12, P<10−6). (D-E) Before and after consuming the low and very high protein meals, mTORC1 activation in isolated circulating monocytes was evaluated by (D) Western blot (n=14) and (E) FACS analysis (n=14) of phosphorylated ribosomal protein S6 (F) IF microscopy analysis of LC3 autophagy marker in isolated circulating monocytes before and after consuming the low and very high protein meals (n=12, P=0.00435 for D, P=0.00619 for E, P=0.00001 and 0.0018 for F). n ≥ 100 cells were analyzed in Figures E. For all graphs, data are presented as mean ± SEM, and determined by Two-way ANOVA with Sidak’s multiple comparisons. **P < 0.01 and ***P < 0.001.
Figure 2.
Figure 2.. High-protein intake induces mTORC1 activation and inhibition of autophagy in isolated human monocytes.
(A) Schematic of the cross-over feeding study design. Nine participants (3 men, 6 women) consumed both high-protein and standard protein mixed meals. The standard meal provided 450 kcal of energy, 15% kcal as protein, 35% kcal as fat, and 50% kcal as carbohydrate. The high protein meal provided 450 kcal of energy, 22% kcal as protein, 30% kcal as fat, and 48% kcal as carbohydrate. (B) Total plasma amino acid concentration before and at 1 h and 2 h after consuming the standard and high protein meals (n=9, P=0.026795 and 0.04162). (C) Western blot analysis of mTORC1 activation (using phosphorylated S6) in isolated circulating monocytes before and after consuming the standard and high protein meals (n=7, P=0.00484). (D) Immunofluorescence microscopy analysis of the autophagy marker LC3 (using LC3 puncta formation) in isolated circulating monocytes before and after consuming the standard and high protein meals (n=7, P=0.0472). For all graphs, data are presented as mean ± SEM, and determined by Two-way ANOVA with Sidak’s multiple comparisons.. *P ≤ 0.05, **P < 0.01.
Figure 3.
Figure 3.. Plasma amino acid concentration profiles after low, standard, high and very high protein intake
(A) Plasma amino acid concentration area under the curve (AUC, over 3 hours – denoted as μM*3h) after participants consumed the low and very high protein meals (10% kcal and 50% kcal as protein, respectively) described in Figure 2. (B) Plasma amino acid concentration area under the curve (AUC, over 2 hours – denoted as μM*2h) after participants consumed the standard and high protein (15% kcal and 22% kcal as protein, respectively) mixed meals described in Figure 3. (C) Relative increase in plasma amino acid AUC after the very high protein (50% kcal) compared with the low protein (10% kcal) meal (n=12). (D) Relative increase in plasma amino acid concentration AUC after the high protein (22% kcal) compared with the standard protein (15% kcal) meal (n=9). (E) Relative increase in the peak plasma amino acid concentrations (1h) after consuming the very high protein (50% kcal) compared with the low protein (10% kcal) meal (n=12). (F) Relative increase in peak of plasma amino acid concentrations (1h) after consuming the high protein (22% kcal) compared with the standard protein (15% kcal) meal (n=9). For all graphs, data are presented as mean ± SEM, and determined by unpaired two-sided Student’s t-test for A and B.
Figure 4.
Figure 4.. Identification of leucine as the most consequential amino acid for mTORC1 activation in human monocyte derived macrophages (HMDM)
(A) List of 7 plasma amino acids that were increased after ingestion of both the very high protein and high protein meals compared with the low protein and standard protein meals, respectively. (B-C) Quantification of mTORC1 activation in HMDMs by the selected amino acids (2 mM) using (B) Western blot analysis (assessed by phosphorylated S6) and (C) immunofluorescence (IF) microscopy (assessed by co-localization of mTOR and Lamp2). n=3 independent experiments. P<0.0001 for B and C. (D) Quantification of the autophagy marker LC3 in HMDMs using IF microscopy upon stimulation by the selected amino acids (2 mM). n= 3 independent experiments per group. P<0.0001, 0.00023, 0.00031, <0.0001, 0.00114, 0.02942. (E-F) Quantification of mTORC1 activation in HMDMs by the selected amino acids (applied at concentrations that correspond to their peak plasma concentration after consuming the very high protein meal described in Figure 1 and Extended Data Figure 2) using (E) Western blot analysis (assessed by phosphorylated of S6) (n=4 independent experiments, P=0.00017) and (F) IF microscopy (assessed by co-localization of mTOR and Lamp2) (n=3 independent experiments, P=0.00016). (G) Quantification of the autophagy marker LC3 in HMDMs using IF microscopy upon stimulation by the selected amino acids (applied at concentrations that correspond to their peak plasma concentration after consuming the very high protein meal). n=3 independent experiments per group. P=0.0002, 0.0297. The IF data (C, D, F, and G) were obtained from three independent experiments with analysis of n ≥ 100 cells per experiment. For all graphs, data are presented as mean ± SEM, determined by One-way ANOVA with Dunnett‘s multiple comparisons. *P ≤ 0.05, **P < 0.01 and ***P < 0.001.
Figure 5.
Figure 5.. Leucine-mediated mTORC1 activation and downstream sequela in Human monocyte-derived macrophages (HMDMs)
(A) Western blot analysis of the dose-dependent effect of leucine on mTORC1 activation (assessed by phosphorylation of S6). (B) Immunofluorescence (IF) microscopy analysis of the dose-dependent effect of leucine on mTORC1 activation (assessed by co-localization of mTOR and Lamp2). P=0.0035, P<0.0001. (C,D) IF microscopy analysis of the dose-dependent effect of leucine on (C) autophagy inhibition (assessed by quantitation of LC3 puncta formation) and (D) mitophagy inhibition (assessed by co-localization of mitochondrial marker COXIV with LC3). P<0.0001 for C, and P=0.00464 and 0.0015 for D. (E,F) Dose-dependent effect of leucine on rotenone-induced (E) mitochondrial dysfunction by FACS analysis and (F) intracellular ROS (assessed by quantitation of DHE-staining via fluorescence microscopy). P=0.01465 and P< 0.0001 for E, and P=0.00103 and P< 0.0001 for F. (G) IF microscopy analysis of the dose-dependent effect of leucine in FCCP (carbonylcyanide p-trifluoromethoxyphenyl hydrazone)-induced apoptosis (quantified as percentage of caspase-3/7 positive cells). P=0.04123 and 0.01883. The IF data (B, C, D, F, and G) were obtained from three independent experiments with analysis of n ≥ 40 cells per experiment (B: n=47,48,55, 56 for each group; C: n=60, 61,62, 64 for each group; F: n=51,54,55,53 for each group). The FACS data (E) was obtained from three independent experiments. For all graphs, data are mean ± SEM, and determined by One-way ANOVA with Dunnett’s multiple comparisons.. *P ≤0.05, **P < 0.01 and ***P < 0.001.
Figure 6.
Figure 6.. Leucine is the most consequential amino acid for mTORC1 activation in murine monocytes/macrophages in vitro and in vivo.
(A) Summary of the experimental protocol for gavaging mice with liquid protein (1.6 g/kg) and assessment of serum amino acids and blood monocyte mTORC1 activation. (B) Relative increase in serum amino acid concentration areas under the curve (AUC, over 3 hours) in mice (n=3) gavaged with protein compared with vehicle. (C) Relative increase in the peak plasma amino acid concentrations in mice (n=3) gavaged with protein compared with vehicle for 1 hour. (D) FACS analysis of mTORC1 activation in blood monocytes (using phosphorylated S6) from male mice (n=6) gavaged with protein compared with vehicle. P=0.00773. (E) Western blot analysis of mTORC1 activation (assessed by phosphorylated S6) in bone marrow-derived macrophages stimulated by selected amino acids with highest excursion in (B) (applied at concentrations that correspond to their peak serum concentration). (F) FACS analysis of mTORC1 activation in blood monocytes (using phosphorylated S6) from mice gavaged with 0.8 g/kg protein (n=5), 1.6 g/kg protein (n=9), and 0.8 g/kg protein plus enough leucine to make up the difference in the leucine content of the 0.8g/kg and 1.6g/kg protein (n=9, P=0.01094 and 0.0058.). For all graphs, data are presented as mean ± SEM, determined by Two-way ANOVA with Sidak’s multiple comparisons for D, or by One-way ANOVA with Dunnett’s multiple comparisons for F. *P ≤ 0.05, **P < 0.01.
Figure 7.
Figure 7.. Impact of varying dietary protein intake on atherosclerosis in a mouse model
(A) Comparison of daily protein intake from mice fed 4 Western diets (WD) (n=4 for each group) containing different amounts of protein (left) and superimposing these diets on the protein intake curve of people with the murine standard WD corresponding to the human recommended daily intake (RDI) (right). (B) Summary of the experimental protocol for in vivo assessment of atherosclerosis in ApoE−/− mice using diets with protein content below that of standard WD (low protein WD) and above standard WD (moderate protein WD and high protein WD). (C) Total body weight of ApoE−/− mice fed Western diets with low protein (LP WD), moderate protein (MP WD), or high protein (HP WD) for 8 weeks. n=5 for each group. (D) Quantification of atherosclerotic plaque burden in Oil Red O–stained aortic root sections from ApoE−/− mice fed the low, moderate, or high protein Western diets for 8 weeks (LP WD=18, MP WD=15, HP WD=13); representative roots are shown on the left, lesion areas are shown on the right. P=0.0002 and 0.0013. (E-G) Plaque composition quantified by immunofluorescence (IF) microscopy of aortic root sections for (E) macrophages (MOMA-2) (LP WD=18, MP WD=15, HP WD=13 biologically independent animals, P=0.0095, 0.0071, and 0.0015.), (F) apoptosis (TUNEL+) (LP WD=18, MP WD=15, HP WD=12 biologically independent animals, P<0.0001 and P=0.2562), and (G) necrotic core (LP WD=18, MP WD=15, HP WD=13, P<0.0001). (H) IF microscopy analysis of pS6 levels in macrophages located inside atherosclerotic plaques from mice fed the low, moderate, or high protein Western diets for 8 weeks (LP WD=18, MP WD=15, HP WD=5 biologically independent animals, P=0.0067 and 0.0770). For all graphs, data are presented as mean ± SEM, and determined by two-sided Mann-Whitney U-test. *P ≤ 0.05, **P < 0.01 and ***P < 0.001.
Figure 8.
Figure 8.. Effects of dietary protein and leucine intake on macrophage mTORC1 signaling and atherosclerotic cardiovascular risk
(A) Summary of the experimental protocol for in vivo assessment of atherosclerosis in ApoE−/− mice using six different diets with varying protein, amino acid, and leucine contents, including: 1) moderate-protein Western Diet [called MP-WD], 2) high-protein Western Diet [called HP-WD], 3) MP-WD to which leucine, but no other amino acids, was added to match the leucine content of the HP-WD [called MP-WD+Leu], 4) MP-WD to which amino acids were added to match the total AA content of the HP-WD [called MP-WD+AA], 5) MP-WD to which additional amino acids, except for leucine, were added to match the contents of all amino acids, except leucine, in the HP-WD [called MP-WD+AA (Normal Leu)], and 6) nitrogen-adjusted version of MP-WD+AA (normal Leu), which consisted of the MP-WD with additional amino acids, except leucine, to make it isonitrogenous with the HP-WD [called MP-WD+AA (Normal Leu (IsoN))]. (B-C) Quantification of atherosclerotic plaque burden in Oil Red O–stained en face aorta (B) and aortic root sections (C) from ApoE−/− mice fed the diets indicated (MP-WD, n=10; HP-WD, n=7; MP-WD+Leu, n=10, MP-WD+AA, n=10, MP-WD+AA (Normal Leu), n=15; MP-WD+AA (Normal Leu (IsoN)), n=15). P=0.00082 0.01902, and 0.04849 for B, and P=0.03232, P<0.0001, P=0.00273 for C. (D) Ingestion of a protein-rich meal (containing ~25 g or about ≥22% kcal protein) leads to a rise in circulating amino acids to levels which trigger mTORC1 activation and downstream signaling in monocytes/macrophages. This phenomenon is unique to leucine (and not other amino acids) and mediates the deleterious functional impact of this signaling on elevated atherosclerosis and cardiovascular risk. For all graphs, data are presented as mean ± SEM, and determined by One-way ANOVA with Dunnett’s multiple comparisons. *P ≤ 0.05, **P < 0.01 and ***P < 0.001.

References

    1. Fan J, Kitajima S, Watanabe T, et al. Rabbit models for the study of human atherosclerosis: From pathophysiological mechanisms to translational medicine. Pharmacol Ther. Published online 2015. doi:10.1016/j.pharmthera.2014.09.009 - DOI - PMC - PubMed
    1. Debry G Dietary Proteins and Atherosclerosis.; 2003. doi:10.1201/9781439831878.ch5 - DOI
    1. Zhang X, Sergin I, Evans TD, et al. High-protein diets increase cardiovascular risk by activating macrophage mTOR to suppress mitophagy. Nat Metab. 2020;2(1):110–125. doi:10.1038/s42255-019-0162-4 - DOI - PMC - PubMed
    1. Wolfson RL, Chantranupong L, Saxton RA, et al. Sestrin2 is a leucine sensor for the mTORC1 pathway. Science (80- ). Published online 2016. doi:10.1126/science.aab2674 - DOI - PMC - PubMed
    1. Saxton RA, Chantranupong L, Knockenhauer KE, Schwartz TU, Sabatini DM. Mechanism of arginine sensing by CASTOR1 upstream of mTORC1. Nature. Published online 2016. doi:10.1038/nature19079 - DOI - PMC - PubMed

LinkOut - more resources