. 2024 Feb;6(2):323-342.
doi: 10.1038/s42255-023-00972-y. Epub 2024 Feb 19.

A homoeostatic switch causing glycerol-3-phosphate and phosphoethanolamine accumulation triggers senescence by rewiring lipid metabolism

Affiliations

A homoeostatic switch causing glycerol-3-phosphate and phosphoethanolamine accumulation triggers senescence by rewiring lipid metabolism

Khaled Tighanimine et al. Nat Metab. 2024 Feb.

Abstract

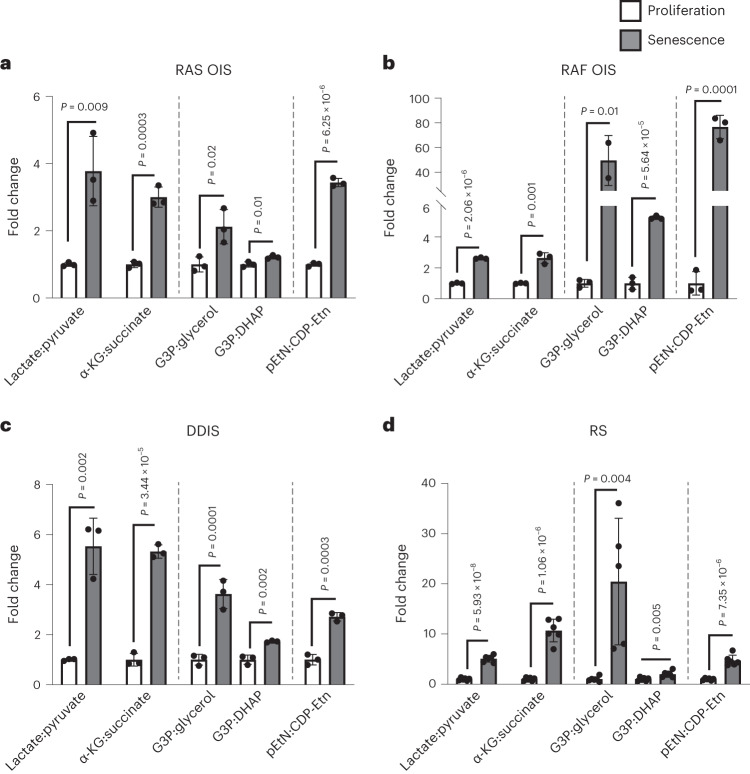
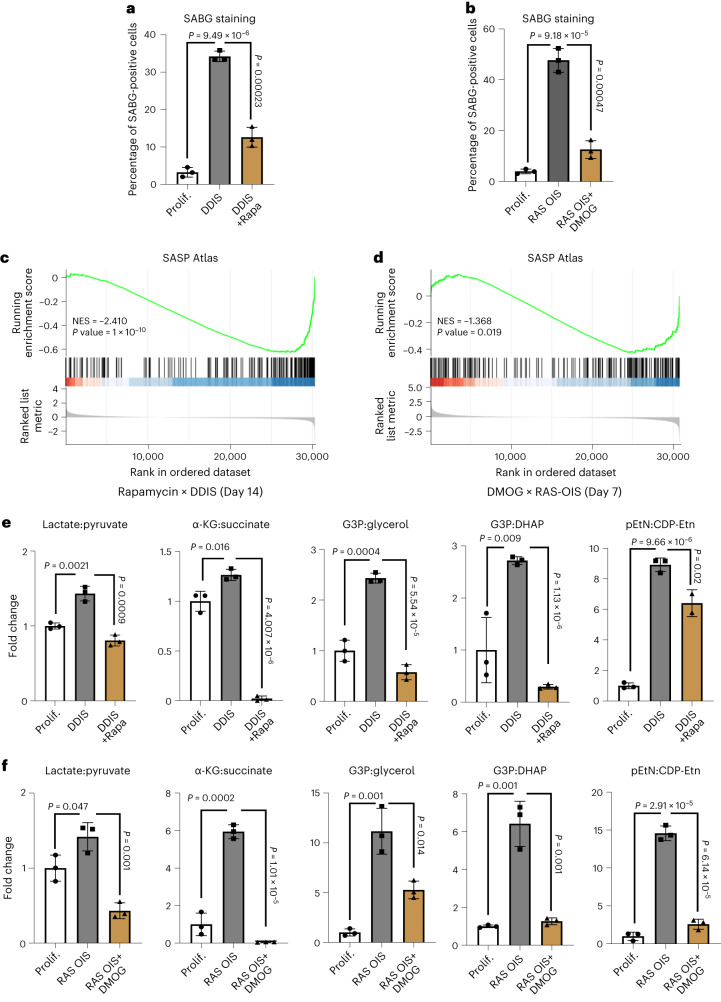
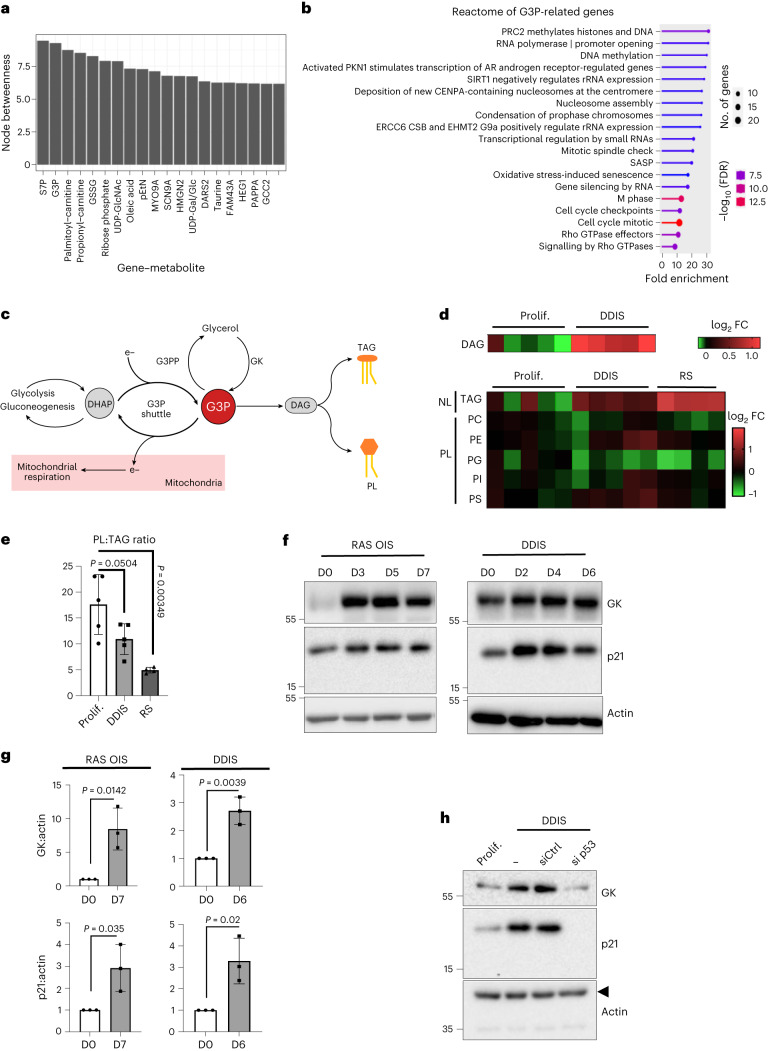
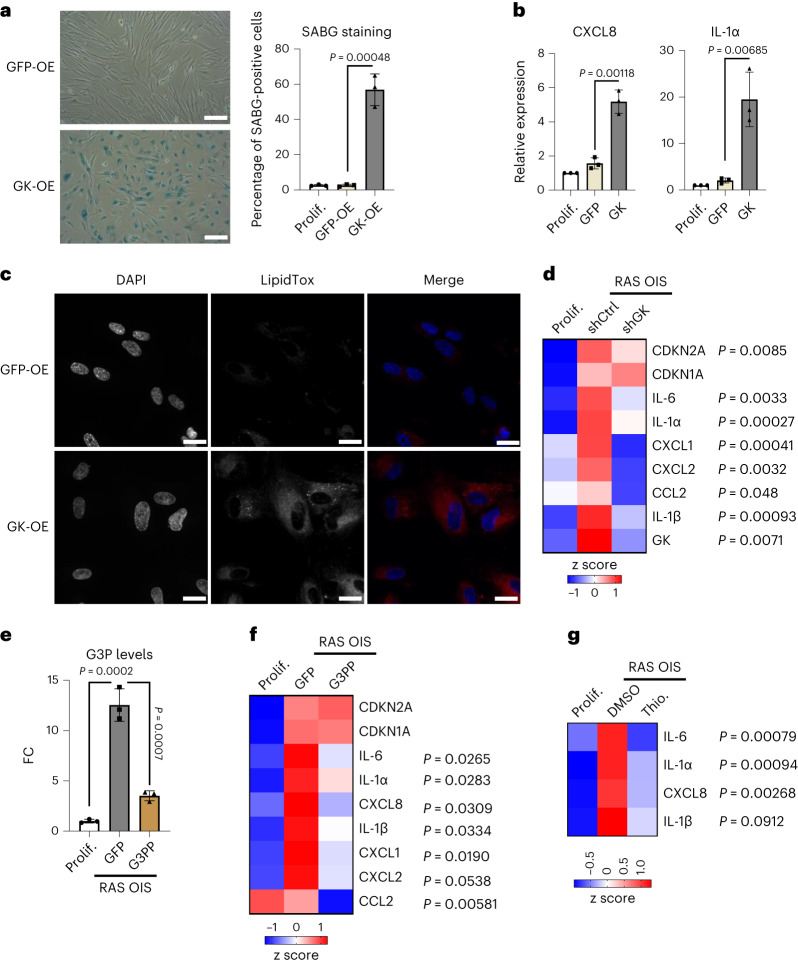
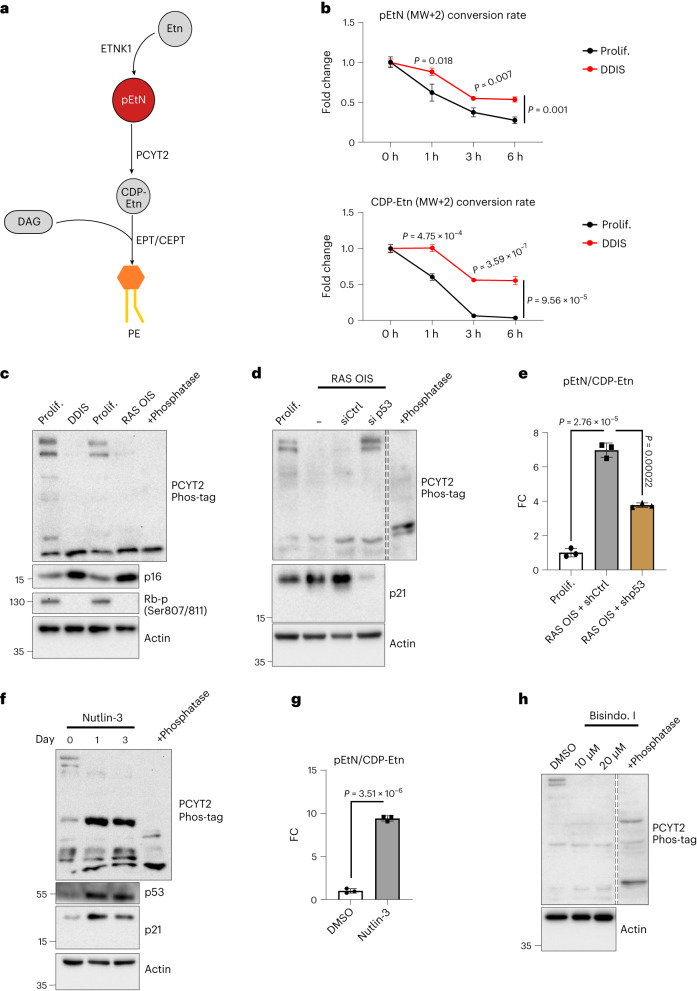
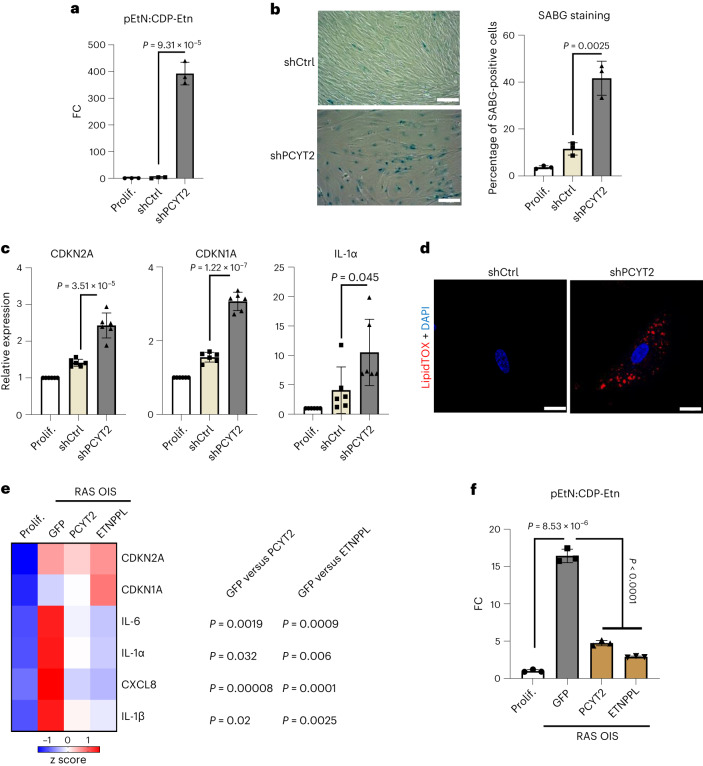
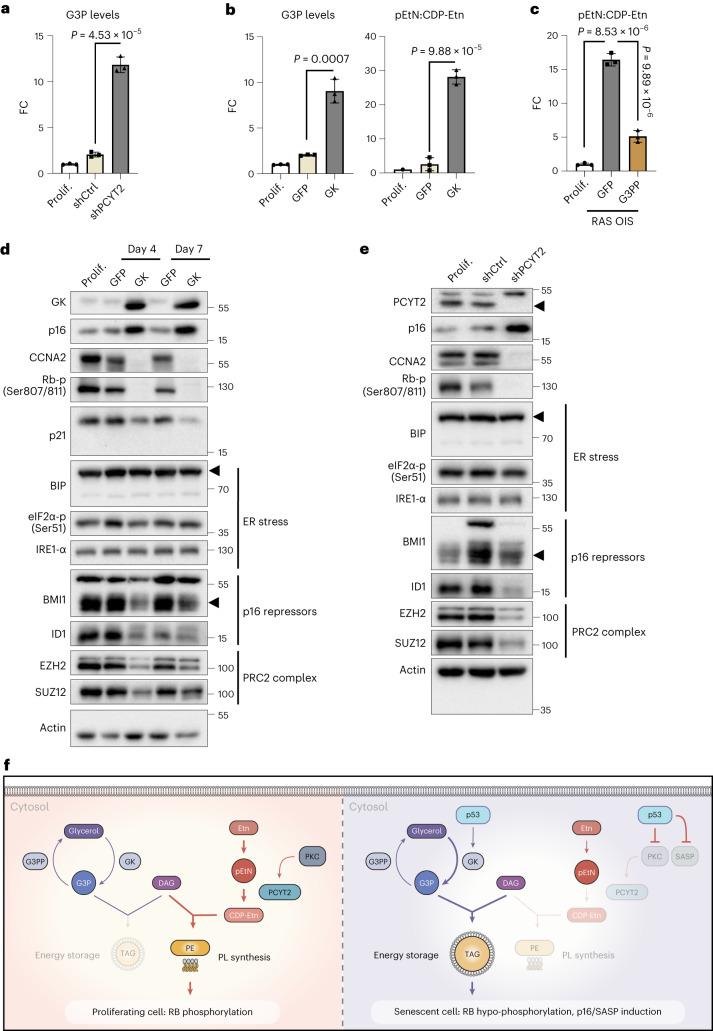
Cellular senescence affects many physiological and pathological processes and is characterized by durable cell cycle arrest, an inflammatory secretory phenotype and metabolic reprogramming. Here, by using dynamic transcriptome and metabolome profiling in human fibroblasts with different subtypes of senescence, we show that a homoeostatic switch that results in glycerol-3-phosphate (G3P) and phosphoethanolamine (pEtN) accumulation links lipid metabolism to the senescence gene expression programme. Mechanistically, p53-dependent glycerol kinase activation and post-translational inactivation of phosphate cytidylyltransferase 2, ethanolamine regulate this metabolic switch, which promotes triglyceride accumulation in lipid droplets and induces the senescence gene expression programme. Conversely, G3P phosphatase and ethanolamine-phosphate phospho-lyase-based scavenging of G3P and pEtN acts in a senomorphic way by reducing G3P and pEtN accumulation. Collectively, our study ties G3P and pEtN accumulation to controlling lipid droplet biogenesis and phospholipid flux in senescent cells, providing a potential therapeutic avenue for targeting senescence and related pathophysiology.


Conflict of interest statement

The authors declare no competing interests.

Figures

Fig. 1
Fig. 1. Untargeted metabolomics reveals a shared metabolic signature across several senescence models.
a, Experimental design for the integrative analysis of time-resolved metabolome and transcriptome datasets obtained from WI38 fibroblasts undergoing RAS and RAF OIS, etoposide-mediated DDIS, RS and quiescence (Q). D, day. be, Heat maps showing modules of temporally coexpressed metabolites in WI38 fibroblasts for the indicated senescence inducers at indicated time points using a hierarchical clustering method (WGCNA). Roman numerals refer to different metabolite modules. Data are expressed as row z scores collected from three biologically independent experiments per condition. GSSG, glutathione disulfide (oxidized glutathione); UDP-Gal/Glc, uridine diphosphate galactose/glucose; UDP-GlcNAc, uridine diphosphate N-acetylglucosamine. f, Integrated dynamic metabolome PCA for cells undergoing RAS and RAF OIS, DDIS, RS and Q as control. Metabolite levels were normalized by the ComBat tool. Dashed lines depict the metabolome trajectory for each treatment. g, Correlation circle for the percentage contribution of the indicated metabolites to principal components PC1 and PC2 of f.
Fig. 2
Fig. 2. Identification of common SAMS.
ad, Fold change of the ratios between the indicated metabolites in WI38 fibroblasts undergoing RAS OIS (n = 3), RAF OIS (n = 3), DDIS (n = 3) and RS (n = 6) measured for each treatment at the last time point of the kinetics and relative to the values of proliferating cells. The pEtN:CDP-Etn ratio in RS was calculated using D11 as a proliferative control. Bars represent the means of biological replicates ± s.d. Indicated P values were calculated using an unpaired two-sided Student’s t-test. Source data
Fig. 3
Fig. 3. Senescence repression correlates with SAMS repression.
a, Percentage of SABG-positive cells of cultures of WI38 fibroblasts non-treated (Prolif.) undergoing DDIS in the presence or the absence of rapamycin for 7 days. b, Percentage of SABG-positive cells of WI38 fibroblasts non-treated (Prolif.) or undergoing RAS-induced senescence (RAS OIS) treated or not with DMOG for 7 days. c,d, GSEA enrichment of SASP genes of DDIS rapamycin-treated cells (14 days) (c) and RAS OIS DMOG-treated cells (7 days) (d). NES, normalized enrichment score. e,f, Fold changes of SAMS in WI38 fibroblasts undergoing DDIS ± rapamycin for 14 days (e) and RAS OIS ± DMOG for 7 days (f). For a,b,e,f, bars represent the means of three biological replicates ± s.d. Indicated P values were calculated using an unpaired two-sided Student’s t-test. Source data
Fig. 4
Fig. 4. Glycerol-3-P accumulation at the onset of senescence metabolic reprogramming.
a, Nodes with the highest betweenness values (top 20; Supplementary Table 9) in the gene–metabolite correlation network connecting genes and metabolites presenting a correlation with an absolute value >0.5 for RAS OIS and RAF OIS, etoposide-mediated DDIS, RS and Q. MYO9A, myosin 9-A; SCN9A, sodium voltage-gated channel α subunit 9; HMGN2, high mobility group nucleosomal binding domain 2; DARS2, aspartyl-tRNA synthetase 2, mitochondrial; FAM43A, family with sequence similarity 43 member A; HEG1, heart development protein with EGF-like domains 1; PAPPA, pappalysin 1; GCC2, GRIP and coiled-coil domain containing 2. b, Reactome analysis of genes correlating either positively or negatively with G3P accumulation during senescence in WI38 fibroblasts. c, Simplified scheme of the metabolic pathways involving G3P. d, Heat maps representing levels of indicated lipid species in WI38 fibroblasts proliferating (n = 5), undergoing DDIS (n = 5) or RS (n = 4). PC, phosphatidylcholine; PE, phosphatidylethanolamine; PI, phosphatidylinositol; PS, phosphatidylserine; PG, phosphatidylglycerol; FC, fold change. e, Ratio of total PL to TAG levels normalized to protein content in proliferative WI38 fibroblasts compared to DDIS (n = 5) or RS (n = 4) cells. f, Immunoblots showing indicated protein levels in WI38 fibroblasts undergoing RAS OIS (left) or DDIS (right). Sample processing controls (actin) were migrated into different gels from those of GK. g, Densitometric quantification of GK and p21 protein levels relative to actin from three experiments, including the one shown in panel (f), in RAS OIS (day 7) and DDIS (day 6). h, Western blots showing indicated protein levels in extracts from WI38 fibroblasts proliferating or undergoing DDIS and non-transfected (−) or transfected with a control non-silencing siRNA (siCtrl) or an siRNA targeting the p53 mRNA (si p53) for 4 days. The experiment was repeated independently twice with similar results. In e,g, data are presented as mean ± s.d. Indicated P values were calculated using an unpaired two-sided Student’s t-test. Source data
Fig. 5
Fig. 5. Glycerol-3-P accumulation drives metabolic senescence programme and SASP induction.
a, Representative images (left) and percentage (right) of SABG-positive WI38 fibroblasts infected with GFP-OE or GK-OE adenoviruses for 7 days. The percentage is also reported for control, non-infected proliferating cells. n = 3 biologically independent experiments. Data are presented as mean ± s.d. Indicated P values were calculated using an unpaired two-sided Student’s t-test. Scale bars, 50 µm. b, mRNA levels of the indicated SASP markers as measured by RT–qPCR in WI38 fibroblasts treated as in a, relative to the value of non-infected cells (Prolif.). n = 3 biologically independent experiments. Data are presented as mean ± s.d. Indicated P values were calculated using an unpaired two-sided Student’s t-test. c, Representative images of 4,6-diamidino-2-phenylindole (DAPI) and LipidTox staining of WI38 fibroblasts infected with GFP-OE or GK-OE adenovirus for 7 days. The experiment was repeated independently three times with similar results. Scale bars, 20 µm. d, Heat map of the indicated mRNA levels as measured by RT–qPCR in WI38 fibroblasts proliferating or undergoing RAS OIS and infected with an adenovirus driving the expression of a control scramble shRNA (shCtrl) or an shRNA targeting GK mRNA (shGK) for 7 days (n = 3). Indicated P values were calculated using an unpaired two-sided Student’s t-test between shCtrl and shGK conditions. e, FC of G3P levels in WI38 fibroblasts undergoing RAS OIS and infected with GFP-OE or G3PP-OE adenoviruses for 7 days, relative to the value of non-infected cells (Prolif.). n = 3 biologically independent experiments. Data are presented as mean ± s.d. Indicated P values were calculated using an unpaired two-sided Student’s t-test. f, Heat map of the indicated mRNA levels as measured by RT–qPCR in WI38 fibroblasts treated as in e (n = 3). P values (unpaired two-sided Student’s t-test) in gene expression between GFP and G3PP are indicated. g, Heat map of the indicated mRNA levels as measured by RT–qPCR in WI38 fibroblasts subjected to RAS OIS and treated with dimethylsulfoxide (DMSO) or 1-thioglycerol (1 mM) for 7 days, relative to the value of non-infected cells (Prolif.) (n = 3). Indicated P values were calculated using an unpaired two-sided bilateral Student’s t-test between DMSO and 1-thioglycerol conditions. Source data
Fig. 6
Fig. 6. PCYT2 is less active and dephosphorylated in senescent cells.
a, Schematic overview of the phosphatidylethanolamine pathway highlighting pEtN and the enzymes involved in the pathway. b, Curves of decay of labelled pEtN or CDP-Etn in WI38 fibroblasts proliferating or undergoing DDIS (day 10), after a pulse of 1 h followed by a chase for the indicated times. n = 3 biological replicates. c, Representative western blots of a Phos-tag gel (top) and a conventional gel (bottom) showing the indicated protein levels in extracts from WI38 fibroblasts proliferating, undergoing DDIS (14 days) or RAS OIS (7 days). The phosphatase-treated extract is from proliferating cells. Loading control (actin) was migrated into the same gel as RB. d, Representative western blots of a Phos-tag gel (top) and a conventional gel (bottom) showing the indicated protein levels in extracts from WI38 fibroblasts proliferating or undergoing RAS OIS and non-transfected (-) or transfected with a non-silencing siRNA or an siRNA targeting the p53 mRNA for 3 days. The phosphatase-treated extract is from proliferating cells. Dashed lines indicate the cropping of two lanes. Sample processing control (actin) was migrated into a different gel than p21. The experiment was repeated independently twice with similar results. e, Fold change of pEtN:CDP-Etn ratio in WI38 fibroblasts undergoing RAS OIS and infected with shCtrl-OE or shp53-OE adenoviruses for 7 days, relative to the value of non-infected cells (Prolif.). n = 3 biologically independent experiments. f, Representative western blots of a Phos-tag gel (top) and a conventional gel (bottom) showing the indicated protein levels in extracts from WI38 fibroblasts treated by Nutlin-3 (10 µM) for the indicated times. The phosphatase-treated extract is from proliferating cells. The experiment was repeated independently twice with similar results. g, FC of pEtN:CDP-Etn ratio in WI38 fibroblasts treated by Nutlin-3 (10 µM) for 7 days. n = 3 biologically independent experiments. h, Representative western blots of a Phos-tag gel (top) and a conventional gel (bottom) showing the indicated protein levels in extracts from WI38 fibroblasts treated with BisIndo.I at the indicated concentrations for 16 h. Dashed lines indicate the cropping of one lane. For b,e,g, data are presented as mean ± s.d. All the indicated P values were calculated using an unpaired two-sided Student’s t-test. For c,h, the experiment was repeated independently three times with similar results. Source data
Fig. 7
Fig. 7. PCYT2 and pEtN modulation regulate the senescence metabolic reprogramming.
a, FC of pEtN:CDP-Etn ratio in WI38 fibroblasts infected with an adenovirus driving the expression of a control shRNA (shCtrl) or an shRNA targeting the PCYT2 mRNA (shPCYT2) for 7 days, relative to the value of non-infected cells (Prolif.) b, Representative images (left) and percentage (right) of SABG-positive WI38 fibroblasts treated as in a. The percentage is also reported for non-infected proliferating cells. Scale bars, 20 µm. c, mRNA levels of senescence markers scored by RT–qPCR in WI38 fibroblasts treated as in a. n = 6 biologically independent experiments. Data are presented as mean ± s.d. Indicated P values were calculated using an unpaired two-sided Student’s t-test. d, Representative images of DAPI and LipidTox staining of WI38 fibroblasts infected with an adenovirus driving the expression of a control shRNA (shCtrl) or an shRNA targeting the PCYT2 mRNA (shPCYT2) for 7 days. The experiment was repeated independently three times with similar results. e, Heat map of the indicated mRNA levels as measured by RT–qPCR in WI38 fibroblasts proliferating (Prolif.) or subjected to Ras induction and infected with adenoviruses overexpressing GFP, PCYT2 or ETNPPL for 7 days (n = 3). P values (unpaired two-sided Student’s t-test) in gene expression between RAS OIS + GFP and RAS OIS + PCYT2 or between RAS OIS + GFP and RAS OIS + ETNPPL are indicated. f, FC of pEtN:CDP-Etn ratio in WI38 fibroblasts treated as in e, normalized to the value of non-infected cells (Prolif.). For a,b,f, bars represent the means of three biological replicates ± s.d. Indicated P values were calculated using an unpaired two-sided Student’s t-test. Source data
Fig. 8
Fig. 8. Phosphoethanolamine and G3P accumulation are interconnected and regulate RB phosphorylation during senescence.
a, FC of G3P levels in WI38 fibroblasts infected with an adenovirus overexpressing a control shRNA (shCtrl) or an shRNA targeting the PCYT2 mRNA (shPCYT2) for 7 days, relative to the value of non-infected cells (Prolif.). n = 3 biologically independent experiments. Data are presented as mean ± s.d. Indicated P values were calculated using an unpaired two-sided Student’s t-test. b, FC of G3P levels and pEtN:CDP-Etn ratio in WI38 fibroblasts infected with GFP-OE or GK-OE adenovirus for 7 days, relative to the value of non-infected cells (Prolif.). n = 3 biologically independent experiments. Data are presented as mean ± s.d. Indicated P values were calculated using an unpaired two-sided Student’s t-test. c, FC of pEtN:CDP-Etn ratio in WI38 fibroblasts infected with GFP-OE or G3PP-OE adenovirus for 7 days, relative to the value of non-infected cells (Prolif.). n = 3 biologically independent experiments. Data are presented as mean ± s.d. Indicated P values were calculated using an unpaired two-sided Student’s t-test. d, Representative western blots showing indicated protein levels in WI38 fibroblasts not infected (Prolif.) or infected with GFP-OE or GK-OE adenoviruses for 4 or 7 days. Loading control (actin) was migrated into the same gel than p16, CCNA2 and GK. The experiment was repeated independently three times with similar results. e, Representative western blots showing indicated protein levels in WI38 fibroblasts not infected (Prolif.) or infected with an adenovirus overexpressing a control shRNA (shCtrl) or an shRNA targeting the PCYT2 mRNA (shPCYT2) for 7 days. The arrowhead indicates the position of the band corresponding to the PCYT2 protein. Loading control (actin) was migrated into the same gel as CCNA2 and RB. The experiment was repeated independently three times with similar results. f, Representation of G3P and pEtN metabolic interconnections leading to TAG accumulation and senescence. Source data
Extended Data Fig. 1
Extended Data Fig. 1. Transcriptome Evolution of Senescence Inducers.
A: Heat maps showing modules of temporally coexpressed genes for the indicated senescence inducers and quiescence (Q) at the indicated time points using an unsupervised weighted clustering network analysis (WGCNA) approach. Roman numerals refer to different gene clusters. Data are expressed as row Z scores collected from two biologically independent experiments per condition. B: Functional over-representation map depicting Molecular Signaling Database(MSigDB) hallmark (H.) gene sets associated with each transcriptomic cluster for the indicated senescence inducers. Circles are colour-coded according to the FDR-corrected p value based on the hypergeometric text comparing the overlap between the set of genes in each cluster and the respective list of genes in each MSigDB pathway. Size is proportional to the percentage of genes in the MsigDB gene set belonging to the cluster. N > 100 genes per transcriptomic module for each senescence inducer. Exact values for raw p values, adjusted p values and overlap (absolute and relative) between each pair of sets are reported in Supplementary Table S2. C: Expression heat map of core senescence genes for the indicated senescence inducers and quiescence as control.
Extended Data Fig. 2
Extended Data Fig. 2. Metabolome profile of quiescent cells and benchmarking batch-effect correction using ComBat.
A: Heat map showing modules of temporally coexpressed metabolites in WI38 fibroblasts for quiescence at indicated time points using a hierarchical clustering method (WGCNA). Roman numerals refer to different metabolite clusters. Shown are the top forty metabolites based on the most significant adjusted p values. Data are expressed as row Z scores collected from three biologically independent experiments per condition.B: Experimental design for batch correction validation. DNA damage-induced senescence (DDIS) and quiescence (Q) samples correspond to the same, as shown in Fig. 1a. The validation dataset included technical replicates of a subset of those samples and was measured in the same mass spectrometry run. C-E: Visualization of the average computed values for (C) relative standard deviation (RSD), (D) repeatability, and (E) Bhattacharyya distance for each approach. F-H: Comparison between the obtained values for the ComBat approach following quantile normalization (QN) and the other approaches for each measured peak (or sample) based on three metrics: (F) RSD, (G) repeatability and (H) Bhattacharyya distance. Black lines show the identity function. I- J: PCA plots depicting the average of each sample used for batch correction validation (I) before and (J) after quantile normalization and ComBat.
Extended Data Fig. 3
Extended Data Fig. 3. SAMS induction kinetics and specific metabolic response to distinct senescence inducers.
Fold changes kinetics of the indicated metabolites belonging to the SAMS in WI38 fibroblasts undergoing DDIS (A) or RAS-OIS (B). n = 3 biologically independent experiments for each time point and condition. Indicated p values were calculated using an unpaired two-sided Student’s t-test. Data are presented as mean values +/- SD. C: Sparse Least Squares Regression – Discriminant Analysis (sPLS-DA) depicting the two orthogonal components that maximize the separation of samples treated with different CS inducers. Metabolite levels were normalized by the Combat tool considering fibroblasts undergoing RAS- and RAF-OIS, DDIS, and RS. Dashed lines depict the metabolome trajectory for each treatment. The background colour depicts the predicted CS inducer given a sample metabolic state. D: Correlation circle depicting the projection of the sPLS-DA selected metabolites in each component. E: Normalized levels for the metabolites which activity best discriminate experimental treatment. Source data
Extended Data Fig. 4
Extended Data Fig. 4. Transcriptome and metabolome profiles of senescent myoblasts.
A,D: Heat maps showing modules of temporally coexpressed (A) genes and (D) metabolites for myoblasts undergoing RAS-OIS using an unsupervised weighted clustering network analysis (WGCNA) approach. Roman numerals refer to different coexpression clusters. Data are expressed as row Z scores collected from (A) two and (D) three biologically independent experiments per condition. B: Functional over-representation map depicting Molecular Signaling Database(MSigDB) hallmark (H.) gene sets associated with each transcriptomic cluster for the indicated senescence inducers. Circles are colour-coded according to the FDR-corrected p value based on the hypergeometric text comparing the overlap between the set of genes in each cluster and the respective list of genes in each MSigDB pathway. Size is proportional to the percentage of genes in the MsigDB gene set belonging to the cluster. N > 100 genes per transcriptomic module for each senescence inducer. Exact values for raw p values, adjusted p values and overlap (absolute and relative) between each pair of sets are reported in Supplementary Table S2. C: Expression heat map of core senescence genes for myoblasts undergoing RAS-OIS. E: Fold change of the ratios between the indicated metabolites or of metabolite levels in myoblasts undergoing RAS-OIS (n = 3), measured at the indicated time point of the kinetics and relative to the values of proliferating cells. Data are presented as mean values +/- SD. Indicated p values were calculated using an unpaired two-sided Student’s t-test. F: Fold change of the ratios between the indicated metabolites or of metabolite levels in myoblasts undergoing replicative senescence (n = 6) and relative to the values of proliferating cells. Data are presented as mean values +/- SD. Indicated p values were calculated using an unpaired two-sided Student’s t-test. G-J: Fold changes kinetics of the indicated metabolites belonging to the SAMS in myoblasts undergoing RAS-OIS. n = 3 biologically independent experiments for each time point. Indicated p values were calculated using an unpaired two-sided Student’s t-test. Data are presented as mean values +/- SD. (The panel C contains small letters and numbers that overlap with the heatmap and the X axis. They need to be removed). Source data
Extended Data Fig. 5
Extended Data Fig. 5. Rapamycin and DMOG revert transcriptomic features of senescence.
A: Heat map showing modules of temporally coexpressed genes for WI38 cells undergoing etoposide-mediated DDIS in the presence (+) or the absence (-) of rapamycin (Rapa) at the indicated time points using an unsupervised weighted clustering network analysis (WGCNA) approach. B: Functional over-representation map depicting Molecular Signaling Database (MSigDB) hallmark gene sets associated with each transcriptomic module (Fig. 3c) for cells undergoing etoposide-mediated DDIS in the presence or the absence of rapamycin. C: Heat map showing modules of temporally coexpressed genes for WI38 fibroblasts undergoing RAS-OIS and treated or not with DMOG at the indicated time points using an unsupervised weighted clustering network analysis (WGCNA) approach. For panels A, C, roman numerals refer to different modules. Data are expressed as row Z scores collected from two biologically independent experiments per condition. D: Functional over-representation map depicting Molecular Signaling Database (MSigDB) hallmark gene sets associated with each transcriptomic module (Fig. 3d) for cells undergoing RAS-OIS in the presence or the absence of DMOG. For panels B,D, circles are colour-coded according to the FDR-corrected p value based on the hypergeometric text comparing the overlap between the set of genes in each cluster and the respective list of genes in each MSigDB pathway. Size is proportional to the percentage of genes in the MsigDB gene set belonging to the cluster. N > 100 genes per transcriptomic module for each senescence inducer. Exact values for raw p values, adjusted p values and overlap (absolute and relative) between each pair of sets are reported in Supplementary Table S6 E: River plot depicting the overlaps between gene expression modules in cells undergoing RAS-OIS in the absence or presence of DMOG and cells undergoing DDIS in the absence or presence of rapamycin (Rapa). Blue and red tracks highlight genes down- and upregulated in both senescence perturbation experiments. F: Heat map showing modules of temporally coexpressed metabolites in WI38 fibroblasts undergoing etoposide-mediated DDIS in the presence or the absence of rapamycin for the indicated times using a hierarchical clustering approach. G: Heat map showing modules of temporally coexpressed metabolites for RAS-OIS cells in the presence (+) and absence (-) of DMOG at the indicated time points using a hierarchical clustering approach. For panels F, G, data are expressed as row Z scores collected from three biologically independent experiments per condition and time point.
Extended Data Fig. 6
Extended Data Fig. 6. The G3P shuttle is not involved in the establishment of senescence.
A: Nodes with the highest betweenness values (top 20) in the overlap network produced by intersecting a Myoblast-only Gene–Metabolite Correlation Network, which considers genes and metabolites presenting a correlation with absolute value higher than 0.5 in myoblast samples, and the Fibroblast Gene-Metabolite Correlation Network, considering all senescence inducers (RAS- and RAF-OIS, DDIS, and RS) and quiescence (Q). B: Genes (green squares) whose expression correlates either positively or negatively with G3P accumulation during senescence in WI38 fibroblasts. The size of green squares is proportional to node betweenness for each target. C: Representative Western blots showing indicated protein levels in extracts of WI38 fibroblasts proliferating or undergoing DDIS for 7 days. D: Activity of mitochondrial Glycerol-3-phosphate dehydrogenase calculated from the measurement of glycerol-3-phosphate cytochrome c reductase in WI38 fibroblasts undergoing DDIS or RAS-OIS during 7 days. n = 2 biological replicates. E: Representative Western blots showing indicated protein levels in WI38 fibroblasts proliferating (Prolif.) or undergoing RAS-OIS induction and not infected (-) or infected with an adenovirus overexpressing GFP or GPD1 for 7 days. F: Densitometric quantification of p16 and p21 protein levels relative to actin from three experiments, including the one of the panel, in proliferative, RAS-OIS cells infected with GFP- or GPD1-overexpressing adenoviruses for 7 days. G: mRNA levels scored by RT–qPCR in WI38 fibroblasts proliferating (Prolif.) or undergoing RAS-OIS and infected with an adenovirus carrying a control scramble shRNA (shCtrl) or an shRNA targeting GPD1 (shGPD1) for 7 days. H: Maximal fold change of the GK mRNA in WI38 fibroblasts and myoblasts induced to senesce under the indicated conditions relative to proliferating cells as measured by Affymetrix microarrays (n = 2 for all the samples, except n = 4 for the senescence sample of RS and n = 3 for proliferative samples of DDIS fibroblasts and RAS-OIS myoblasts). Data are presented as mean values. I: Measurement of glycerol uptake in WI38 fibroblast proliferating, undergoing RAS-OIS (7 days) or DDIS (10 days). The reported values are relative to those of proliferating cells. For panels F, G, E, bars represent the means of 3 biological replicates +/- s.d. Indicated p values were calculated using an unpaired two-sided Student’s t-test. Source data
Extended Data Fig. 7
Extended Data Fig. 7. P53 activation recapitulates part of the SAMS.
A: Immunoblots showing the levels of the indicated proteins in WI38 fibroblasts proliferating (Prolif.), or undergoing DDIS and infected with an adenovirus driving the expression of a control shRNA (shCtrl) or an shRNA targeting p53 for 7 days. The numbers below the top panel are the quantification of GK levels relative to those of α-tubulin. The experiment was repeated independently twice. B: Immunoblots blots showing the indicated protein levels in WI38 fibroblasts proliferating and treated with vehicle or Nutlin-3 for 3 or 6 days. The numbers below the top panel are the quantification of GK levels relative to those of Actin. C: Levels of the indicated mRNAs as measured by RT–qPCR in WI38 fibroblasts proliferating and treated with vehicle or Nutlin-3 for 6 and 10 days. The reported values are relative to those of proliferating cells. Bars represent the means of 3 biological replicates +/- s.d. Indicated p values were calculated using an unpaired two-sided Student’s t-test. D: Representative heat map using hierarchical clustering showing metabolites in WI38 fibroblasts treated with DMSO or nutliln-3 for 7 days. Data are expressed as row Z scores collected from three biologically independent experiments per condition. E: Fold change of G3P levels in WI38 fibroblast treated with DMSO or nutliln-3 for 7 days, relative to the value of DMSO-treated cells. Bars represent the means of 3 biological replicates +/- s.d. Indicated p values were calculated using an unpaired two-sided Student’s t-test. F: Representative images of DAPI and LipidTox staining of WI38 fibroblasts treated with DMSO or nutlin-3 for 7 days. The experiment was repeated independently twice with similar results. Scale bars represent 20 µm. Source data
Extended Data Fig. 8
Extended Data Fig. 8. Effects of perturbing G3P levels on metabolome of senescent cells and characterization of the pEtN synthesis pathway.
A: Heat map showing modules of metabolites in WI38 fibroblast proliferating or infected with a GFP- or GK-overexpressing adenovirus for 7 days. B: Heat map showing modules of metabolites in WI38 fibroblast proliferating or undergoing RAS-OIS and infected with a GFP- or G3PP-overexpressing adenovirus for 7 days. For both panels, a hierarchical clustering approach was used. Data are expressed as row Z scores collected from three biologically independent experiments per condition. C: Measurement of labelled Etn uptake in WI38 fibroblasts proliferating, undergoing DDIS or RAS-OIS for 7 days after a pulse of 1 hour. The reported values are relative to those of proliferating cells. Bars represent the mean of 3 biological replicates +/- s.d. Indicated p values were calculated using an unpaired two-sided Student’s t-test. D: Curves of decay of labelled Etn in WI38 fibroblasts proliferating or undergoing DDIS, after a pulse of 1 hr followed by a chase for the indicated times. For each treatment the values are normalized to those of the 0 hr chase time. Each point represents the mean of 3 biological replicates +/- s.d. Indicated p values were calculated using an unpaired two-sided Student’s t-test. E: Maximal fold change of PCYT2 mRNA in cells induced to senesce under the indicated conditions relative to proliferating cells as measured by Affymetrix microarrays (n = 2 for each sample). F: Representative Western blots showing the indicated protein levels in WI38 fibroblasts proliferating (Prolif.), undergoing RAS-OIS or DDIS for 7 days. The experiment was repeated independently 3 times with similar results. Source data
Extended Data Fig. 9
Extended Data Fig. 9. Effects of perturbating pEtN levels on metabolome of senescent cells and upregulation of AKT activity in GK overexpressing cells.
A: Levels of the PCYT2 mRNAs normalized to those of RPS14 as measured by RT–qPCR in WI38 fibroblasts proliferating or infected with an adenovirus driving the expression of a control shRNA (shCtrl) or an shRNA targeting the PCYT2 mRNA (shPCYT2) for 7 days. The reported values are relative to those of proliferating cells. Bars represent the means of 3 biological replicates +/- s.d. Indicated p values were calculated using an unpaired two-sided Student’s t-test. B: Representative heat map using hierarchical clustering showing metabolites in WI38 fibroblasts proliferating (Prolif.) and shControl-(shCtrl) or shPCYT2-expressing WI38 fibroblasts at day 7. Data are expressed as row Z scores collected from three biologically independent experiments per condition. C: Representative heat map using hierarchical clustering showing metabolites in WI38 fibroblasts proliferating (Prolif.) or undergoing RAS-OIS and infected with GFP-PCYT2- or ETNPPL overexpressing adenoviruses for 7 days. Data are expressed as row Z scores collected from three biologically independent experiments per condition. D: Representative western blots showing the levels of the indicated proteins in WI38 fibroblasts proliferating or infected with GFP- or GK-overexpressing adenovirus for the indicated times. The experiment was repeated independently 3 times. Source data
Extended Data Fig. 10
Extended Data Fig. 10. GK upregulation in in-vivo models of senescence.
A: Levels of the indicated mRNAs normalized to those of Pinin as measured by RT–qPCR in mouse adipose tissue not expressing (PIK3CAWT) or expressing (PIK3CAAdipo-CreER) the constitutively active PI3KCA mutant. The reported values are relative to those of the PIK3CAWT genotype. Bars represent the means of n = 7 biological replicates (9 males and 5 females) +/- s.d. Indicated p values were calculated using an unpaired two-sided Student’s t-test. B: Left panel: Representative western blot showing the levels of the indicated proteins in mouse adipose tissue not expressing (PIK3CAWT) or expressing (PIK3CAAdipo-CreER) the constitutively active PI3KCA mutant. Right panel: Levels of the GK protein normalized to those of α-tubulin as measured on western blots on total protein extracts of mouse adipose tissue not expressing (PIK3CAWT) or expressing (PIK3CAAdipo-CreER) the constitutively active PI3KCA mutant. Values are normalized to those of the PIK3CAWT sample. Bars represent the means of 3 biological replicates +/- s.d (4 males and 2 females). Indicated p values were calculated using an unpaired two-sided Student’s t-test. C: Immunostaining with an anti-p21 and an anti-GK antibody on sections of the pancreas of WT mice (male) and of mice overexpressing in the pancreas the constitutively active G12D KRas-mutant (male). Asterisks indicate Langerhans islets. Scale bars represent 20 µm. The experiment was repeated independently twice with similar results. Source data

References

    1. Gorgoulis V, et al. Cellular senescence: defining a path forward. Cell. 2019;179:813–827. doi: 10.1016/j.cell.2019.10.005. - DOI - PubMed
    1. Wiley CD, Campisi J. The metabolic roots of senescence: mechanisms and opportunities for intervention. Nat. Metab. 2021;3:1290–1301. doi: 10.1038/s42255-021-00483-8. - DOI - PMC - PubMed
    1. Neurohr GE, et al. Excessive cell growth causes cytoplasm dilution and contributes to senescence. Cell. 2019;176:1083–1097. doi: 10.1016/j.cell.2019.01.018. - DOI - PMC - PubMed
    1. Dimri GP, et al. A biomarker that identifies senescent human cells in culture and in aging skin in vivo. PNAS. 1995;92:9363–9367. doi: 10.1073/pnas.92.20.9363. - DOI - PMC - PubMed
    1. Childs BG, et al. Senescent cells: an emerging target for diseases of ageing. Nat. Rev. Drug Discov. 2017;16:718–735. doi: 10.1038/nrd.2017.116. - DOI - PMC - PubMed