. 2024 Feb 26;14(1):4606.
doi: 10.1038/s41598-024-55359-0.

Visual salience is affected in participants with schizophrenia during free-viewing

Affiliations

Visual salience is affected in participants with schizophrenia during free-viewing

Masatoshi Yoshida et al. Sci Rep. .

Abstract

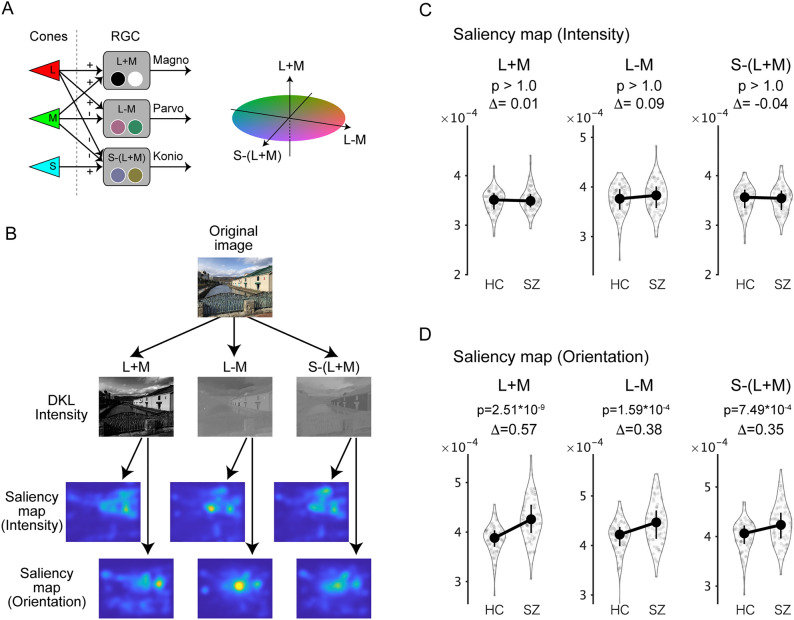
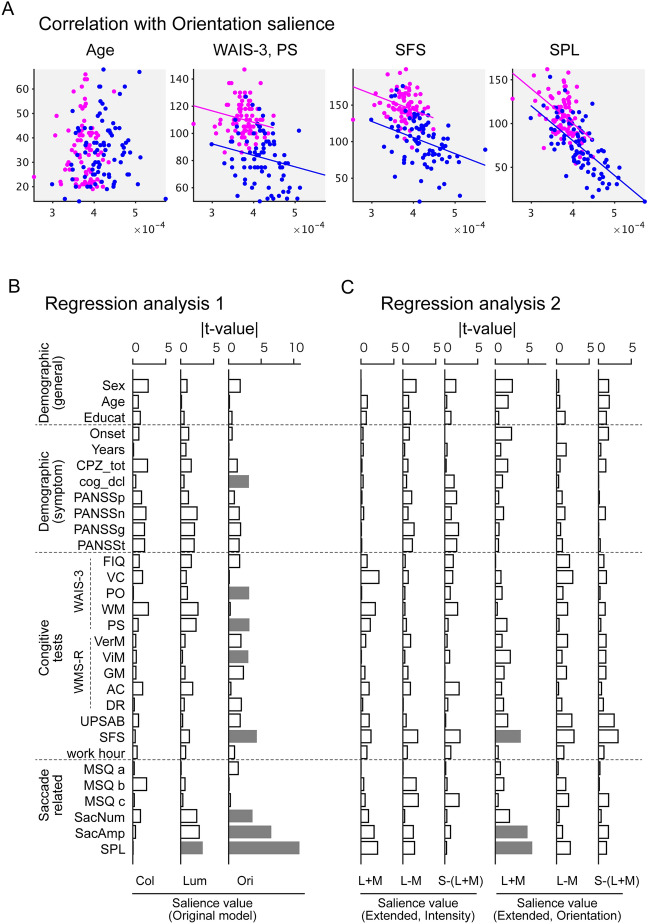
Abnormalities in visual exploration affect the daily lives of patients with schizophrenia. For example, scanpath length during free-viewing is shorter in schizophrenia. However, its origin and its relevance to symptoms are unknown. Here we investigate the possibility that abnormalities in eye movements result from abnormalities in visual or visuo-cognitive processing. More specifically, we examined whether such abnormalities reflect visual salience in schizophrenia. Eye movements of 82 patients and 252 healthy individuals viewing natural and/or complex images were examined using saliency maps for static images to determine the contributions of low-level visual features to salience-guided eye movements. The results showed that the mean value for orientation salience at the gazes of the participants with schizophrenia were higher than that of the healthy control subjects. Further analyses revealed that orientation salience defined by the L + M channel of the DKL color space is specifically affected in schizophrenia, suggesting abnormalities in the magnocellular visual pathway. By looking into the computational stages of the visual salience, we found that the difference between schizophrenia and healthy control emerges at the earlier stage, suggesting functional decline in early visual processing. These results suggest that visual salience is affected in schizophrenia, thereby expanding the concept of the aberrant salience hypothesis of psychosis to the visual domain.

Keywords: Aberrant salience hypothesis; Saccades; Salience.


Conflict of interest statement

The authors declare no competing interests.

Figures

Figure 1
Figure 1
The mean value of orientation salience at the gaze of participants with schizophrenia is higher than that of healthy control subjects. (A) The saliency map was calculated from the Itti–Koch model. Visual salience for low-level visual features (color, “Col”; luminance, “Lum”; orientation, “Ori”) was also computed in this model. (B) Gaze positions of two control subjects (left) and two SZs (right) represented by numbers and superimposed on the saliency map of test images. Numbers indicate saccade order. (C) The saliency values averaged across test images and participants are plotted across saccade numbers on a log scale. (C) As in (B), but for single feature salience models. Age-matched resampled data are plotted for healthy controls. Magenta, the healthy controls (HC; n = 252); blue, the participants with schizophrenia (SZ; n = 82). Numbers on the plots denote P values for the main effect of the participant group. (D) Mean saliency values for all images and saccades are plotted for the healthy controls (HC) and the schizophrenia group (SZ). Data from four salience models are plotted. Symbols denote median values. Error bars denote the first and the third quartile. Numbers on the plots denote P values (“p”) and the effect sizes (“Δ”, Cliff’s delta) of the Wilcoxon rank-sum test.
Figure 2
Figure 2
The L + M channel of the DKL color space is dominant in the effect of orientation salience. (A) The Derrington–Krauskopf–Lennie (DKL) color space. See “Results” and “Methods” for details. (B) To construct the extended six-channel model, the original image was decomposed into three channels in the DKL color space: the magnocellular L + M channel, the parvocellular L − M channel, and the koniocellular S-(L + M) channel. Then saliency maps for intensity and orientation were obtained for each of the three channels (six maps in total). (C,D) As in Fig. 1D, the salience values averaged across test images and saccades were plotted, but for six saliency maps. Symbols are the same as in Fig. 1D.
Figure 3
Figure 3
The key computational stage that produces differences in orientation salience is Gabor filtering. (A) The Itti–Koch saliency model computes the saliency map of the orientation feature through five stages (Fig. S1). The map values were calculated for these intermediate images are plotted as in Fig. 1C. (B) Effect sizes (Cliff’s delta) for the tests in (A). Numbers indicate the spatial scales of the Gaussian pyramids. In the three plots in the center, the mean effect size for four orientations (bar), as well as the effect size for four orientations (symbols) were plotted. “o,” 0°; “x,” 45°; triangle, 90°, and square, 135°. The horizontal lines in the rightmost plot (“Saliency map (Orientation)”) indicate the common guidelines for the effect size (Cliff’s delta). See “Methods” for details.
Figure 4
Figure 4
Orientation salience is correlated with the scores of cognitive tests and visual oculomotor characteristics. (A) Scattered plots for the mean orientation salience (averaged across images and saccades) and age, WAIS-3 processing speed (PS), social functioning scale (SFS), and scanpath length (SPL). Each dot represents the value for one participant. Magenta: healthy controls (HC); blue, participants with schizophrenia (SZ). Lines indicate regression lines for each participant group. (B) Absolute value of t-values from regression analysis 1, where the dependent variables were fitted individually with the saliency values of the original model. Gray bars indicate statistical significance (P < 0.05) after correction of multiple comparisons by FDR. (C) As in (B), but those from regression analysis 2, where the dependent variables were fitted individually with the saliency values of the extended six-channel model.

Similar articles

Cited by

References

    1. Onitsuka T, et al. Trends in big data analyses by multicenter collaborative translational research in psychiatry. Psychiatry Clin. Neurosci. 2022;76:1–14. doi: 10.1111/pcn.13311. - DOI - PMC - PubMed
    1. Morita K, Miura K, Kasai K, Hashimoto R. Eye movement characteristics in schizophrenia: A recent update with clinical implications. Neuropsychopharmacol. Rep. 2020;40:2–9. doi: 10.1002/npr2.12087. - DOI - PMC - PubMed
    1. Wolf A, Ueda K, Hirano Y. Recent updates of eye movement abnormalities in patients with schizophrenia: A scoping review. Psychiatry Clin. Neurosci. 2021;75:82–100. doi: 10.1111/pcn.13188. - DOI - PMC - PubMed
    1. Sprenger A, et al. Advanced analysis of free visual exploration patterns in schizophrenia. Front. Psychol. 2013;4:1–10. doi: 10.3389/fpsyg.2013.00737. - DOI - PMC - PubMed
    1. Benson PJ, et al. Simple viewing tests can detect eye movement abnormalities that distinguish schizophrenia cases from controls with exceptional accuracy. Biol. Psychiatry. 2012;72:716–724. doi: 10.1016/j.biopsych.2012.04.019. - DOI - PubMed