Is high salt intake inducing obesity via production of cortisol? A novel working hypothesis and pilot study
- PMID: 38409436
- PMCID: PMC11139711
- DOI: 10.1007/s00394-024-03354-6
Is high salt intake inducing obesity via production of cortisol? A novel working hypothesis and pilot study
Abstract
Purpose: Evidence is growing that high salt intake is an independent risk factor for obesity, but the mechanisms are unknown. Our novel working hypothesis is that high salt intake drives cortisol production, which in turn, drives obesity. The current study aimed to demonstrate an acute cortisol response following a single high salt meal.
Methods: Eight participants (age 30.5 ± 9.8 years [mean ± SD], 50% female), consumed high salt (3.82 g; 1529 mg sodium) and low salt (0.02 g; 9 mg sodium) meals in a randomized cross-over design.
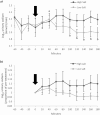
Results: Urinary and salivary cortisol and plasma adrenocorticotropic hormone (ACTH) demonstrated order effects. When high salt was given second, there was a peak above baseline for urinary cortisol (26.3%), salivary cortisol (9.4%) and plasma ACTH (4.1%) followed by a significant decline in each hormone (treatment*time, F[9, 18] = 2.641, p = 0.038, partial η2 = 0.569; treatment*time, F[12, 24] = 2.668, p = 0.020, partial η2 = 0.572; treatment*time, F[12, 24] = 2.580, p = 0.023, partial η2 = 0.563, respectively), but not when high salt was given first (p > 0.05 for all).
Conclusion: These intriguing findings provide partial support for our hypothesis and support a need for further research to elucidate the role of high salt intake in cortisol production and, in turn, in the aetiology of obesity.
Trial registration number: ACTRN12623000490673; date of registration 12/05/2023; retrospectively registered.
Keywords: ACTH; Cortisol; Obesity; Salt; Salt intake; Sodium.
© 2024. The Author(s).
Conflict of interest statement
The authors declare that they have no conflict of interest.
Figures


Similar articles
-
A study on the early metabolic effects of salt and fructose consumption: the protective role of water.Hypertens Res. 2024 Jul;47(7):1797-1810. doi: 10.1038/s41440-024-01686-8. Epub 2024 May 15. Hypertens Res. 2024. PMID: 38750219 Free PMC article.
-
Comment: response of the hypothalamic-pituitary-adrenocortical axis to high-protein/fat and high-carbohydrate meals in women with different obesity phenotypes.J Clin Endocrinol Metab. 2002 Aug;87(8):3984-8. doi: 10.1210/jcem.87.8.8718. J Clin Endocrinol Metab. 2002. PMID: 12161547 Clinical Trial.
-
Assessment of cortisol and ACTH responses to the desmopressin test in patients with Cushing's syndrome and simple obesity.Clin Endocrinol (Oxf). 1999 Oct;51(4):473-7. doi: 10.1046/j.1365-2265.1999.00830.x. Clin Endocrinol (Oxf). 1999. PMID: 10583315
-
The effects of the acute administration of RU 486 on dietary fat preference in fasted lean and obese men.Physiol Behav. 1993 Oct;54(4):717-24. doi: 10.1016/0031-9384(93)90082-q. Physiol Behav. 1993. PMID: 8248349 Clinical Trial.
-
Modeling neuroendocrine stress reactivity in salivary cortisol: adjusting for peak latency variability.Stress. 2014 Jul;17(4):285-95. doi: 10.3109/10253890.2014.915517. Epub 2014 May 8. Stress. 2014. PMID: 24754834
Cited by
-
Association between Urinary Sodium Excretion and Body Fat in School-Aged Children: Insights from the ARIA Study.Nutrients. 2024 Apr 17;16(8):1197. doi: 10.3390/nu16081197. Nutrients. 2024. PMID: 38674887 Free PMC article.
References
-
- WHO . Guideline: sodium intake for adults and children. Geneva: World Health Organization WHO; 2012. - PubMed
-
- Powles J, Fahimi S, Micha R, Khatibzadeh S, Shi PL, Ezzati M, Engell RE, Lim SS, Danaei G, Mozaffarian D, Global Burden Dis Nutr Chronic D Global, regional and national sodium intakes in 1990 and 2010: a systematic analysis of 24 h urinary sodium excretion and dietary surveys worldwide. BMJ Open. 2013;3(12):18. doi: 10.1136/bmjopen-2013-003733. - DOI - PMC - PubMed
Publication types
MeSH terms
Substances
Associated data
Grants and funding
LinkOut - more resources
Full Text Sources
Medical

