

Prediction of heavy-section ductile iron fracture toughness based on machine learning
- PMID: 38409441
- PMCID: PMC10897301
- DOI: 10.1038/s41598-024-55089-3
Prediction of heavy-section ductile iron fracture toughness based on machine learning
Abstract
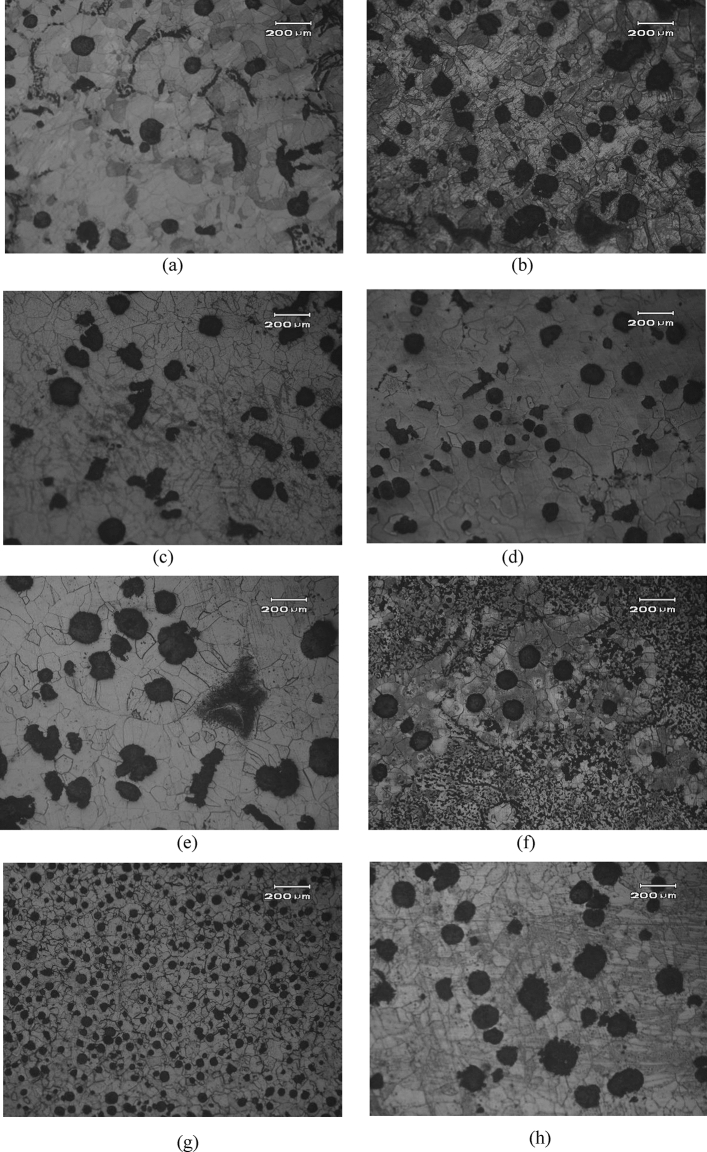
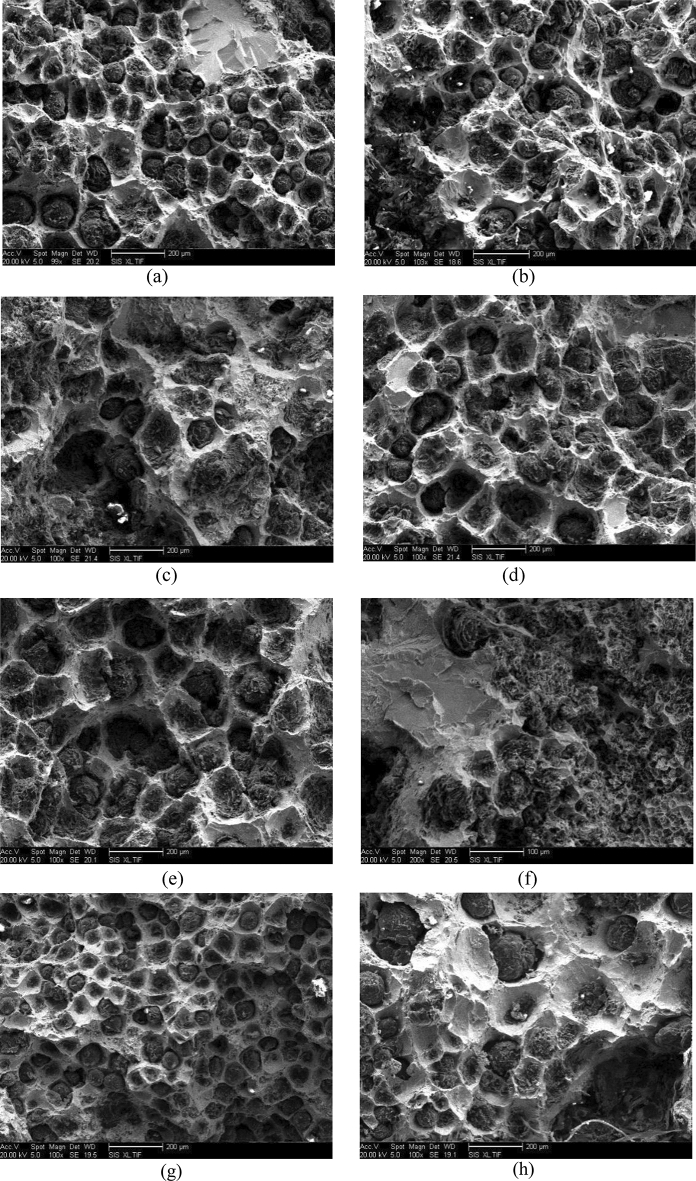
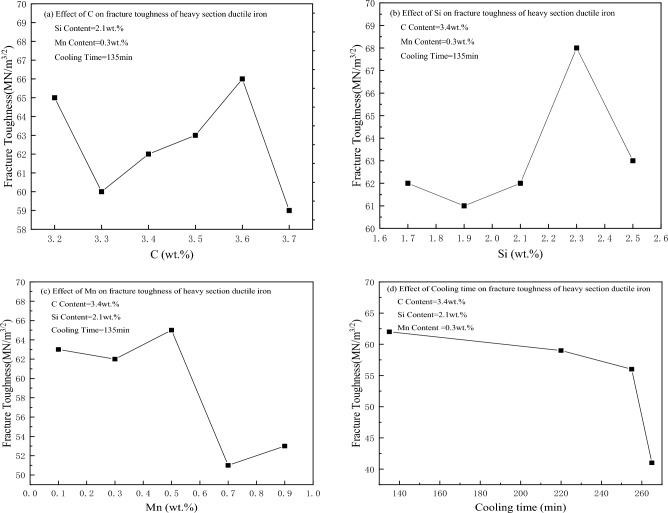
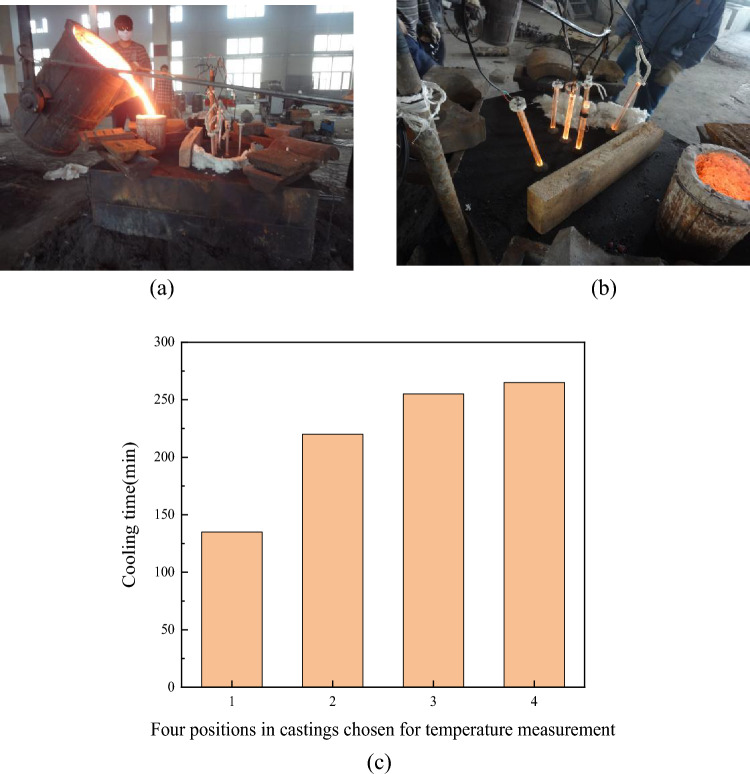
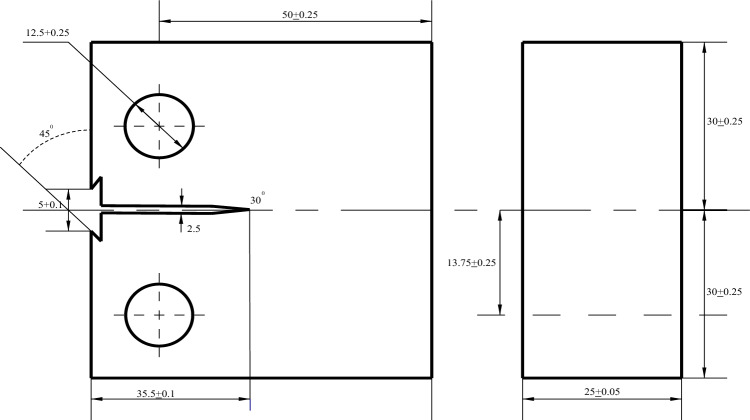
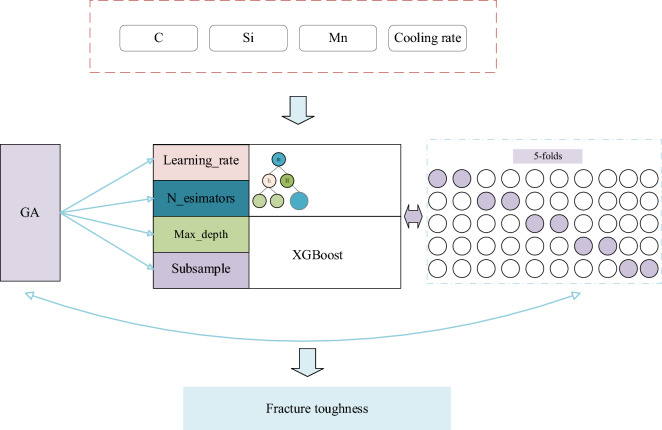
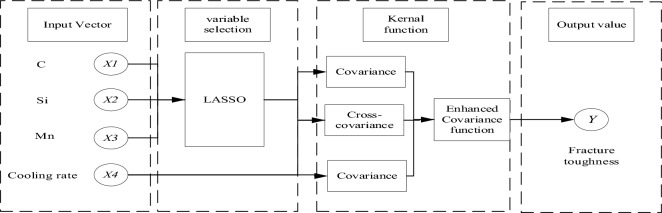
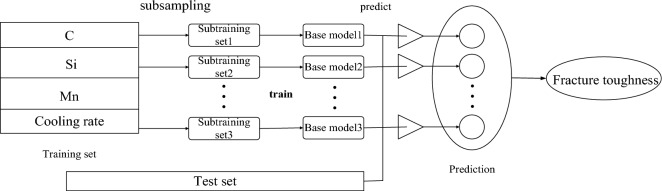
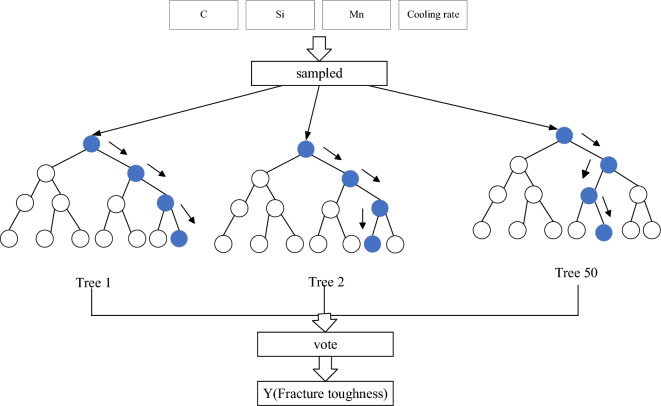
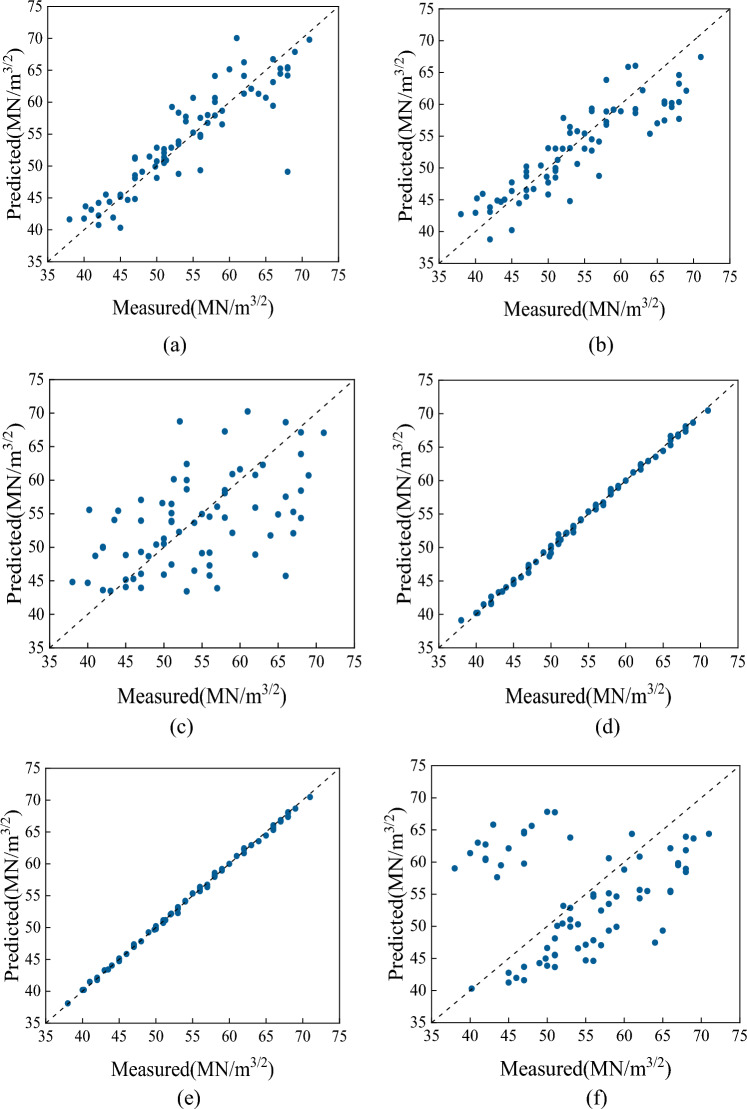
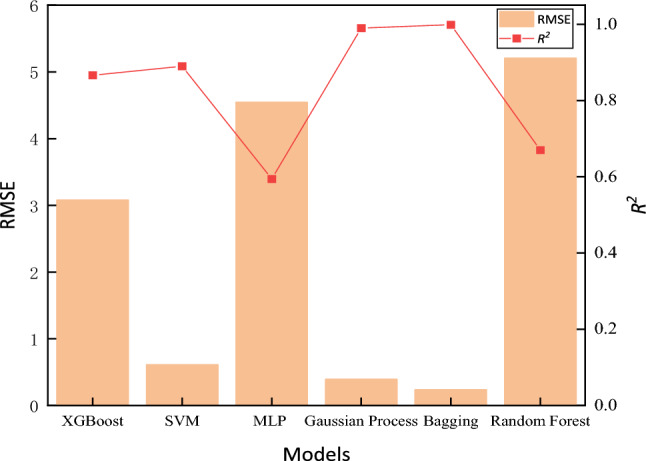
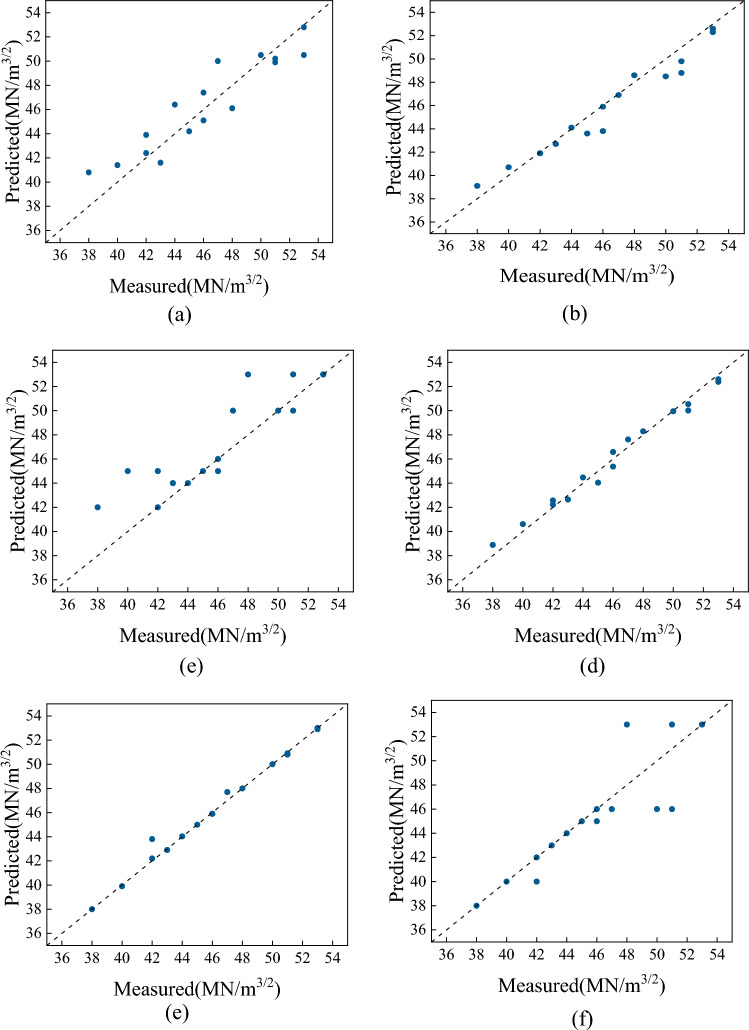
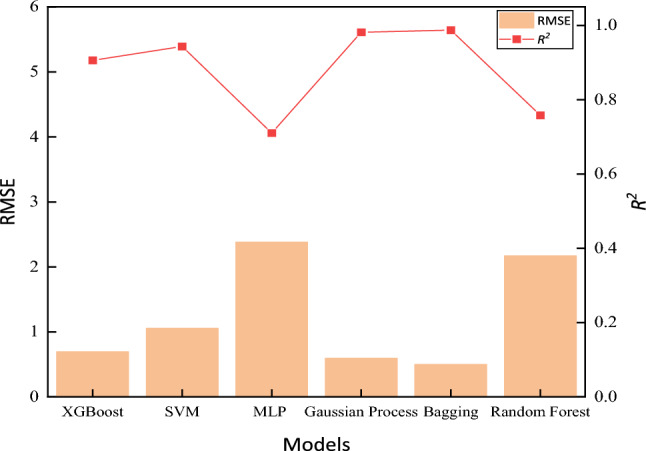
The preparation process and composition design of heavy-section ductile iron are the key factors affecting its fracture toughness. These factors are challenging to address due to the long casting cycle, high cost and complex influencing factors of this type of iron. In this paper, 18 cubic physical simulation test blocks with 400 mm wall thickness were prepared by adjusting the C, Si and Mn contents in heavy-section ductile iron using a homemade physical simulation casting system. Four locations with different cooling rates were selected for each specimen, and 72 specimens with different compositions and cooling times of the heavy-section ductile iron were prepared. Six machine learning-based heavy-section ductile iron fracture toughness predictive models were constructed based on measured data with the C content, Si content, Mn content and cooling rate as input data and the fracture toughness as the output data. The experimental results showed that the constructed bagging model has high accuracy in predicting the fracture toughness of heavy-section ductile iron, with a coefficient of coefficient (R2) of 0.9990 and a root mean square error (RMSE) of 0.2373.
© 2024. The Author(s).
Conflict of interest statement
The authors declare no competing interests.
Figures


References
-
- Padmakumar M, Arunachalam M. Analyzing the effect of cutting parameters and tool nose radius on forces, machining power and tool life in face milling of ductile iron and validation using finite element analysis. Eng. Res. Express. 2020;2:1–13.
-
- Yang PH, Fu HG, Lin J, et al. Experimental and ab initio study of the influence of a compound modifier on carbidic ductile iron. Metall. Res. Technol. 2019;116:306–311.
-
- Cheng HQ, Fu HG, Lin J, et al. Effect of Cr content on microstructure and mechanical properties of carbidic austempered ductile iron. Mater. Test. 2018;60:31–39.
-
- Chiniforush EA, Yazdani S, Nadiran V. The influence of chill thickness and austempering temperature on dry sliding wear behaviour of a Cu–Ni carbidic austempered ductile iron (CADI) Kovove Mater. 2018;56:213–221.
-
- Kusumoto K, Shimizu K, Yae X, et al. Abrasive wear characteristics of Fe–2C–5Cr–5Mo–5W–5Nb multicomponent white castiron. Wear. 2017;3:22–29.
Grants and funding
- SCHYZSB-2023-07/the Key Laboratory of Mechnical Structure Optimization & Material Application Technology of Luzhou
- 51174068/National Nature Science Fund Project
- 2023JH2/Liaoning Provincial Research Foundation for Basic Research of China
- 04442023128/the Fundamental Research Funds for the Central Universities
LinkOut - more resources
Full Text Sources
