. 2024 Apr;16(4):966-987.
doi: 10.1038/s44321-024-00043-z. Epub 2024 Feb 26.

B cell lineage reconstitution underlies CAR-T cell therapeutic efficacy in patients with refractory myasthenia gravis

Affiliations

B cell lineage reconstitution underlies CAR-T cell therapeutic efficacy in patients with refractory myasthenia gravis

Dai-Shi Tian et al. EMBO Mol Med. 2024 Apr.

Abstract

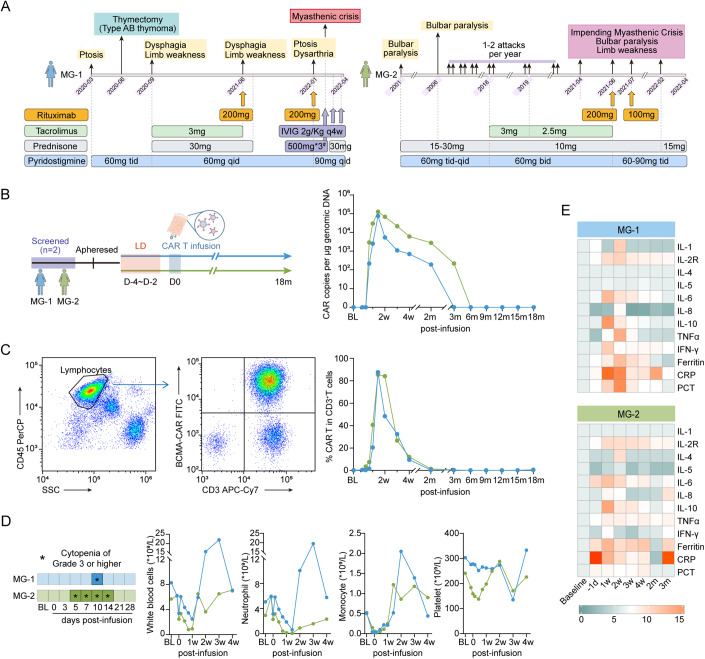
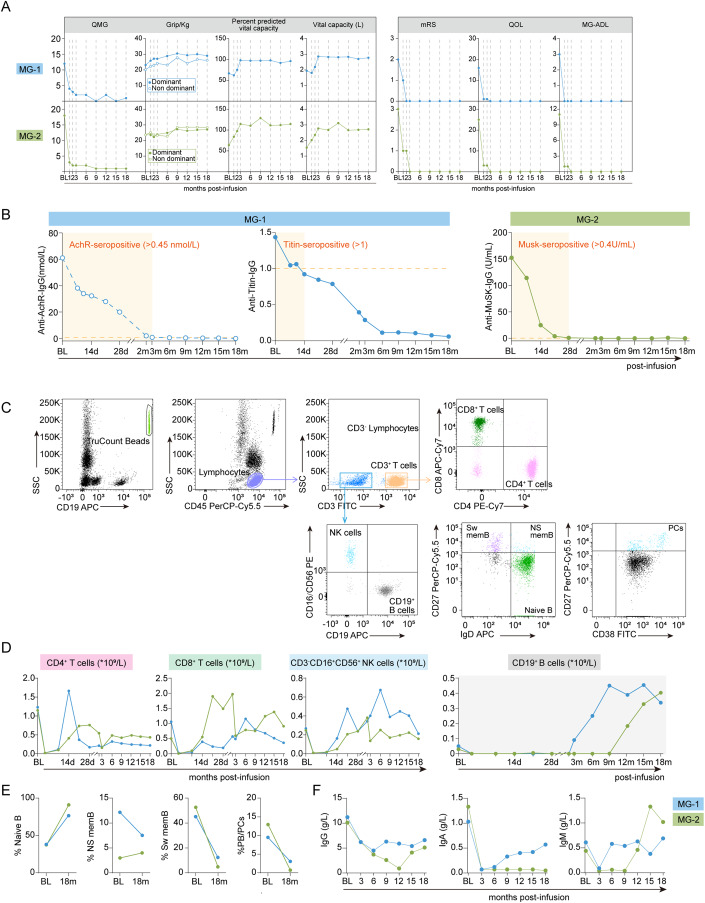
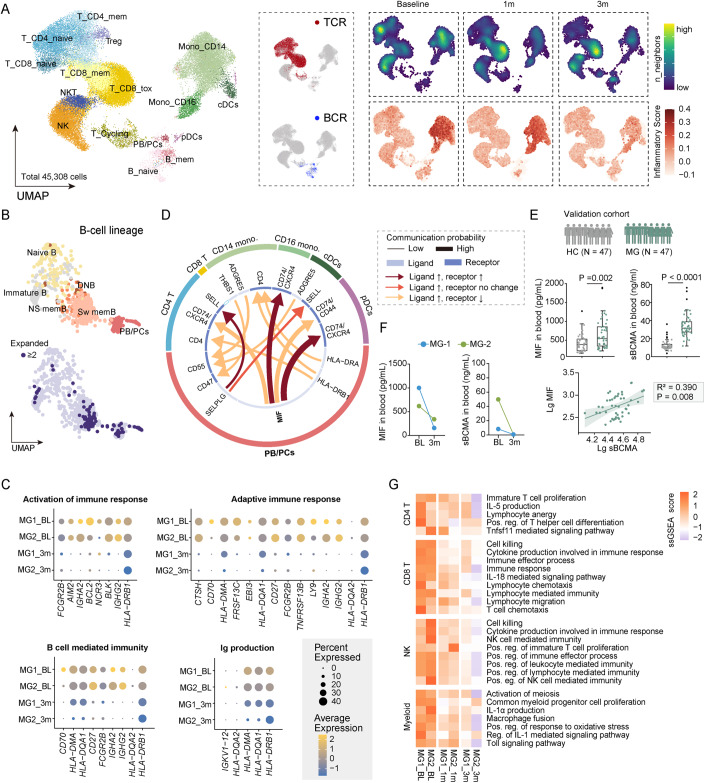
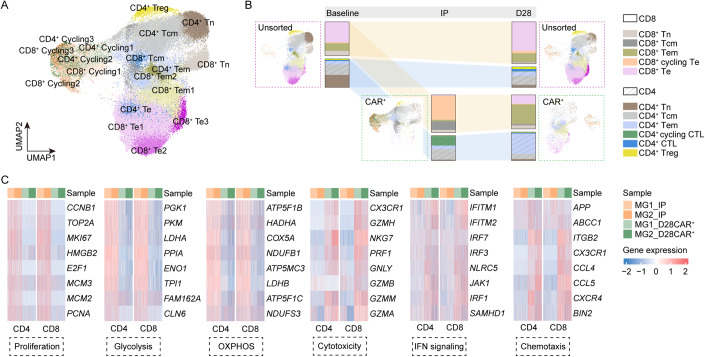
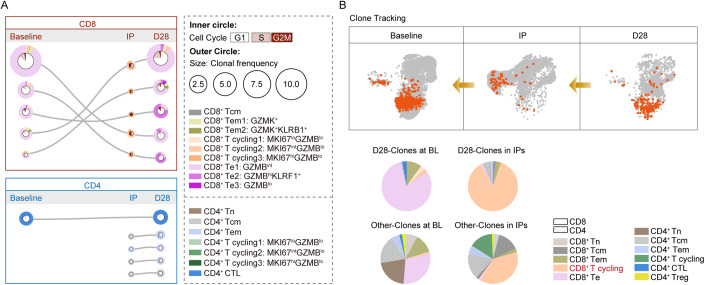
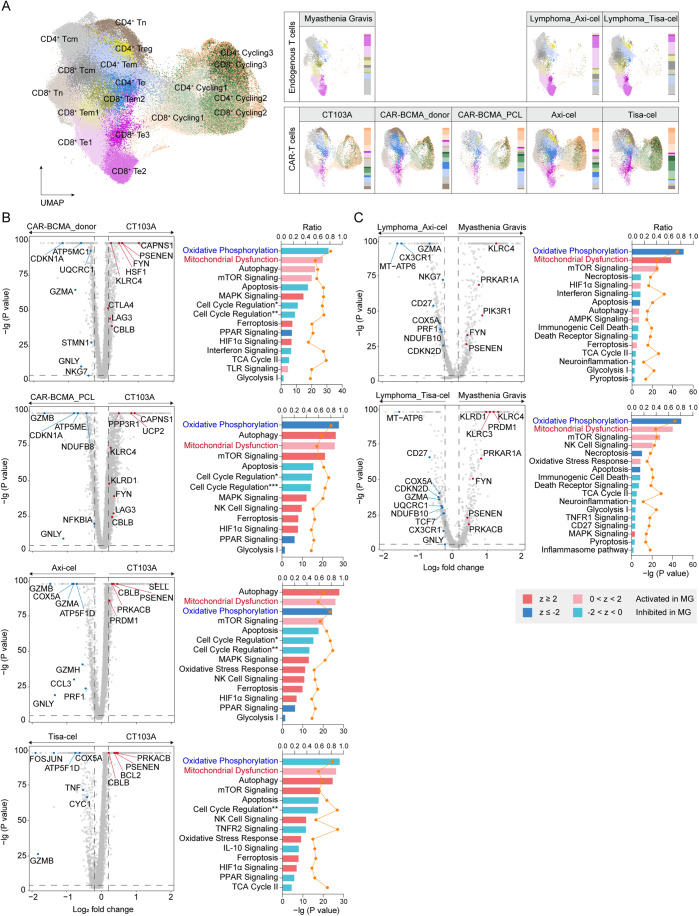
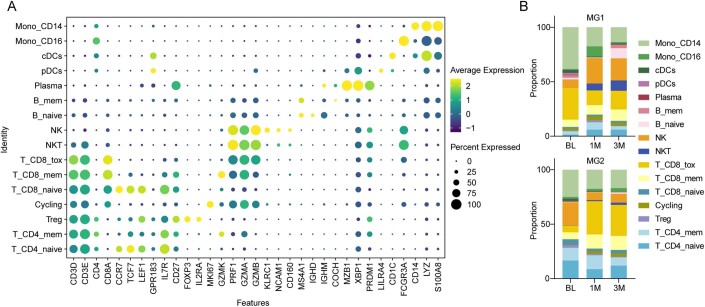
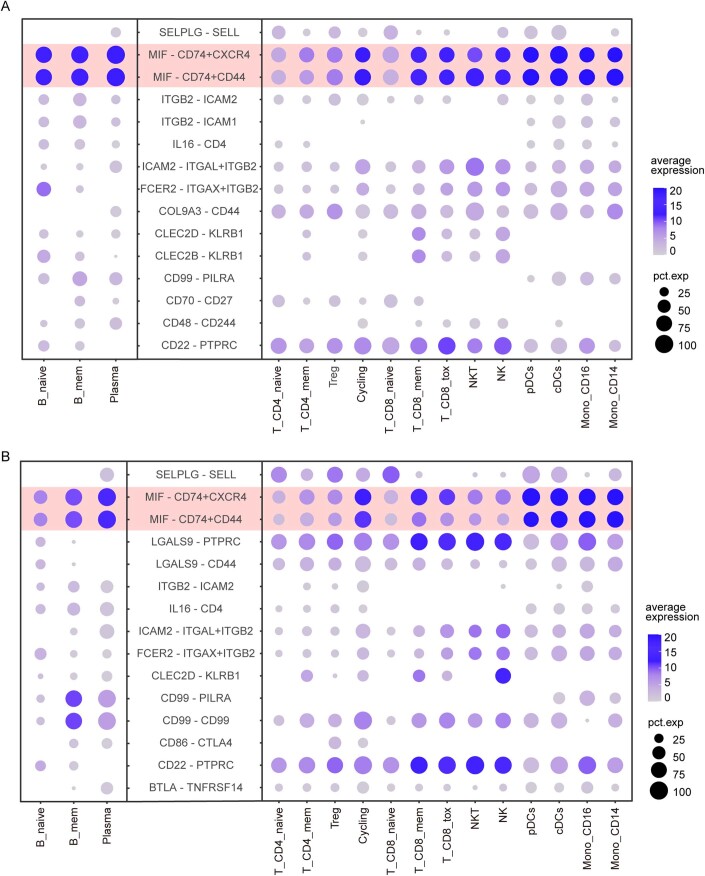
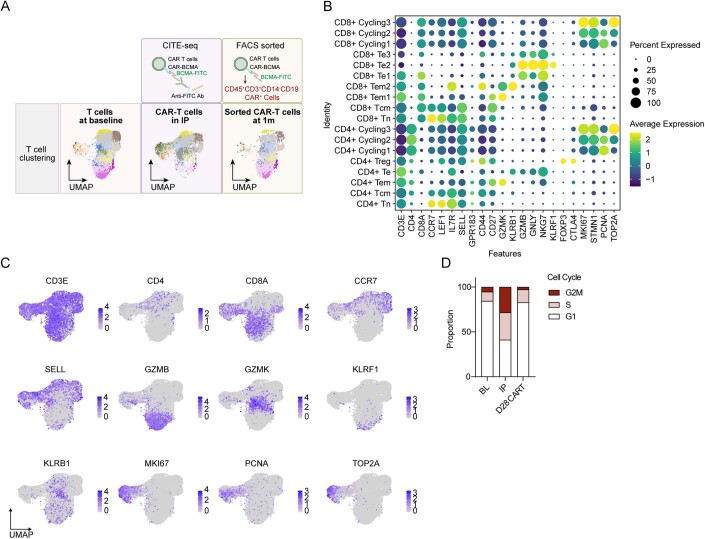
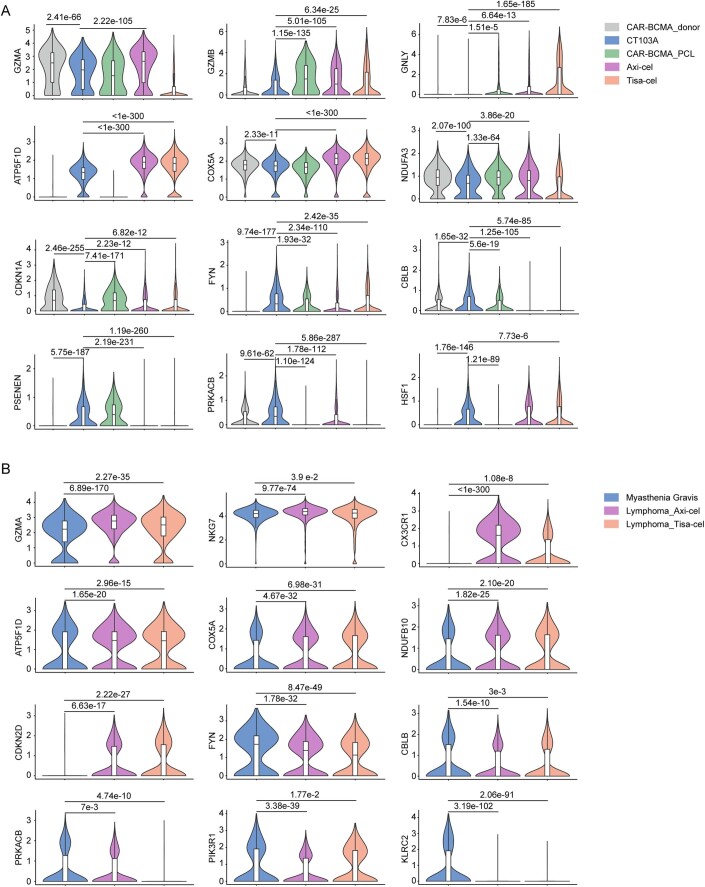
B-cell maturation antigen (BCMA), expressed in plasmablasts and plasma cells, could serve as a promising therapeutic target for autoimmune diseases. We reported here chimeric antigen receptor (CAR) T cells targeting BCMA in two patients with highly relapsed and refractory myasthenia gravis (one with AChR-IgG, and one with MuSk-IgG). Both patients exhibited favorable safety profiles and persistent clinical improvements over 18 months. Reconstitution of B-cell lineages with sustained reduced pathogenic autoantibodies might underlie the therapeutic efficacy. To identify the possible mechanisms underlying the therapeutic efficacy of CAR-T cells in these patients, longitudinal single-cell RNA and TCR sequencing was conducted on serial blood samples post infusion as well as their matching infusion products. By tracking the temporal evolution of CAR-T phenotypes, we demonstrated that proliferating cytotoxic-like CD8 clones were the main effectors in autoimmunity, whereas compromised cytotoxic and proliferation signature and profound mitochondrial dysfunction in CD8+ Te cells before infusion and subsequently defect CAR-T cells after manufacture might explain their characteristics in these patients. Our findings may guide future studies to improve CAR T-cell immunotherapy in autoimmune diseases.

Keywords: B Cell Maturation Antigen; Chimeric Antigen Receptor (CAR) T-cell Immunotherapy; Refractory Myasthenia Gravis; Single-Cell RNA Sequencing.


Conflict of interest statement

Wen Wang and Song-Bai Cai are employees of Nanjing IASO Biotechnology Co., Ltd and held interests in the company. Wen Wang is among the inventors of patent applications related to the CT103A. The remaining authors declare no competing interests.

Figures

Figure 1
Figure 1. CAR T-cell kinetics and inflammatory mediators release following infusion.
(A) A schematic overview of the time points at which patients receive different treatments before CAR-T infusion. #Patient MG-1 was treated with IVIG 2 g/Kg + intravenous pulse steroid 500 mg* 3days for myasthenia crisis. (B) A schematic overview of CAR-T treatment procedure. CAR T-cell kinetics are shown by the CAR copies per μg genomic DNA at serial time points post infusion detected by droplet digital PCR. (C) Representative plots showing FACS analysis stained for CAR-T cells with FITC-labeled human BCMA Fc tag protein and APC/Cy7 anti-human CD3 antibody in patient MG-1 at day 10 after CAR T-cell infusion. CAR T-cell percentage in circulating CD3+ T lymphocytes at serial time points after treatment. (D) Timelines of patients with cytopenia of grade 3 or higher at baseline and indicated time points after CAR T-cell infusion. BL baseline. Kinetic changes in numbers of circulating total white blood cells, neutrophils, monocytes and platelets. (E) Heatmap depicting protein levels of inflammatory mediators in blood following CAR T-cell infusion. Interleukin IL, TNF tumor necrosis factor, IFN interferon, CRP C-reactive protein, PCT procalcitonin. Average levels are normalized from the baseline. Source data are available online for this figure.
Figure 2
Figure 2. Clinical evaluation following CAR T-cell infusion.
(A) Kinetic parameters of Patient MG-1 and MG-2, including QMG score, grip strength, vital capacity volume and percent predicted vital capacity, mRS score, the MG-QOL15 questionnaire, and MG-ADL scale score. (B) Pathogenic antibodies levels in serum (anti-AChR-IgG and anti-Titin-IgG for MG-1, anti-MuSK-IgG for MG-2). (C) Representative images showing the gating strategies for lymphocyte subset analysis using TruCOUNT beads, and B-cell lineages stained for CD19+ CD27- IgD+ naive B cells, CD19+ CD27+ IgD+ non-switched memory B cells (NS mem), and CD19+ CD27+ IgD- switched memory B cells (Sw mem) and CD19+CD27+CD38high plasma cells (PCs). (D) Kinetic changes in numbers of CD4+ T cells, CD8+ T cells, CD3-CD16+CD56+ NK cells, and CD19+ B cells at baseline and at indicated time points after CAR T-cell infusion. (E) Changes in the percentage of naive B cells, non-switched memory B cells, switched memory B cells and plasma cells between baseline and 18-month post infusion. (F) Changes in total immunoglobulin levels (IgG, IgA, and IgM) before CAR T-cell therapy and at 18-month post infusion. Source data are available online for this figure.
Figure 3
Figure 3. Immune alterations following CAR T-cell therapy.
(A) Uniform manifold approximation and projection (UMAP) plot of 45,308 single-cell transcriptomes of peripheral blood mononuclear cells integrated from the two patients at baseline, at 1 month and at 3 months post infusion. Clusters denoted by color are labeled with inferred cell types, including three CD4+ T-cell clusters, three CD8+ T-cell clusters, cycling T cells (T_Cycling), NK cells, NKT cells, two monocyte clusters, conventional dendritic cells (cDCs), plasmacytoid dendritic cells (pDCs), and three B-cell clusters. UMAP of cells colored by BCR and TCR detection. Feature plots colored by cell density (top) and a signature score of inflammation for each cell based on the expression of inflammatory response genes (bottom). (B) UMAP plots showing re-clustering of B cells colored by six subsets, annotated as immature, naive, non-switched memory (NS mem), switched memory (Sw mem), double negative (DN) B cells, and plasmablasts and plasma cells (PB/PCs), and colored by clone size. (C) Mean expression of differentially expressed genes between baseline and 3-month post infusion, enriched in activation of immune response, adaptive immune response, B-cell-mediated immunity, and Ig production. (D) Circos plot showing the ligand-upregulated interactions mediated by ligand-receptor pairs between PB/PCs and other immune cells. The outer ring displays color-coded cell types, and the inner ring represents the involved ligand-receptor interacting pairs. The line width is proportional to the communication probability in MG comparing to control group. Colors and types of lines are used to indicate different types of interactions as shown in the box. DC dendritic cells, Mono monocytes. (E) A schematic overview of the validation cohort of MG patients. HC, N = 47; MG, N = 47. Boxes denote the interquartile range (IQR), and the median is shown as horizontal bars. Whiskers extend to 1.5 times the IQR, and outliers are shown as individual black dots. Group comparisons were computed with a two-sided Wilcoxon rank-sum test with a Benjamini–Hochberg correction. Scatter plots depicting the correlations between sBCMA (lg) and MIF (lg). Biomarker values were log10-transformed to reduce skewness. The solid lines indicate the regression line and the 95% confidence intervals. The correlation coefficients and P values from the partial correlation analysis are shown. (F) Scatter plots depicting serum levels of sBCMA and MIF quantified by ELISA in the patients at baseline and 3 months post infusion. (G) Heatmap showing single-sample GSEA scores of indicated signatures in CD4+ T cells, CD8+ T cells, NK cells, and myeloid cells of patients at baseline and at 3-month post infusion. Source data are available online for this figure.
Figure 4
Figure 4. Transcriptional signature of CAR-T cells in MG.
(A) UMAP plot of CAR-T cells in IPs and at 1 month post infusion, and endogenous T cells at baseline and at 1 month post infusion. (B) Depiction of T-cell subset frequencies at each timepoint. Bar widths are proportional to the fraction of cells being classified as a particular subset. (C) Expression of differentially expressed genes indicating lower proliferation, glycolysis, OXPHOS, and higher cytotoxicity, IFN signaling, chemotaxis of CAR-T cells collected at 1 month compared with CAR-T cells in IP. Source data are available online for this figure.
Figure 5
Figure 5. Clone tracking of CAR-T cells in MG.
(A) The top 5 most prevalent TCR clones identified at 1 month post treatment and the corresponding clones in IPs or at baseline are shown for CD8+ and CD4+ CAR-T subsets. For each, circles show the clone belongs at each timepoint, with sizes corresponding to the clone frequency in its sample. Pie charts of the inner circle showing the distribution of cells in each phase of the cell cycle. Pie charts of the outer circle showing the distribution of cells in each subset. (B) UMAP plots and pie charts showing the distribution of cells in patients at baseline and CAR-T cells in IPs that finally exist in vivo at 1 month post infusion, by clone tracking. Source data are available online for this figure.
Figure 6
Figure 6. Distinct signatures of CAR-T cells from patients with MG.
(A) UMAP plots showing the integrating endogenous T cells and CAR-T cells colored by subclusters. Single-cell transcriptomics in three recently published external datasets (GSE197851, GSE151310, GSE197268), including (1) CAR-BCMA T cells in IPs from three healthy donors, (2) CAR-BCMA T cells in IPs from 1 patient with plasma cell leukemia, (3) T cells in 12 individual blood samples at baseline and CAR-CD19 T cells in 18 IPs from lymphoma patients treated with Axi-cel, and T cells in 8 blood samples and CAR-CD19 T cells in 13 IPs from lymphoma patients treated with Tisa-cel, along with our dataset including T cells at baseline and CAR- T cells in IPs (CT103A) from the two patients with MG, were used for signature validation. (B) Comparison of differentially expressed genes between CAR+ CD8+ cycling Te cells in the IPs from patients with MG and other IPs. CT103A, N = 4044 cells; CAR-BCMA_donor, N = 4739 cells; CAR-BCMA_PCL, N = 2111 cells; Axi-cel, N = 11,392 cells; Tisa-cel, N = 16,348 cells. Group comparisons were computed with a Wilcoxon rank-sum test with a Bonferroni correction. Ingenuity Pathway Analysis (IPA) was performed showing corresponding signaling pathways regulated by these DEGs. z score reflects the predicted activation level (z ≥ 2 or z ≤−2 can be considered significant). The yellow curve denotes the ratio between the number of the DEGs and the total number of genes in each of these pathways. Cell Cycle Regulation*, Cell Cycle: G1/S Checkpoint Regulation; Cell Cycle Regulation**, Cell Cycle: G2/M DNA Damage Checkpoint Regulation; Cell Cycle Regulation***, Cyclins and Cell Cycle Regulation. (C) Volcano plot showing comparison of differentially expressed genes between endogenous Te cells from the MG patients at baseline and Te cells from other groups. Myasthenia Gravis, N = 2898 cells; Lymphoma_Axi-cel, N = 7123 cells; Lymphoma_Tisa-cel, N = 4857 cells. Group comparisons were computed with a Wilcoxon rank-sum test with a Bonferroni correction. Ingenuity Pathway Analysis (IPA) was performed showing corresponding signaling pathways regulated by these DEGs. z score reflects the predicted activation level (z ≥ 2 or z ≤−2 can be considered significant). The yellow curve denotes the ratio between the number of the DEGs and the total number of genes in each of these pathways. Source data are available online for this figure.
Figure EV1
Figure EV1. Additional single-cell transcriptional features of patients with myasthenia gravis treated with CAR-BCMA T-cell therapy.
(A) Dot plot showing cell clusters denoted by gene expression of known markers. (B) Bar plots showing the frequency of cell subsets in individual patient at indicated time points.
Figure EV2
Figure EV2. Additional ligand-receptor interaction analysis between immune cells.
Gene expression dot plot of ligand-receptor expression. Left, expression in B-cell subsets; right, expression in other immune cell types. Shown are the Top15 interactions between B-cell subsets and other immune cell types with communication probabilities in (A) MG-1, (B) MG-2 at baseline.
Figure EV3
Figure EV3. Expression of canonical markers identifies behavior of CAR-T cells in patients with myasthenia gravis.
(A) Schematic illustration of cellular indexing of transcriptomes and epitopes by sequencing (CITE-seq) strategy used to detect the CAR on the T-cell surface, and flow cytometry to sort CAR-T cells in vivo at 1 month post infusion (see “Methods” for details). UMAP plots of T cells colored by different cell cluster and clone size. (B) Dot plots showing gene expression of known markers for T-cell and CAR T-cell subclusters. (C) UMAP plots indicating RNA expression of CD3E, CD4, CD8A, CCR7, SELL, GZMB, GZMK, KLRF1, KLRB1, TOP2A, MKI67, and PCNA. (D) Bar plots showing the frequency of cells in S phase or G2/M phase by cell cycle scoring (see “Methods” for details).
Figure EV4
Figure EV4. Expression of indicated genes identifies characteristics of CD8 + Te cells (Baseline) and CD8+ cycling CAR-T cells (IP) in patients with myasthenia gravis.
(A) Violin plots illustrating indicated genes in Fig. 5B, and representing the distribution of expression across each product. CT103A, N = 4044 cells; CAR-BCMA_donor, N = 4739 cells; CAR-BCMA_PCL, N = 2111 cells; Axi-cel, N = 11,392 cells; Tisa-cel, N = 16,348 cells. Boxes show median, Q1 and Q3 quartiles and whiskers up to 1.5× interquartile range. Pairwise comparisons were performed using a two-sided Wilcoxon rank-sum test with a Bonferroni correction. (B) Violin plots illustrating indicated genes in Fig. 5C, and representing the distribution of expression across each cohort. Myasthenia Gravis, N = 2898 cells; Lymphoma_Axi-cel, N = 7123 cells; Lymphoma_Tisa-cel, N = 4857 cells. Boxes show median, Q1 and Q3 quartiles and whiskers up to 1.5× interquartile range. Pairwise comparisons were performed using a two-sided Wilcoxon rank-sum test with a Bonferroni correction.

References

    1. Barohn RJ, McIntire D, Herbelin L, Wolfe GI, Nations S, Bryan WW. Reliability testing of the quantitative myasthenia gravis score. Ann N Y Acad Sci. 1998;841:769–772. doi: 10.1111/j.1749-6632.1998.tb11015.x. - DOI - PubMed
    1. Benjamin R, Graham C, Yallop D, Jozwik A, Mirci-Danicar OC, Lucchini G, Pinner D, Jain N, Kantarjian H, Boissel N, et al. Genome-edited, donor-derived allogeneic anti-CD19 chimeric antigen receptor T cells in paediatric and adult B-cell acute lymphoblastic leukaemia: results of two phase 1 studies. Lancet. 2020;396:1885–1894. doi: 10.1016/S0140-6736(20)32334-5. - DOI - PMC - PubMed
    1. Burns TM, Grouse CK, Conaway MR, Sanders DB, mg c, mg-qol15 study g Construct and concurrent validation of the MG-QOL15 in the practice setting. Muscle Nerve. 2010;41:219–226. doi: 10.1002/mus.21609. - DOI - PubMed
    1. Colliou N, Picard D, Caillot F, Calbo S, Le Corre S, Lim A, Lemercier B, Le Mauff B, Maho-Vaillant M, Jacquot S, et al. Long-term remissions of severe pemphigus after rituximab therapy are associated with prolonged failure of desmoglein B cell response. Sci Transl Med. 2013;5:175ra130. doi: 10.1126/scitranslmed.3005166. - DOI - PubMed
    1. Deng Q, Han G, Puebla-Osorio N, Ma MCJ, Strati P, Chasen B, Dai E, Dang M, Jain N, Yang H, et al. Characteristics of anti-CD19 CAR T cell infusion products associated with efficacy and toxicity in patients with large B cell lymphomas. Nat Med. 2020;26:1878–1887. doi: 10.1038/s41591-020-1061-7. - DOI - PMC - PubMed