

Choroid plexus volume in multiple sclerosis can be estimated on structural MRI avoiding contrast injection
- PMID: 38409562
- PMCID: PMC10897123
- DOI: 10.1186/s41747-024-00421-9
Choroid plexus volume in multiple sclerosis can be estimated on structural MRI avoiding contrast injection
Abstract
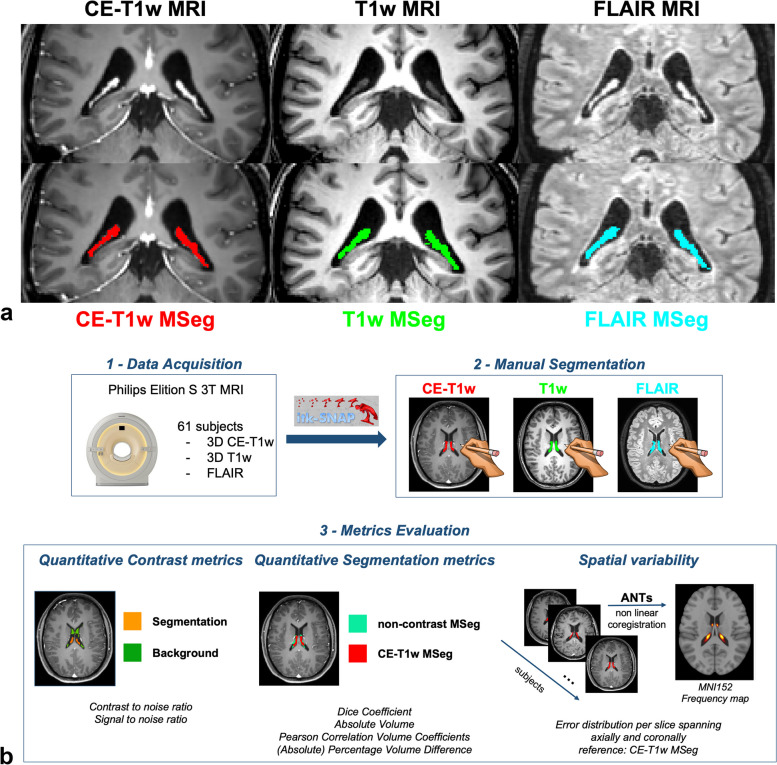
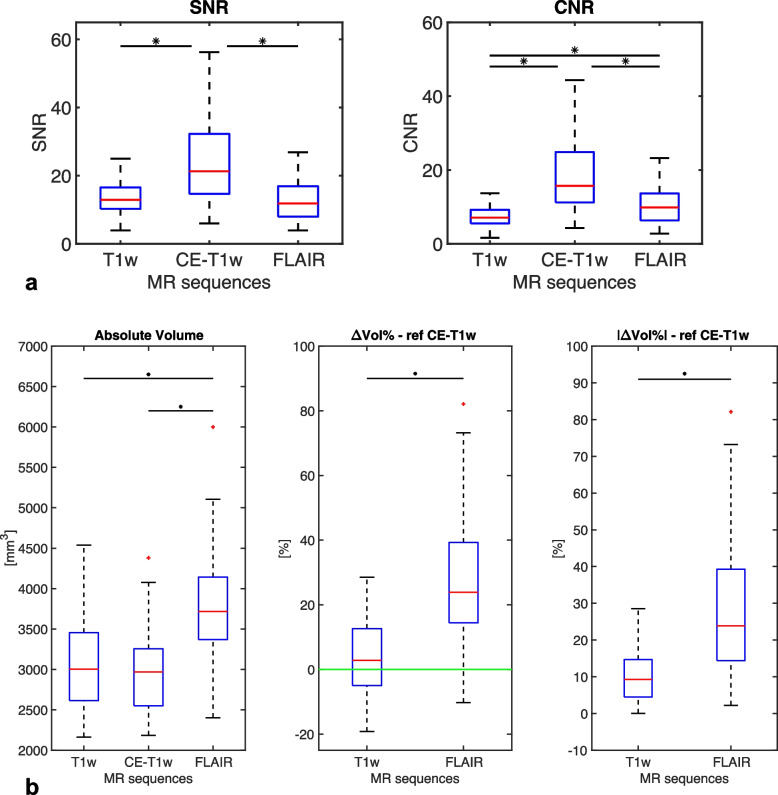
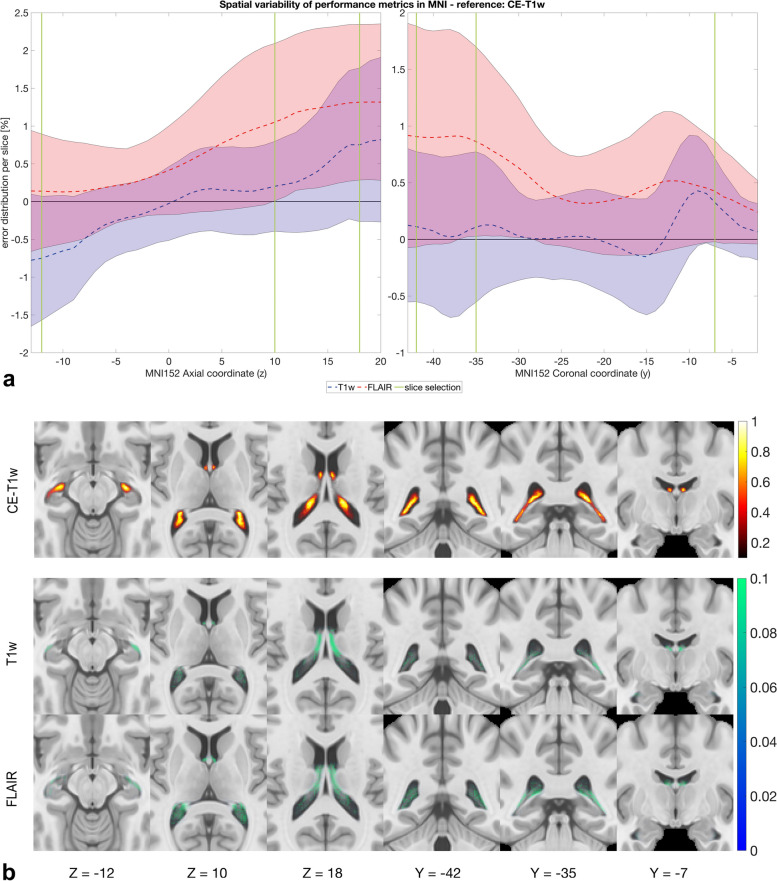
We compared choroid plexus (ChP) manual segmentation on non-contrast-enhanced (non-CE) sequences and reference standard CE T1- weighted (T1w) sequences in 61 multiple sclerosis patients prospectively included. ChP was separately segmented on T1w, T2-weighted (T2w) fluid-attenuated inversion-recovery (FLAIR), and CE-T1w sequences. Inter-rater variability assessed on 10 subjects showed high reproducibility between sequences measured by intraclass correlation coefficient (T1w 0.93, FLAIR 0.93, CE-T1w 0.99). CE-T1w showed higher signal-to-noise ratio and contrast-to-noise ratio (CE-T1w 23.77 and 18.49, T1w 13.73 and 7.44, FLAIR 13.09 and 10.77, respectively). Manual segmentation of ChP resulted 3.073 ± 0.563 mL (mean ± standard deviation) on T1w, 3.787 ± 0.679 mL on FLAIR, and 2.984 ± 0.506 mL on CE-T1w images, with an error of 28.02 ± 19.02% for FLAIR and 3.52 ± 12.61% for T1w. FLAIR overestimated ChP volume compared to CE-T1w (p < 0.001). The Dice similarity coefficient of CE-T1w versus T1w and FLAIR was 0.67 ± 0.05 and 0.68 ± 0.05, respectively. Spatial error distribution per slice was calculated after nonlinear coregistration to the standard MNI152 space and showed a heterogeneous profile along the ChP especially near the fornix and the hippocampus. Quantitative analyses suggest T1w as a surrogate of CE-T1w to estimate ChP volume.Relevance statement To estimate the ChP volume, CE-T1w can be replaced by non-CE T1w sequences because the error is acceptable, while FLAIR overestimates the ChP volume. This encourages the development of automatic tools for ChP segmentation, also improving the understanding of the role of the ChP volume in multiple sclerosis, promoting longitudinal studies.Key points • CE-T1w sequences are considered the reference standard for ChP manual segmentation.• FLAIR sequences showed a higher CNR than T1w sequences but overestimated the ChP volume.• Non-CE T1w sequences can be a surrogate of CE-T1w sequences for manual segmentation of ChP.
Keywords: Choroid plexus; Gadolinium-based contrast media; Image segmentation; Magnetic resonance imaging; Multiple sclerosis.
© 2024. The Author(s).
Conflict of interest statement
The authors of this manuscript declare no relationships with any companies, whose products or services may be related to the subject matter of the article. However, Prof. Massimiliano Calabrese (M.D.) received speaker honoraria from Biogen, Bristol Myers Squibb, Celgene, Genzyme, Merck Serono, Novartis, and Roche and received research support from the Progressive MS Alliance and Italian Minister of Health and from Biogen, Bristol Myers Squibb, Celgene, Genzyme, Merck Serono, Novartis, and Roche not related to this research. Other authors declare that they have no competing interests.
Figures
Similar articles
-
A Fully Automatic Method to Segment Choroid Plexuses in Multiple Sclerosis Using Conventional MRI Sequences.J Magn Reson Imaging. 2024 May;59(5):1643-1652. doi: 10.1002/jmri.28937. Epub 2023 Aug 2. J Magn Reson Imaging. 2024. PMID: 37530734
-
Deep learning segmentation of the choroid plexus from structural magnetic resonance imaging (MRI): validation and normative ranges across the adult lifespan.Fluids Barriers CNS. 2024 Feb 29;21(1):21. doi: 10.1186/s12987-024-00525-9. Fluids Barriers CNS. 2024. PMID: 38424598 Free PMC article.
-
Comparison of contrast-enhanced T1-weighted FLAIR with BLADE, and spin-echo T1-weighted sequences in intracranial MRI.Diagn Interv Radiol. 2009 Jun;15(2):75-80. Diagn Interv Radiol. 2009. PMID: 19517375
-
Deep learning segmentation of the choroid plexus from structural magnetic resonance imaging (MRI): validation and normative ranges across the adult lifespan.Res Sq [Preprint]. 2023 Sep 13:rs.3.rs-3338860. doi: 10.21203/rs.3.rs-3338860/v1. Res Sq. 2023. Update in: Fluids Barriers CNS. 2024 Feb 13;21(1):15. doi: 10.1186/s12987-024-00516-w. PMID: 37790534 Free PMC article. Updated. Preprint.
-
Diagnostic value of contrast-enhanced fluid-attenuated inversion-recovery MRI for intracranial tumors in comparison with post-contrast T1W spin-echo MRI.Chin Med J (Engl). 2006 Mar 20;119(6):467-73. Chin Med J (Engl). 2006. PMID: 16584644
Cited by
-
Choroid Plexus Volume in Pediatric-Onset Multiple Sclerosis.Neurol Neuroimmunol Neuroinflamm. 2024 Nov;11(6):e200319. doi: 10.1212/NXI.0000000000200319. Epub 2024 Oct 23. Neurol Neuroimmunol Neuroinflamm. 2024. PMID: 39442038 Free PMC article.
References
MeSH terms
LinkOut - more resources
Full Text Sources
Medical