. 2024 Jun 1;108(6):1383-1393.
doi: 10.1097/TP.0000000000004944. Epub 2024 Feb 27.

Bile Chemistry During Ex Situ Normothermic Liver Perfusion Does Not Always Predict Cholangiopathy

Affiliations

Bile Chemistry During Ex Situ Normothermic Liver Perfusion Does Not Always Predict Cholangiopathy

Christopher J E Watson et al. Transplantation. .

Abstract

Background: Bile chemistry during normothermic ex situ liver perfusion (NESLiP) has been suggested to be an indicator of cholangiopathy. The normal range of biochemical variables in bile of livers undergoing NESLiP has not been defined, nor have published biliary viability criteria been assessed against instances of posttransplant nonanastomotic bile strictures (NASs).

Methods: The bile and perfusate chemistry of 200 livers undergoing NESLiP between February 1, 2018, and October 30, 2023, was compared. In addition, 11 livers that underwent NESLiP and later developed NAS were selected and their bile chemistry was also examined.

Results: In livers that did not develop cholangiopathy, concentrations of sodium, potassium, and chloride were slightly higher in bile than in perfusate, whereas the concentration of calcium was slightly lower. Bile was alkali and had a lower glucose concentration than perfusate. Cholangiocyte glucose reabsorption was shown to saturate at high perfusate concentrations and was more impaired in livers donated after circulatory death than in livers donated after brain death. Published criteria failed to identify all livers that went on to develop NASs.

Conclusions: A significant false-negative rate exists with current biliary viability criteria, probably reflecting the patchy and incomplete nature of the development of NASs in the biliary tree. The data presented here provide a benchmark for future assessment of bile duct chemistry during NESLiP.


Conflict of interest statement

C.J.E.W., R.G., and A.J.B. participated in research design, writing the article, performing the research, and data analysis. L.S., C.F., S.S.U., R.B., and A.J.B. participated in performing the research. M.E.D.A. participated in writing the article and data analysis. C.J.E.W. received honoraria from OrganOx Ltd for lectures. A.J.B. is coholder of a patent on the circuit used in the OrganOx metra. The other authors declare no conflicts of interest.

Figures

FIGURE 1.
FIGURE 1.
Median and interquartile ranges of perfusate analytes during normothermic perfusion of transplanted livers. Lactate falls rapidly and reaches baseline by 90 min. Glucose rises initially, plateaus, and then falls by zero-order kinetics until it reaches around 10 mmol/L (180 mg/dL), at which point an infusion of glucose begins and the concentration plateaus. Hydrogen ions fall initially and then plateau, and bicarbonate behaves reciprocally, rising before plateauing. Sodium and chloride both fall from the liver-free perfusate levels once the liver is connected to the circuit and remain constant throughout perfusion. Potassium concentrations are initially higher when perfusate contains unwashed red cells, compared with washed red cells; levels then fall slightly during NESLiP before plateauing. Where calcium is not added, the levels remain low and constant throughout perfusion. Where calcium is supplemented, the levels fall slowly throughout the perfusion period. NESLiP, normothermic ex situ liver perfusion.
FIGURE 2.
FIGURE 2.
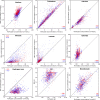
Scatter plots of bile concentrations at different perfusate analyte concentrations at all time points for 200 transplanted livers not developing cholangiopathy. Each dot represents a single bile concentration and corresponding perfusate concentration. DBD livers are colored red, and DCD are colored blue. Potassium is generally higher in bile than perfusate, as is sodium, although there is less difference in sodium concentrations. Calcium concentration in bile is generally slightly lower than in perfusate, whereas glucose is, for the most part, much lower. It is notable that only DCD livers have a bile glucose greater than perfusate glucose. The dead space in the bile duct and collecting cannula and relatively low bile flow rates account for why the bile glucose is recorded higher than perfusate, which has fallen in the period of time taken for bile to progress to the collection bag. Lactate is usually higher in bile, reflecting either the dead space in the bile cannula or anaerobic metabolism of the cholangiocytes. Chloride concentrations are generally higher in bile. DBD, donation after brain death; DCD, donation after circulatory death.
FIGURE 3.
FIGURE 3.
Bile:perfusate ratios of analytes of all transplanted livers during ex situ perfusion. Each graph shows the ratio of bile to perfusate concentrations and enables a ready appreciation of how bile chemistry differs from perfusate.
FIGURE 4.
FIGURE 4.
Bile and perfusate glucose concentrations for transplanted livers. A, The bile and perfusate glucose concentrations at serial time points for an illustrative number of transplanted livers that did not develop cholangiopathy joined by a single line. These curves represent the change over time as perfusate concentration falls. B, A scatter plot of individual perfusate/bile points of all the 200 transplanted livers, with 2 regression lines drawn. Line B is the regression line for perfusate glucose values >20 mmol/L; the slope of 0.82 implies that very little is reabsorbed when the perfusate glucose is >20 mmol/L. Line A is the regression line for perfusate values <10 mmol/L; the gradient of 0.08 implies that most of the glucose is reabsorbed from bile when the perfusate glucose is <10 mmol/L. The dotted line (gradient = 1.0) represents the line of identity along which the points would be expected to lie if bile and perfusate glucose concentrations were the same (after Guzelian and Boyer, 1974).
FIGURE 5.
FIGURE 5.
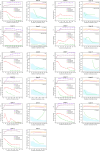
Perfusate and bile glucose and pH trends and ratios during perfusion of livers that went on to develop cholangiopathy of peripheral bile ducts. Eleven pairs of graphs showing the bile and perfusate pH and glucose in the left panel of each pair, and the ratio of bile:perfusate pH and glucose concentrations in the right panel of each pair. The graph of ratios has 2 shaded areas, the upper orange one showing the interquartile range of all pH ratios, whereas the lower shaded area represents the interquartile range of all glucose ratios. As can be seen from the pairs of graphs, these 11 livers fall within the common range of values or exceed them in terms of acceptability. Note that the curves for bile glucose and pH do not start at the outset of perfusion but at various time points as perfusion continues depending on when bile production began.
FIGURE 6.
FIGURE 6.
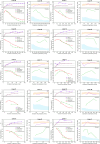
Perfusate and bile glucose and pH trends during perfusion of livers that were declined on the basis of bile chemistry. Similar to Figure 5, this figure shows concentrations on the left and ratios on the right for 10 pairs of livers selected as the first 10 in the series to be declined on biliary criteria. As can be seen, the bile pH and glucose are very abnormal and mimic perfusate values suggesting failure of cholangiocyte secretion and absorption.

Comment in

References

    1. Sutton ME, op den Dries S, Karimian N, et al. . Criteria for viability assessment of discarded human donor livers during ex vivo normothermic machine perfusion. PLoS ONE. 2014;9:e110642. - PMC - PubMed
    1. Tabibian JH, Masyuk AI, Masyuk TV, et al. . Physiology of cholangiocytes. Compr Physiol. 2013;3:541–565. - PMC - PubMed
    1. Esteller A. Physiology of bile secretion. World J Gastroenterol. 2008;14:5641–5649. - PMC - PubMed
    1. Rimland CA, Tilson SG, Morell CM, et al. . Regional differences in human biliary tissues and corresponding in vitro-derived organoids. Hepatology. 2021;73:247–267. - PMC - PubMed
    1. Patrono D, Lonati C, Romagnoli R. Viability testing during liver preservation. Curr Opin Organ Transplant. 2022;27:454–465. - PubMed

Publication types