. 2024 Jan 15:12:298-305.
doi: 10.1109/JTEHM.2024.3355962. eCollection 2024.

Optical Imaging Demonstrates Tissue-Specific Metabolic Perturbations in Mblac1 Knockout Mice

Affiliations

Optical Imaging Demonstrates Tissue-Specific Metabolic Perturbations in Mblac1 Knockout Mice

Busenur Ceyhan et al. IEEE J Transl Eng Health Med. .

Abstract

Objective: Metabolic changes have been extensively documented in neurodegenerative brain disorders, including Parkinson's disease and Alzheimer's disease (AD). Mutations in the C. elegans swip-10 gene result in dopamine (DA) dependent motor dysfunction accompanied by DA neuron degeneration. Recently, the putative human ortholog of swip-10 (MBLAC1) was implicated as a risk factor in AD, a disorder that, like PD, has been associated with mitochondrial dysfunction. Interestingly, the AD risk associated with MBLAC1 arises in subjects with cardiovascular morbidity, suggesting a broader functional insult arising from reduced MBLAC1 protein expression and one possibly linked to metabolic alterations.

Methods: Our current studies, utilizing Mblac1 knockout (KO) mice, seek to determine whether mitochondrial respiration is affected in the peripheral tissues of these mice. We quantified the levels of mitochondrial coenzymes, NADH, FAD, and their redox ratio (NADH/FAD, RR) in livers and kidneys of wild-type (WT) mice and their homozygous KO littermates of males and females, using 3D optical cryo-imaging.

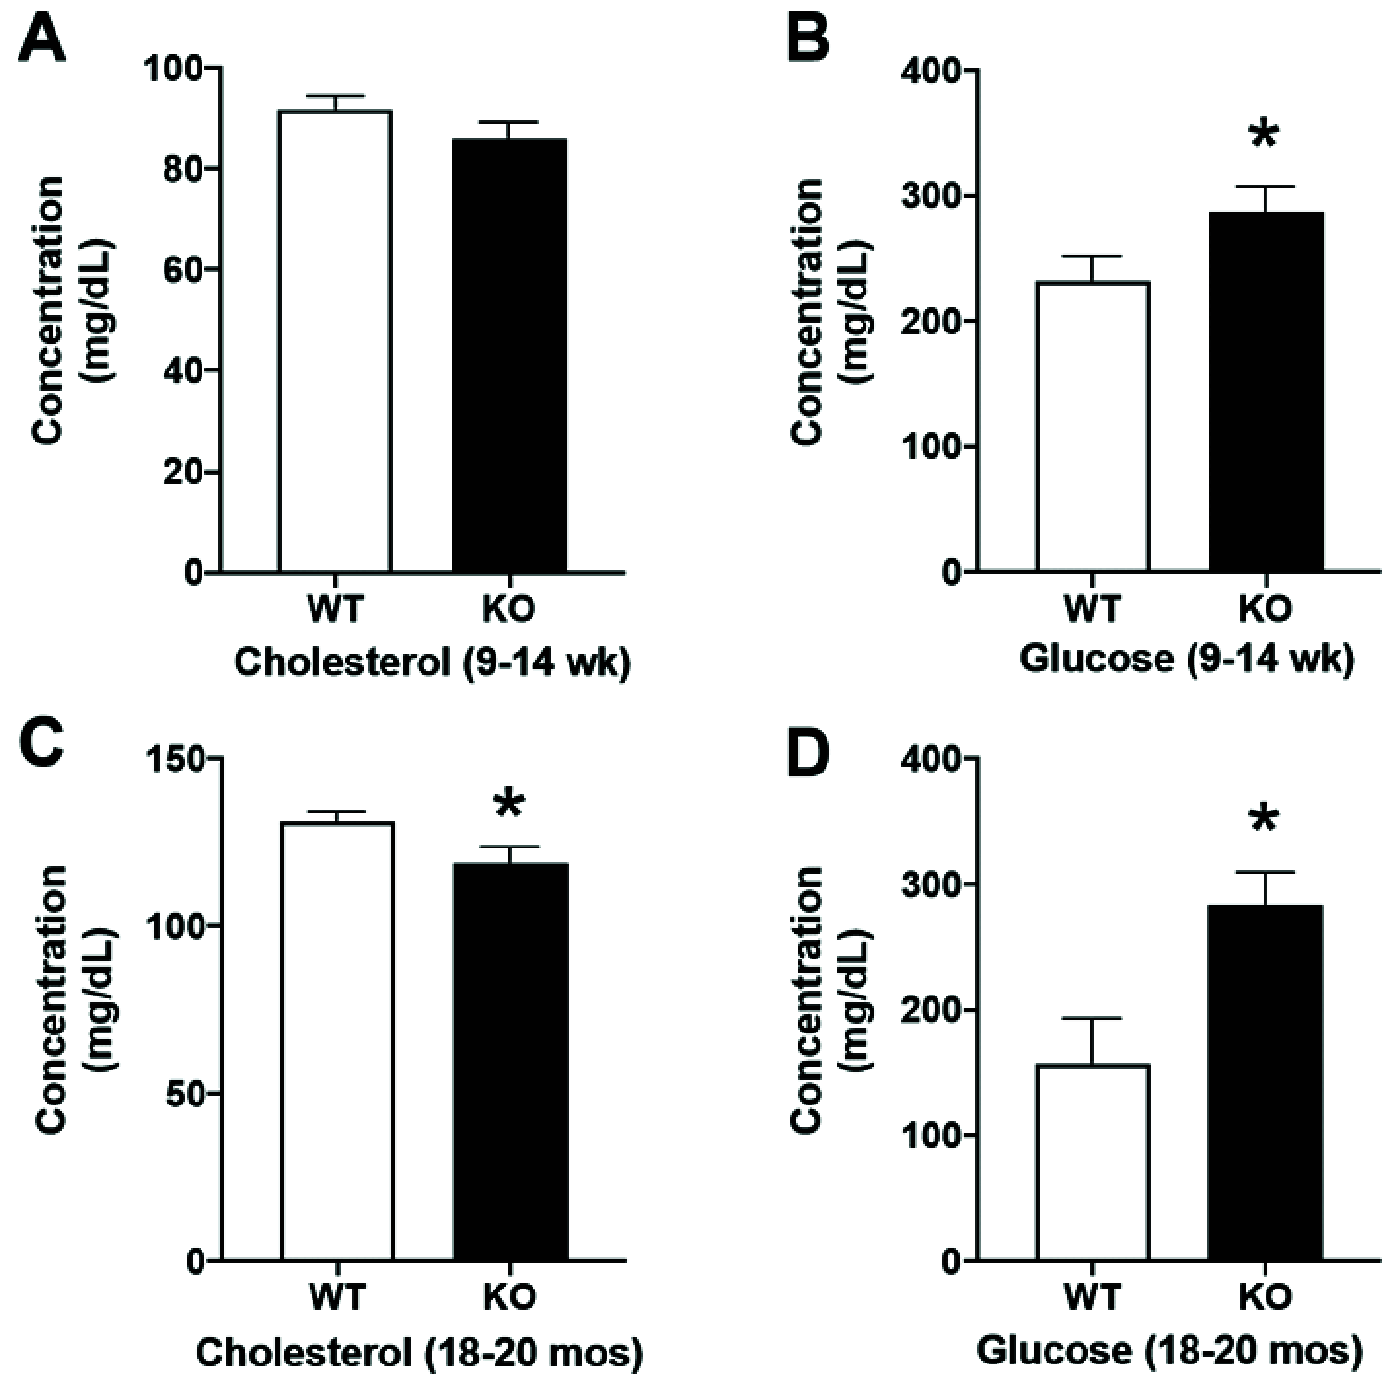
Results: Compared to WT, the RR of livers from KO mice was significantly reduced, without an apparent sex effect, driven predominantly by significantly lower NADH levels. In contrast, no genotype and sex differences were observed in kidney samples. Serum analyses of WT and KO mice revealed significantly elevated glucose levels in young and aged KO adults and diminished cholesterol levels in the aged KOs, consistent with liver dysfunction.

Discussion/conclusion: As seen with C. elegans swip-10 mutants, loss of MBLAC1 protein results in metabolic changes that are not restricted to neural cells and are consistent with the presence of peripheral comorbidities accompanying neurodegenerative disease in cases where MBLAC1 expression changes impact risk.

Keywords: Alzheimer’s disease; MBLAC1; metabolic syndrome; optical metabolic imaging; redox state.


Figures

FIGURE 1.
FIGURE 1.
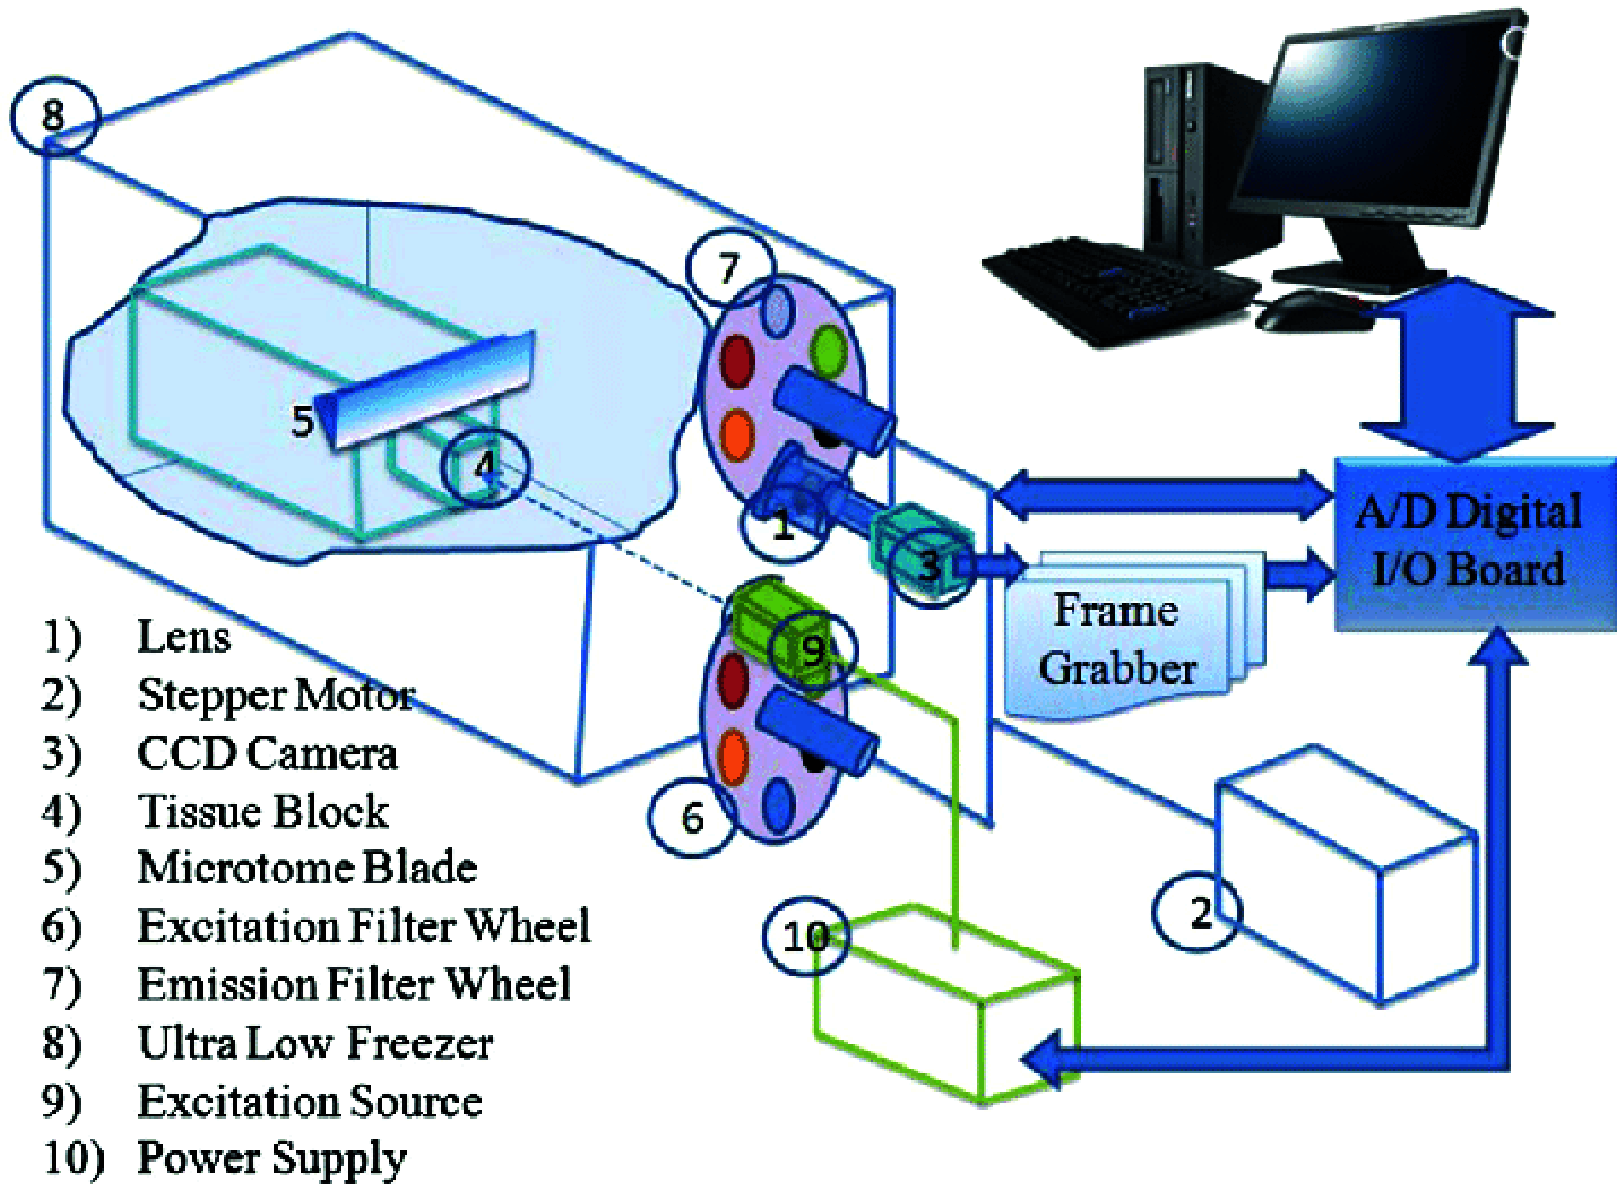
A schematic is shown of the automated image acquisition cryo-microtome, the cryo-imager. Numbers 1-12 depict each component of the automated system. Surface of tissue is imaged in two channels (NADH and FAD) at each successive slice.
FIGURE 2.
FIGURE 2.
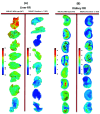
3D reconstructions of WT and KO groups. Panel (A) shows RR (NADH/FAD) for all 16 livers (male and female) and panel (B) shows 16 representative kidneys (male and female). Scale bars coincide with RR and its distribution is revealed in the respective tissues. Red indicates a higher RR value thus a more reduced state. In contrast, blue indicates a lower RR and a more oxidized state.
FIGURE 3.
FIGURE 3.
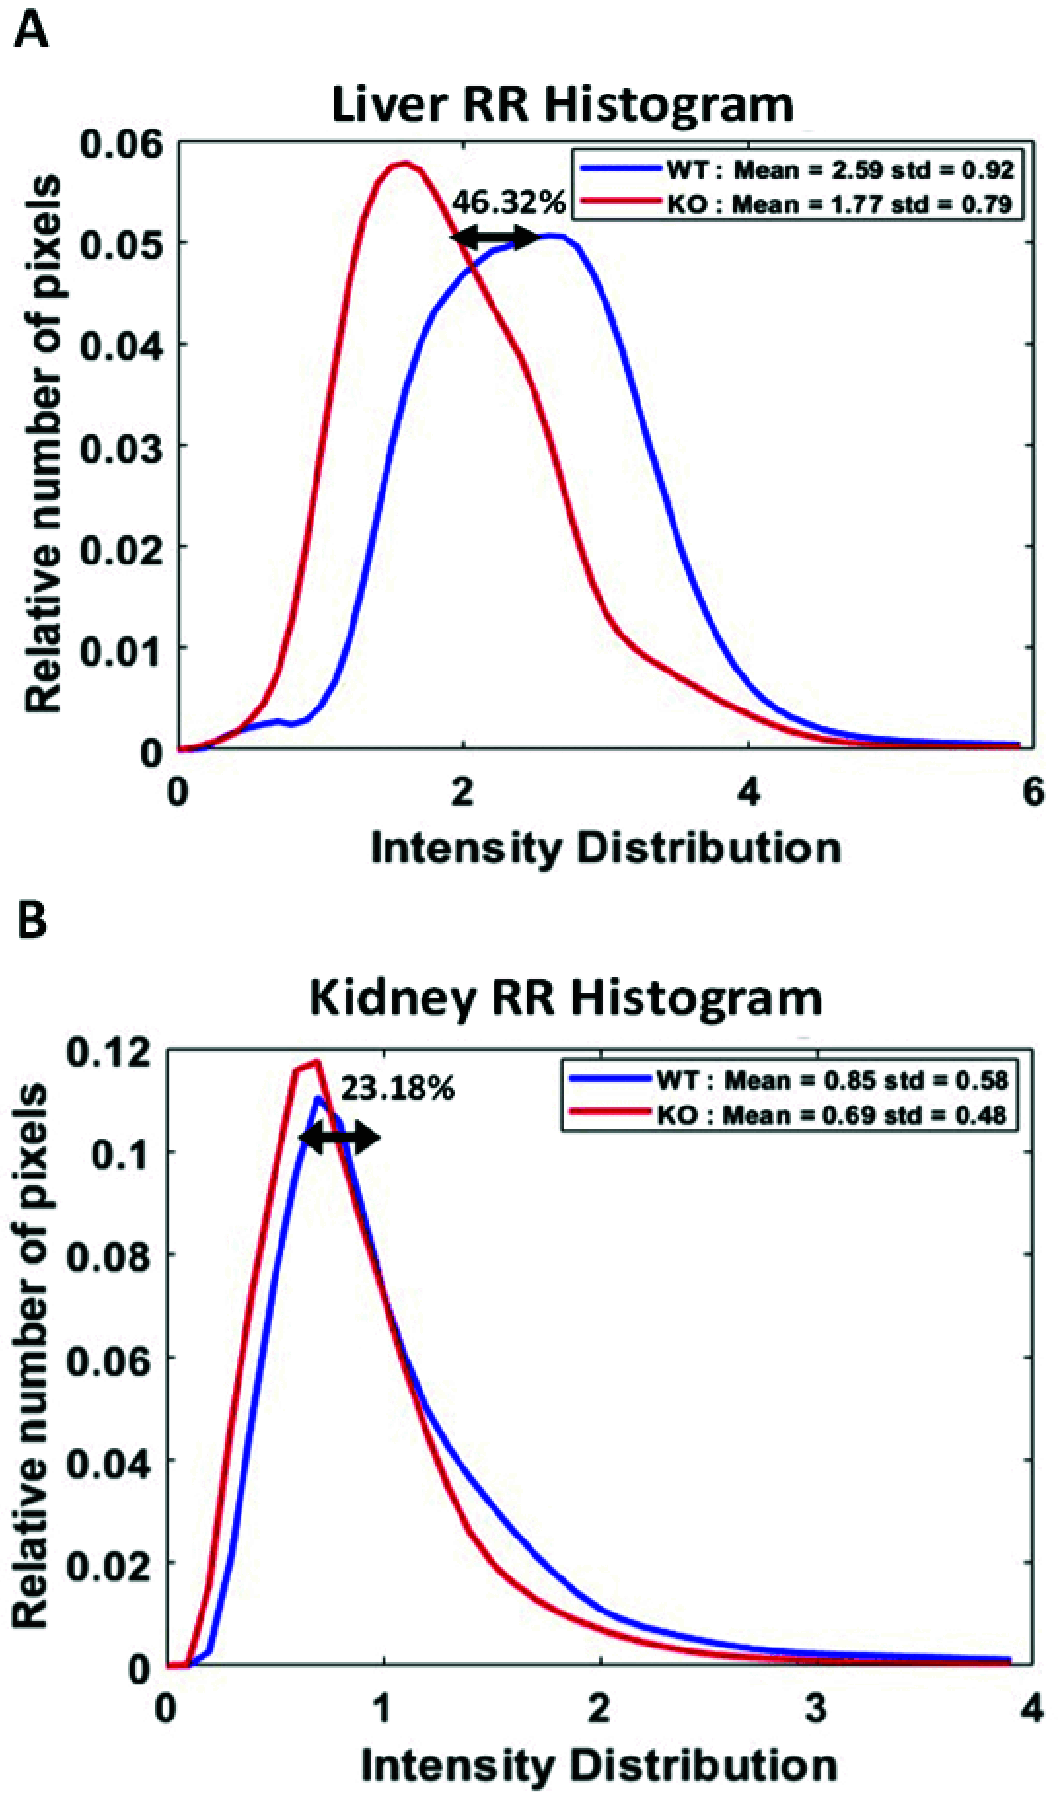
Histograms represent mean RR for all KO and WT livers (A) and kidneys (B). Red designates KO, while blue designates WT values. The mean values of WT and KO livers are 2.59 ± 0.92 and 1.77 ± 0.79. Kidney values are 0.85 ± 0.56 for WT and 0.69 ± 0.48 for KO. Both KO livers and kidneys present a decrease in mean value, with a 46.32% reduction observed for livers and a 23.18% reduction observed for kidneys.
FIGURE 4.
FIGURE 4.
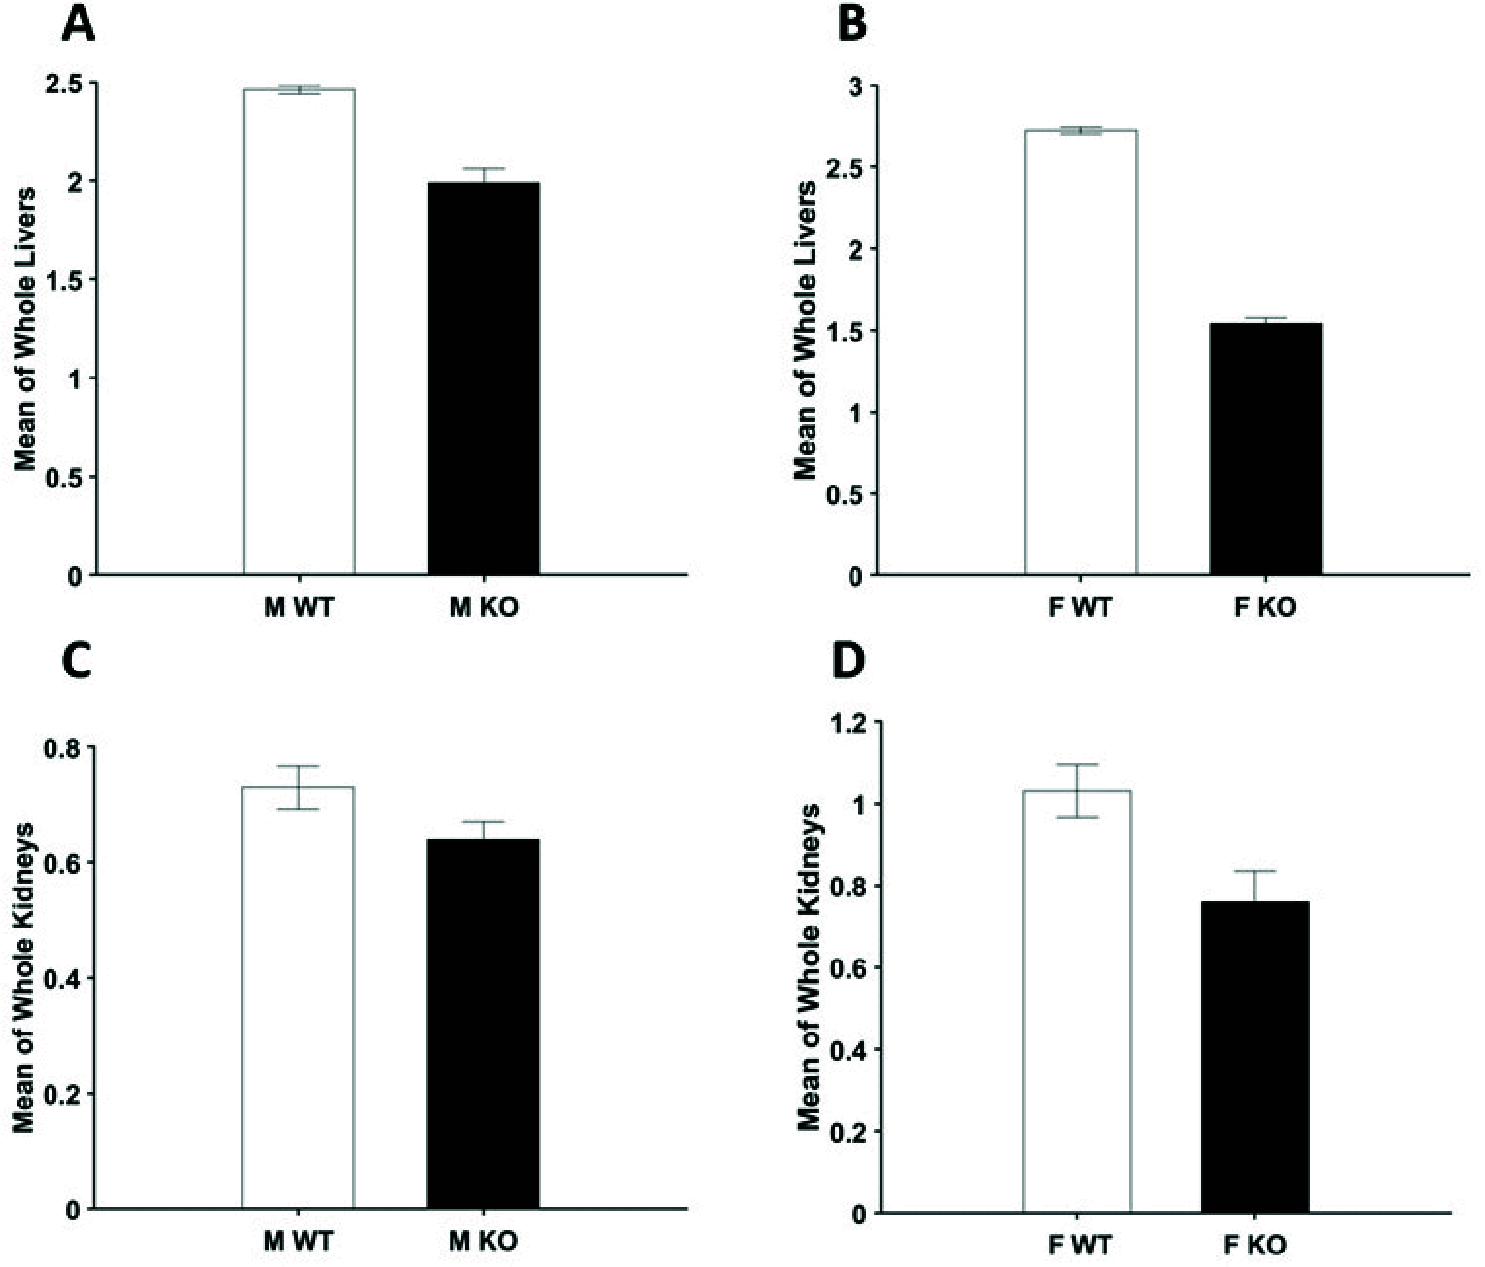
Bar graphs present mean value of the RR ± SEM histograms for male (A) and female (B) livers and male (C) and female (D) kidneys. Two-way ANOVA was carried out for a total of 16 WT and KO livers (4 male, 4 female per group) and 36 WT and KO kidneys (11 male, 7 female per group). Significant sex-dependent differences and genotype x sex interactions were not observed for livers and kidneys.
FIGURE 5.
FIGURE 5.
Bar graphs show the mean value of the RR ± SEM histograms for livers (A) and kidneys (B). Student’s t-test of mean values of RR was carried out for livers (N = 16) and kidneys (N = 36). (A) A significant difference for livers (one-sided Student’s t-test, p = formula image) was found between groups. The significant difference is marked with formula image. (B) Significant difference for kidneys (p = 0.17 > 0.05) was not found between the groups.
FIGURE 6.
FIGURE 6.
Bar graphs compare genotypic effects in 9-14 weeks old mice for cholesterol (A) and glucose (B), and in 18-20 months old mice for cholesterol (C) and glucose (B) via Student’s t-test (p < 0.05). Significant differences are reported in figures B, C, and D with a formula image.

References

    1. Guarino A., Favieri F., Boncompagni I., Agostini F., Cantone M., and Casagrande M., “Executive functions in Alzheimer disease: A systematic review,” Frontiers Aging Neurosci., vol. 10, p. 437, Jan. 2019. - PMC - PubMed
    1. Cahill S., “WHO’s global action plan on the public health response to dementia: Some challenges and opportunities,” Aging Mental Health, vol. 24, no. 2, pp. 197–199, Feb. 2020. - PubMed
    1. Scheltens P.et al., “Alzheimer’s disease,” Lancet, vol. 397, no. 10284, pp. 1577–1590, Apr. 2021. - PMC - PubMed
    1. Ju Y. and Tam K. Y., “Pathological mechanisms and therapeutic strategies for Alzheimer’s disease,” Neural Regeneration Res., vol. 17, no. 3, p. 543, 2022. - PMC - PubMed
    1. Ferreira-Vieira T. H., Guimaraes I. M., Silva F. R., and Ribeiro F. M., “Alzheimer’s disease: Targeting the cholinergic system,” Current Neuropharmacol., vol. 14, no. 1, pp. 101–115, 2016. - PMC - PubMed

Publication types