

This is a preprint.
Blood-based DNA methylation and exposure risk scores predict PTSD with high accuracy in military and civilian cohorts
- PMID: 38410438
- PMCID: PMC10896387
- DOI: 10.21203/rs.3.rs-3952163/v1
Blood-based DNA methylation and exposure risk scores predict PTSD with high accuracy in military and civilian cohorts
Update in
-
Blood-based DNA methylation and exposure risk scores predict PTSD with high accuracy in military and civilian cohorts.BMC Med Genomics. 2024 Sep 27;17(1):235. doi: 10.1186/s12920-024-02002-6. BMC Med Genomics. 2024. PMID: 39334086 Free PMC article.
Abstract
Background: Incorporating genomic data into risk prediction has become an increasingly useful approach for rapid identification of individuals most at risk for complex disorders such as PTSD. Our goal was to develop and validate Methylation Risk Scores (MRS) using machine learning to distinguish individuals who have PTSD from those who do not.
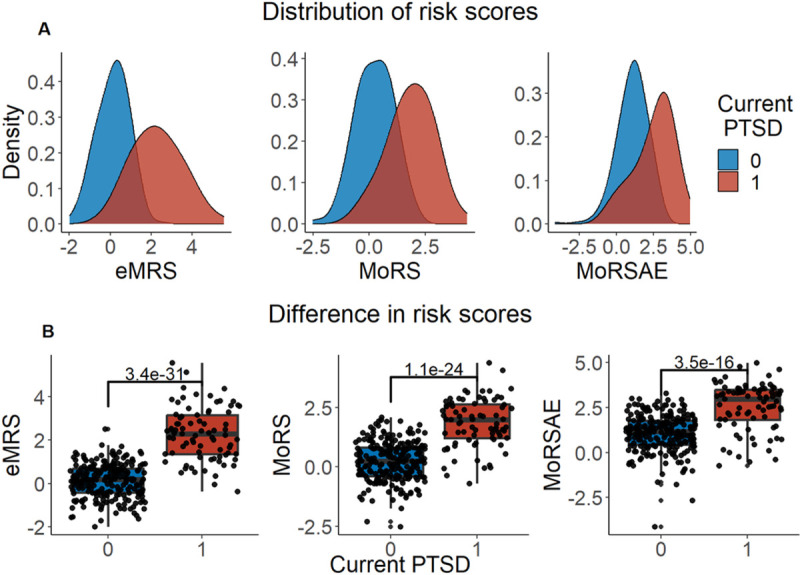
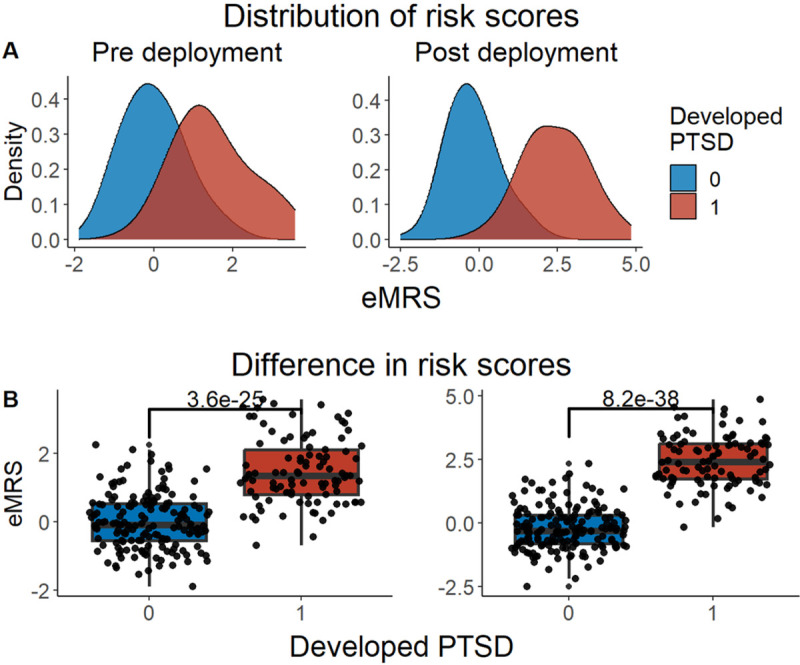
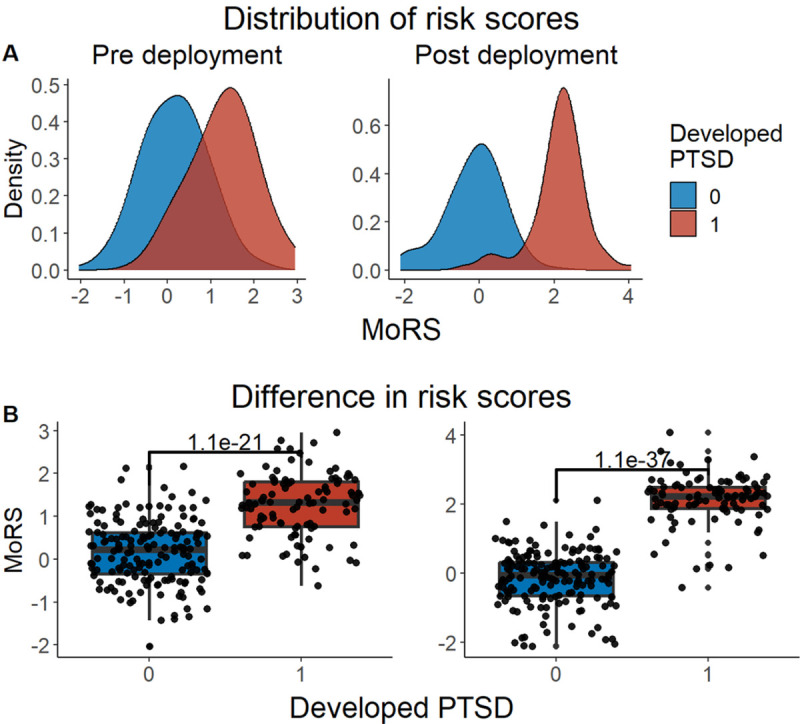
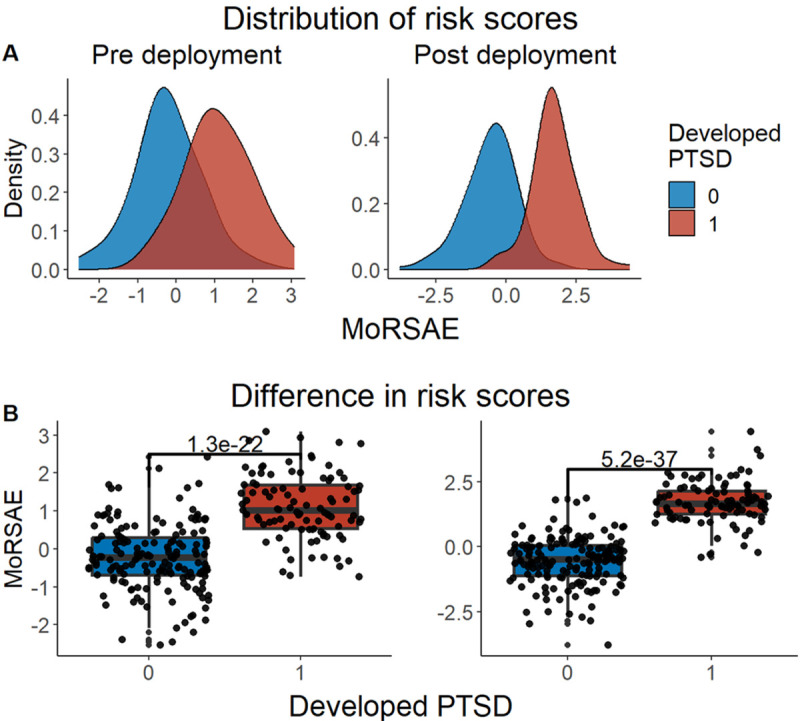
Methods: Elastic Net was used to develop three risk score models using a discovery dataset (n = 1226; 314 cases, 912 controls) comprised of 5 diverse cohorts with available blood-derived DNA methylation (DNAm) measured on the Illumina Epic BeadChip. The first risk score, exposure and methylation risk score (eMRS) used cumulative and childhood trauma exposure and DNAm variables; the second, methylation-only risk score (MoRS) was based solely on DNAm data; the third, methylation-only risk scores with adjusted exposure variables (MoRSAE) utilized DNAm data adjusted for the two exposure variables. The potential of these risk scores to predict future PTSD based on pre-deployment data was also assessed. External validation of risk scores was conducted in four independent cohorts.
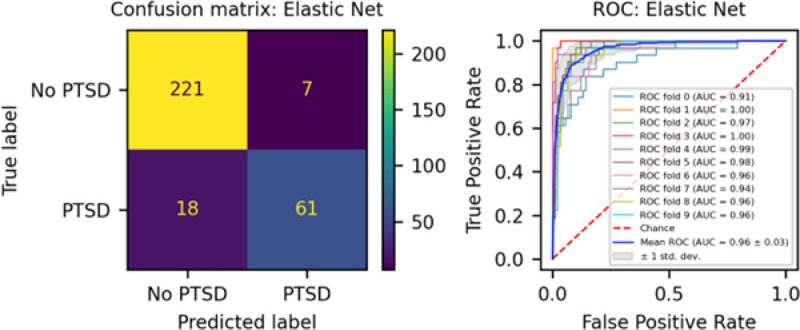
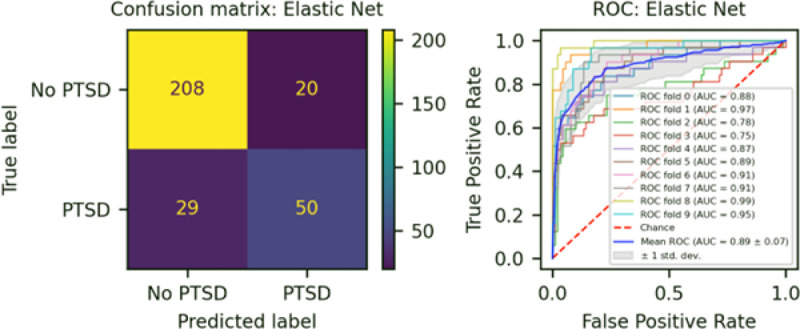
Results: The eMRS model showed the highest accuracy (92%), precision (91%), recall (87%), and f1-score (89%) in classifying PTSD using 3730 features. While still highly accurate, the MoRS (accuracy = 89%) using 3728 features and MoRSAE (accuracy = 84%) using 4150 features showed a decline in classification power. eMRS significantly predicted PTSD in one of the four independent cohorts, the BEAR cohort (beta = 0.6839, p-0.003), but not in the remaining three cohorts. Pre-deployment risk scores from all models (eMRS, beta = 1.92; MoRS, beta = 1.99 and MoRSAE, beta = 1.77) displayed a significant (p < 0.001) predictive power for post-deployment PTSD.
Conclusion: Results, especially those from the eMRS, reinforce earlier findings that methylation and trauma are interconnected and can be leveraged to increase the correct classification of those with vs. without PTSD. Moreover, our models can potentially be a valuable tool in predicting the future risk of developing PTSD. As more data become available, including additional molecular, environmental, and psychosocial factors in these scores may enhance their accuracy in predicting the condition and, relatedly, improve their performance in independent cohorts.
Keywords: DNA methylation; Machine learning; PTSD; Risk scores.
Figures

References
-
- Yehuda R, Hoge CW, McFarlane AC, Vermetten E, Lanius RA, Nievergelt CM, et al. Post-traumatic stress disorder. Nature Reviews Disease Primers. 2015;1(1):15057. - PubMed
-
- Kessler RC, Sonnega A, Bromet E, Hughes M, Nelson CB. Posttraumatic stress disorder in the National Comorbidity Survey. Archives of general psychiatry. 1995;52(12):1048–60. - PubMed
-
- Kulka RA, Schlenger WE, Fairbank JA, Hough RL, Jordan BK, Marmar CR, et al. Trauma and the Vietnam war generation: Report of findings from the National Vietnam Veterans Readjustment Study. Philadelphia, PA, US: Brunner/Mazel; 1990. xxix, 322–xxix, p.
-
- Brady KT, Killeen TK, Brewerton T, Lucerini S. Comorbidity of psychiatric disorders and posttraumatic stress disorder. The Journal of clinical psychiatry. 2000;61 Suppl 7:22–32. - PubMed
-
- Kessler RC, Wang PS. The Descriptive Epidemiology of Commonly Occurring Mental Disorders in the United States. 2008;29(1):115–29. - PubMed
Publication types
Grants and funding
LinkOut - more resources
Full Text Sources
Research Materials
