[Preprint]. 2024 Feb 16:rs.3.rs-3956430.
doi: 10.21203/rs.3.rs-3956430/v1.

Cover Crop Root Exudates Impact Soil Microbiome Functional Trajectories in Agricultural Soils

Affiliations

Cover Crop Root Exudates Impact Soil Microbiome Functional Trajectories in Agricultural Soils

Valerie A Seitz et al. Res Sq. .

Update in

Abstract

Background: Cover cropping is an agricultural practice that uses secondary crops to support the growth of primary crops through various mechanisms including erosion control, weed suppression, nutrient management, and enhanced biodiversity. Cover crops may elicit some of these ecosystem services through chemical interactions with the soil microbiome via root exudation, or the release of plant metabolites from roots. Phytohormones are one metabolite type exuded by plants that activate the rhizosphere microbiome, yet managing this chemical interaction remains an untapped mechanism for optimizing plant-soil microbiome interactions. Currently, there is limited understanding on the diversity of cover crop phytohormone root exudation patterns and how these chemical messages selectively enrich specific microbial taxa and functionalities in agricultural soils.

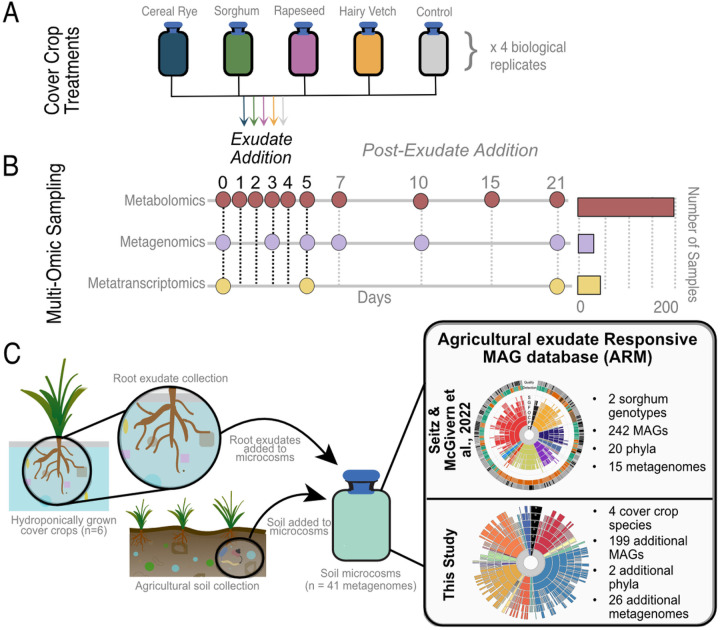
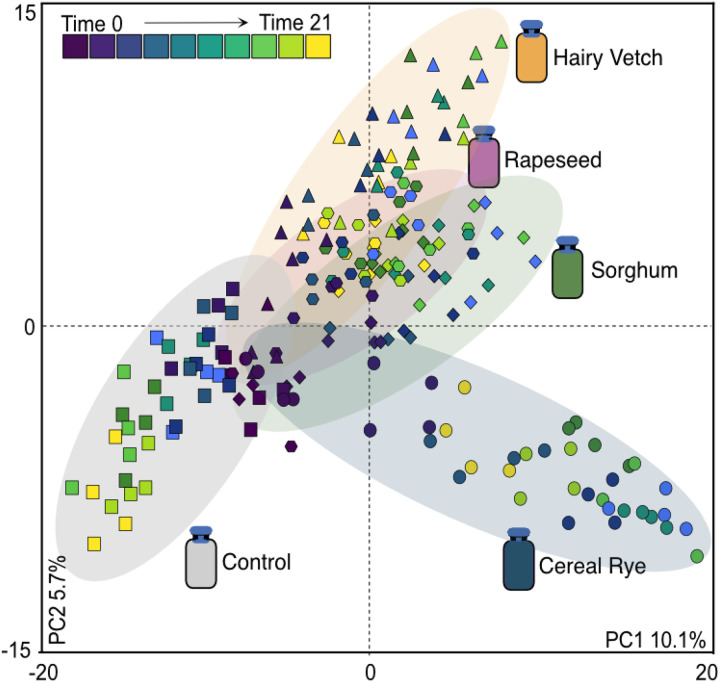
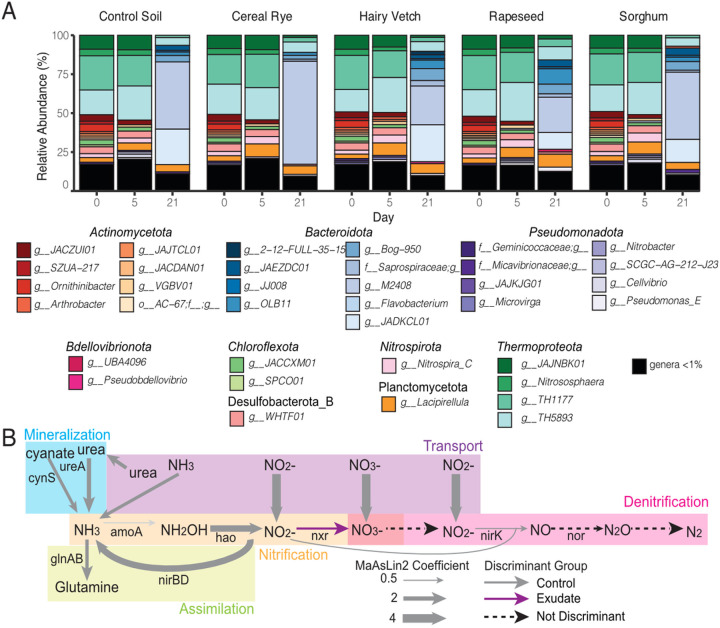
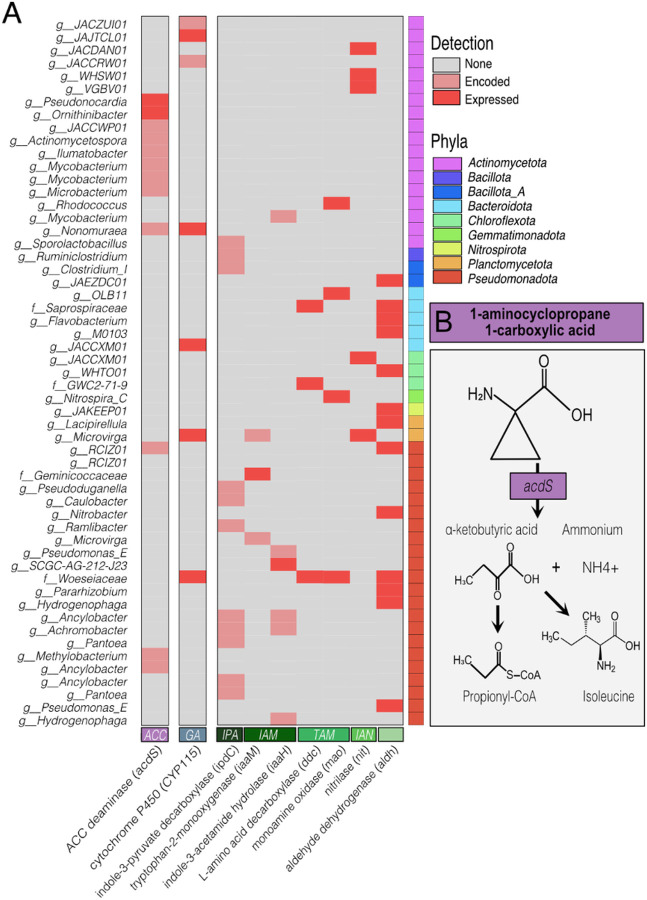
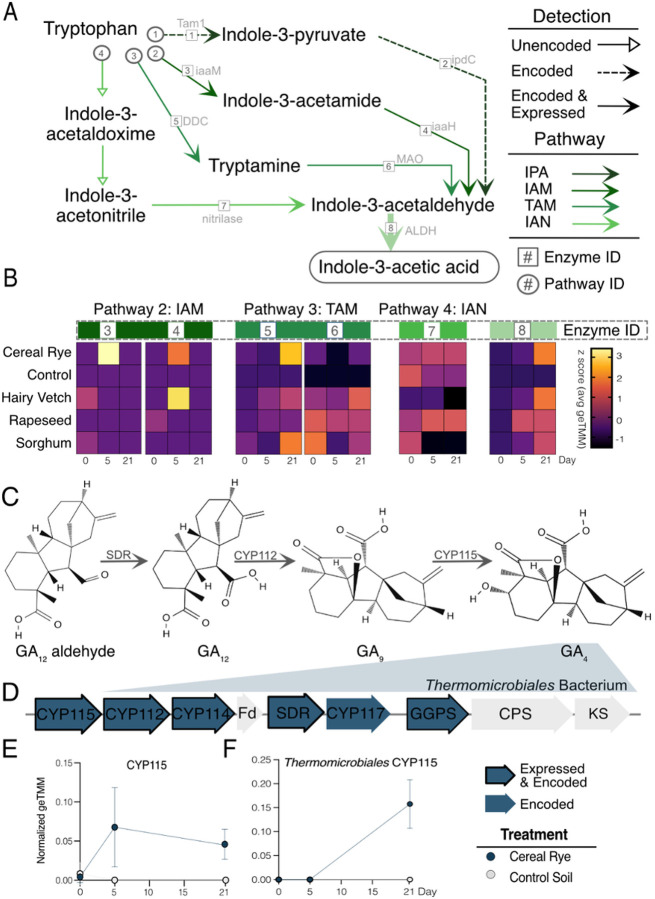
Results: Here, we link variability in cover crop root exudate composition to changes in soil microbiome functionality. Exudate chemical profiles from 4 cover crop species (Sorghum bicolor, Vicia villosa, Brassica napus, and Secale cereal) were used as the chemical inputs to decipher microbial responses. These distinct exudate profiles, along with a no exudate control, were amended to agricultural soil microcosms with microbial responses tracked over time using metabolomes and genome-resolved metatranscriptomes. Our findings illustrated microbial metabolic patterns were unique in response to cover crop exudate inputs over time, particularly by sorghum and cereal rye amended microcosms where we identify novel microbial members (at the genera and family level) who produced IAA and GA4 over time. We also identify broad changes in microbial nitrogen cycling in response chemical inputs.

Conclusions: We highlight that root exudate amendments alter microbial community function and phytohormone metabolisms, particularly in response to root exudates isolated from cereal rye and sorghum plants. Additionally, we constructed a soil microbial genomic catalog of microorganisms responding to commonly used cover crops, a public resource for agriculturally-relevant microbes. Many of our exudate-stimulated microorganisms are representatives from poorly characterized or novel taxa, highlighting the yet to be discovered metabolic reservoir harbored in agricultural soils. Our findings emphasize the tractability of high-resolution multiomics approaches to investigate processes relevant for agricultural soils, opening the possibility of targeting specific soil biogeochemical outcomes through biological precision agricultural practices that use cover crops and the microbiome as levers for enhanced crop production.

Keywords: Brassica napus; Phytohormone; Secale cereal; Sorghum bicolor; Vicia villosa; liquid chromatography mass spectrometry (LC-MS); metagenome assembled genome (MAG); metatranscriptomics; plant growth promoting.


Conflict of interest statement

Competing interests: The authors have no competing interests. Additional Declarations: No competing interests reported.

Figures

Figure 1
Figure 1. Experimental design.
A) Root exudates were collected from 4 hydroponically grown cover crops [25] along with a water control treatment. The soil reactors were amended with soil from the agricultural research station at Colorado State University in biological quadruplets from 5 treatments (i) cereal rye (dark blue), (ii) sorghum (green), (iii) rapeseed (light purple), (iv) hairy vetch (orange) and a water amended soil control (grey). B) In this study, microcosms were amended with root exudates from cover crops as shown in (A) for 6 days (denoted as the exudate addition phase) and responses were surveyed for 21 days (post-exudate addition phase). Metagenomes (n=26), metatranscriptomes (n=40), and metabolomes (n=199) were collected at specific timepoints, indicated by circles, to profile microbial responses. The number of samples collected for each ‘omic measurement is indicated by the bar charts on the right. C) Schematic summary of the data collected for the metagenome assembled genome (MAG) database, which includes content from a prior study [25] and findings reported here. These MAGs were used to construct the Agricultural exudate-Responsive Metagenomic (ARM) database, with contributions from each experiment highlighted by bullet points.
Figure 2
Figure 2. Curation of an exudate-responsive metagenome assembled genome (MAG) database.
A) The taxonomy of the dereplicated MAGs are shown by sequentially colored rings ordered from domain (D, inner ring; grey=bacteria, purple=archaea), phylum (P), class (C), order (O), family (F), genus (G), to species (S, outer ring) assignment. Ring color corresponds to phylum, with the taxonomic assignment denoted in the legend to the left. Gaps at each level represent MAGs that were unclassified at that level of taxonomy (according to GTDB v2.3.0 08-RS214). B) Stacked bar chart shows novelty of ARM MAGs when compared to GTDB. Bars indicates the number of dereplicated MAGs recovered that represent unassigned families and genera as well as MAGs assigned only an alphanumeric identifier. Here, novelty is defined as the first unnamed level (i.e., unnamed family or genus) and the level where an alphanumeric identifier is used (i.e., alphanumeric family). Coloring corresponds to MAG phylum.
Figure 3
Figure 3. Cover crop exudate treatments influence soil microbial metabolomes.
Two-dimensional scores plot of partial least squares discriminate analysis (PLS-DA) (R2X = 0.101, R2Y = 0.0597, Q2 = 0.784, PERMANOVA, p<0.05) between all treatment metabolomes. Each point represents a metabolome, with colors representing time. Shapes denote treatment: cereal rye (circles), hairy vetch (triangles), sorghum (diamonds), octagons (rapeseed) and control (square) metabolomes. Ellipses represent 95% confidence intervals and are colored by treatment. Corresponding loadings biplot can be found in Additional File 9, Figure 2.
Figure 4
Figure 4. Overall expressed gene content but not transcriptionally active genera, are altered by cover crop exudates.
(A) Average metatranscriptome profiles of the MAGs from control and exudate microcosms. MAG metatranscript abundance was summed at the genus level and then averaged across replicates. Colors correspond to MAG genus and MAGs with an abundance less than 1% are shown in black. (B) Nitrogen cycling functions differed between control and all cover crop exudate metatranscriptomes at day 5. Arrow thickness corresponds to significant MaAsLin2 coefficients (roughly effect size), and arrow color indicates the treatment with which the feature associated (grey for the control, purple for the exudates). Dashed black lines correspond to functions that were detected in the metatranscriptomes but were not discriminant. For plots of nitrogen function expression, see Additional File 9, Figure 9. To see all discriminant functions and their statistics, see Additional File 8.
Figure 5
Figure 5. Cover crop treatment influences microbial phytohormone biosynthesis across time.
A) Partial least squares discriminate analysis (PLS-DA) (R2X = 0.101, R2Y = 0.0597) biplot shows the relative contribution of each phytohormone abundance found within a treatment metabolome. Colored stars indicate a treatment and colored circles indicate a phytohormone. Colored circles with text labels indicate phytohormones discussed in the text. B-D) Line graphs show temporal dynamics of 4 phytohormones colored by treatment. Circles represent the average concentration at that timepoint, and error bars represent one standard deviation. (B) Indole-3-acetic acid (IAA) (C) 1-aminocyopropane carboxylic acid (ACC) (D) Gibberellic acid 4 (GA4) (E) Indole-3-butyric acid (IBA).
Figure 6
Figure 6. Gene potential and expression across phytohormone metabolic routes.
A) heatmap shows the expression (in red) or the gene potential (in pink) for each gene in (i) ACC degradation (acdS; purple), (ii) GA4 biosynthesis (CYP115; blue), or (iii) IAA biosynthesis (shades of green correspond to different IAA pathways; darkest green for the indole-3-pyruvate (IPA) pathway, dark green for the indole-3-acetamide (IAM) pathway, green for the tryptamine (TAM) pathway, and light green for the indole-3-acetonitrile (IAN) pathway, the final lightest shade of green represent the terminal oxidation of indole acetaldehyde (IAAId) to IAA)). MAGs listed are those only detected in exudate amended microcosms and not controls as indicated in the main text. When genus name was undescribed, family name was used. Colored boxes to the right indicate MAG phylum with taxonomy in the legend to the right. Colored boxes at the bottom indicate the pathway. B) ACC deamination (acdS) yields ammonium and α-ketobutyric acid, a compound which can be further transformed to propionyl-CoA or isoleucine (Additional File 3).
Figure 7
Figure 7. Indole-3-acetic acid and gibberellic acid 4 biosynthesis routes and associated MAGs.
A) IAA biosynthetic pathways. Four routes for IAA biosynthesis were detected by metagenomics and/or metatranscriptomics where detection is indicated by arrow type: hollow arrows indicate the gene was not detected, dotted arrows indicate the gene was only encoded (metaG only), solid arrows indicate the gene was encoded and expressed. Enzymes names are in grey next to the corresponding reaction arrow and given an enzyme number (“enzyme #”). Pathways are given a corresponding ID # in circles. Colors correspond to IAA pathway. B) Heatmaps show the z-scored geTMM value for each summed gene abundance across all MAGs expressing the gene (corresponding to the enzyme number in (A)) within a treatment and timepoint. C) Downstream GA4 biosynthetic route for production of bioactive GA4. D) The GA operon highlighting a potentially-new bacterium of the Thermomicrobiales, which expressed 5 of 9 GA biosynthetic proteins required to produce GA4, including the final enzyme converting GA9 to GA4. Grey arrows indicate the gene was neither expressed or encoded in the Thermomicrobiales MAG, blue arrows show an encoded gene, and a blue arrow with a black border show a gene was encoded and expressed in the Thermomicrobiales MAG. E) Averaged geTMM abundance of MAGs producing CYP115 protein in cereal rye and control microcosms. F) Expression of CYP115 from a novel Thermomicrobiales bacterium protein in cereal rye and control microcosms

References

    1. SARE: Annual Report 2019–2020 National Cover Crop Survey In. Sustainable Agriculture Research and Education (SARE); 2020.
    1. Mitchell JP, Shrestha A, Mathesius K, Scow KM, Southard RJ, Haney RL, et al. Cover cropping and no-tillage improve soil health in an arid irrigated cropping system in California’s San Joaquin Valley, USA. Soil and Tillage Research. 2017;165:325–35; doi: 10.1016/j.still.2016.09.001. - DOI
    1. Vukicevich E, Lowery T, Bowen P Úrbez-Torres JR, Hart M. Cover crops to increase soil microbial diversity and mitigate decline in perennial agriculture. A review. Agronomy for Sustainable Development. 2016;36(3):48; doi: 10.1007/s13593-016-0385-7. - DOI
    1. Strickland MS, Thomason WE, Avera B, Franklin J, Minick K, Yamada S, et al. Short-Term Effects of Cover Crops on Soil Microbial Characteristics and Biogeochemical Processes across Actively Managed Farms. Agrosystems, Geosciences & Environment. 2019;2(1):180064; doi: 10.2134/age2018.12.0064. - DOI
    1. Shackelford GE K Rodd; Dicks Lynn V. Effects of cover crops on multiple ecosystem services: Ten meta-analyses of data from arable farmland in California and the Mediterranean. Land Use Policy. 2019;88.

Publication types