[Preprint]. 2024 Feb 16:rs.3.rs-3631708.
doi: 10.21203/rs.3.rs-3631708/v1.

Multi-cohort cerebrospinal fluid proteomics identifies robust molecular signatures for asymptomatic and symptomatic Alzheimer's disease

Affiliations

Multi-cohort cerebrospinal fluid proteomics identifies robust molecular signatures for asymptomatic and symptomatic Alzheimer's disease

Carlos Cruchaga et al. Res Sq. .

Update in

  • Multi-cohort cerebrospinal fluid proteomics identifies robust molecular signatures across the Alzheimer disease continuum.
    Ali M, Timsina J, Western D, Liu M, Beric A, Budde J, Do A, Heo G, Wang L, Gentsch J, Schindler SE, Morris JC, Holtzman DM, Ruiz A, Alvarez I, Aguilar M, Pastor P, Rutledge J, Oh H, Wilson EN, Guen YL, Khalid RR; Knight Alzheimer Disease Research Center (Knight ADRC); Alzheimer Disease Neuroimaging Initiative (ADNI); Fundació ACE Alzheimer Center Barcelona (FACE); Barcelona-1; Stanford Alzheimer Disease Research Center (Stanford ADRC); Robins C, Pulford DJ, Tarawneh R, Ibanez L, Wyss-Coray T, Sung YJ, Cruchaga C. Ali M, et al. Neuron. 2025 May 7;113(9):1363-1379.e9. doi: 10.1016/j.neuron.2025.02.014. Epub 2025 Mar 14. Neuron. 2025. PMID: 40088886

Abstract

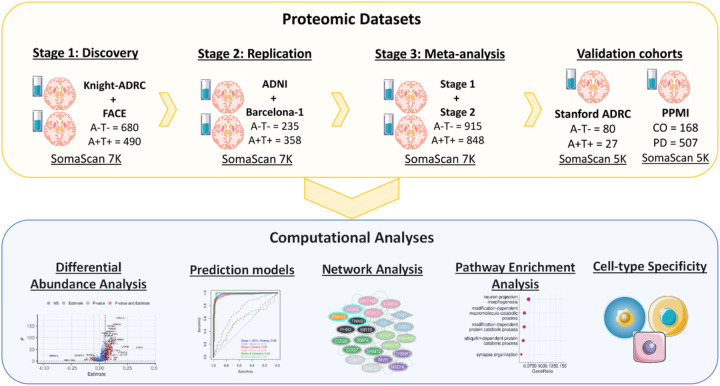
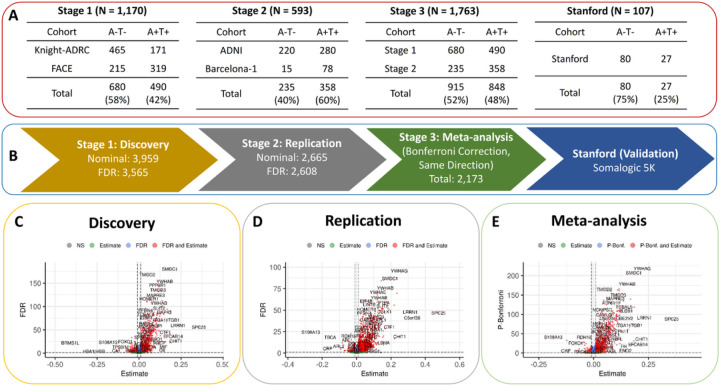
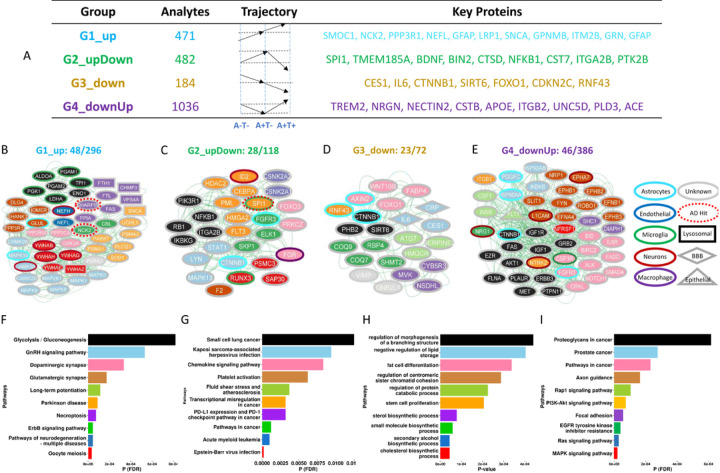
Changes in Amyloid-β (A), hyperphosphorylated Tau (T) in brain and cerebrospinal fluid (CSF) precedes AD symptoms, making CSF proteome a potential avenue to understand the pathophysiology and facilitate reliable diagnostics and therapies. Using the AT framework and a three-stage study design (discovery, replication, and meta-analysis), we identified 2,173 proteins dysregulated in AD, that were further validated in a third totally independent cohort. Machine learning was implemented to create and validate highly accurate and replicable (AUC>0.90) models that predict AD biomarker positivity and clinical status. These models can also identify people that will convert to AD and those AD cases with faster progression. The associated proteins cluster in four different protein pseudo-trajectories groups spanning the AD continuum and were enrichment in specific pathways including neuronal death, apoptosis and tau phosphorylation (early stages), microglia dysregulation and endolysosomal dysfuncton(mid-stages), brain plasticity and longevity (mid-stages) and late microglia-neuron crosstalk (late stages).


Conflict of interest statement

Additional Declarations: Yes there is potential Competing Interest. CC has received research support from: GSK and EISAI. CC is a member of the scientific advisory board of Circular Genomics and owns stocks. CC is a member of the scientific advisory board of ADmit. The other co-authors have nothing to declare. CC and MA have an invention disclosure for the prediction models, including protein IDs, weights, cut off and algorithms. Competing interests CC has received research support from: GSK and EISAI. CC is a member of the scientific advisory board of Circular Genomics and owns stocks. CC is a member of the scientific advisory board of ADmit. The other co-authors have nothing to declare. CC and MA have an invention disclosures for the prediction models, including protein IDs, weights, cut off and algorithms,

Figures

Figure 1
Figure 1. Schematic of experimental and analytical workflow.
A three-stage (Stage 1, Stage 2, Meta-analysis) analytical workflow was used to identify significant changes in the AD CSF proteome (AT vs. A+T+). The proteomic signatured identified in the meta-analyses was further tested in an external validation cohort (Stanford ADRC). The identified proteomic changes were subsequently used for creating robust disease prediction models, delineating the protein abundance trajectory across different AD stages (AT, A+T, A+T+), conducting pathway and cell type enrichment analysis, as well as generating protein-protein interaction networks to understand AD biology.
Figure 2
Figure 2. Differential abundance analysis of AD CSF proteomics.
A) We used AT(N) framework to identify proteins displaying a significant association between AT and A+T+ individuals in the stage 1 (n=1,170) and stage 2 (n=593). The results from both these stages were further meta-analysed (stage 3) to obtain a final set of proteins showing consistent associations across all stages. B) A three-stage study design (discovery, replication, meta-analysis) was employed to identify AD-specific proteomics alterations in the CSF. The robustness of the meta-analysis results was further validated in an independent study (Stanford ADRC; n=105). C) Volcano plots displaying proteins with significantly increased and decreased abundance in the A+T+ individuals in comparison to AT. The dotted lines on the x- and y-axis of the volcano plot indicate the thresholds for estimate (0) and FDR (0.05), respectively, except in the case of meta-analysis where Bonferroni correction was applied. Proteins on the right side of the dotted lines indicate higher abundance in A+T+ in comparison to AT individuals, whereas, the ones on left side indicates lower abundance.
Figure 3
Figure 3. Performance of 11-protein AD prediction model.
A) Derivation of 11 protein panel AD prediction model. B) Performance of identified AD prediction model in comparing AT and A+T+ individuals across different discovery and replication datasets. C) Performance of identified AD prediction model when applied to classify individuals based on clinical diagnosis (AD = Alzheimer’s disease, CO = healthy controls). D) Predictive power of identified AD prediction model in case of other related dementias including dementia Lewy body (DLB), frontotemporal dementia (FTD), Parkinson’s disease (PD), and other non-AD individuals in comparison to healthy controls. E) Rate of dementia progression over time for individuals predicted as proteomic signature–positive (red) and –negative (green) using 11-protein AD-specific CSF proteomic panel. No significant difference was observed in the rate of dementia progression for A+T+ (blue) and AT (orange) individuals. F) Time-to-event (developing AD) analysis of individuals predicted as proteomic signature–positive (green) and –negative (red). Upper and lower 95% confidence intervals for both these groups are represented by slightly transparent regions around the actual slopes in the Kaplan-Meier curve.
Figure 4
Figure 4. Pathway enrichment and network analyses identify well established and novel proteins and pathways implicated in AD.
A) Grouping of differentially abundant proteins based on their distinct alteration trajectories in the AD continuum. B-E) Protein-protein interaction (PPI) networks were obtained using STRING database for proteins constituting the top 10 functional pathways (F-I) enriched in individual protein groups.

References

    1. Jack C. R. J. et al. A/T/N: An unbiased descriptive classification scheme for Alzheimer disease biomarkers. Neurology 87, 539–547 (2016). - PMC - PubMed
    1. Gatz M. et al. Role of genes and environments for explaining Alzheimer disease. Archives of general psychiatry 63, 168–174 (2006). - PubMed
    1. Karch C. M. & Goate A. M. Alzheimer’s disease risk genes and mechanisms of disease pathogenesis. Biological psychiatry 77, 43–51 (2015). - PMC - PubMed
    1. Bagyinszky E., Giau V. Van & An S. A. Transcriptomics in Alzheimer’s Disease: Aspects and Challenges. International journal of molecular sciences 21, (2020). - PMC - PubMed
    1. Yang H.-S. et al. Genetics of Gene Expression in the Aging Human Brain Reveal TDP-43 Proteinopathy Pathophysiology. Neuron 107, 496–508.e6 (2020). - PMC - PubMed

Publication types

LinkOut - more resources