[Preprint]. 2024 Feb 5:2024.02.05.578900.
doi: 10.1101/2024.02.05.578900.

CD40 Expression by B cells is Required for Optimal Immunity to Murine Pneumocystis Infection

Affiliations

CD40 Expression by B cells is Required for Optimal Immunity to Murine Pneumocystis Infection

Monica Sassi et al. bioRxiv. .

Update in

Abstract

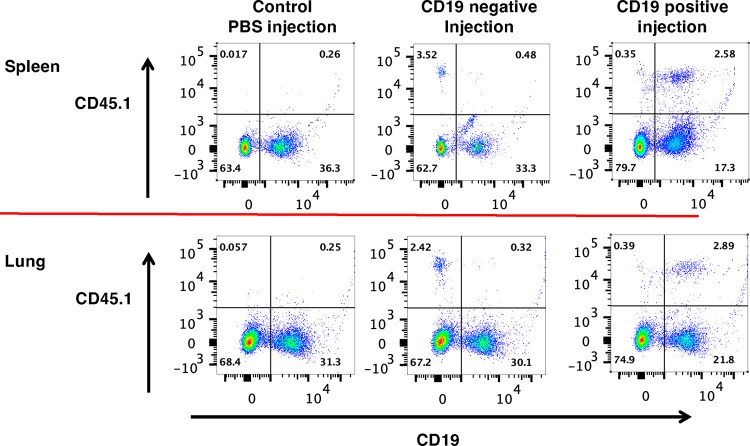
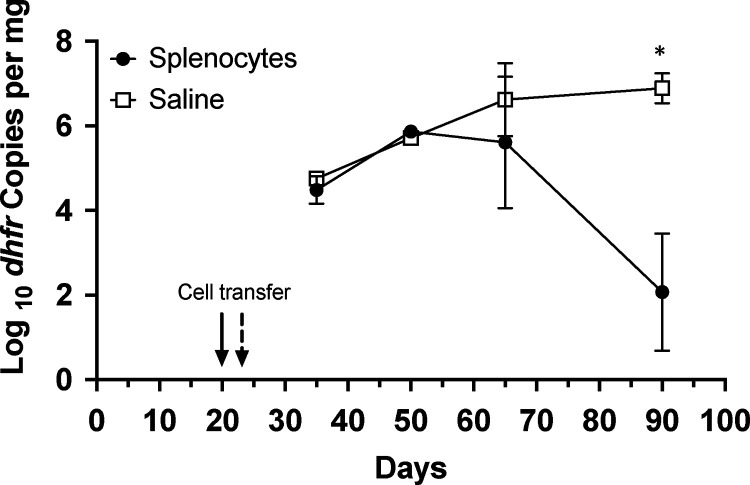
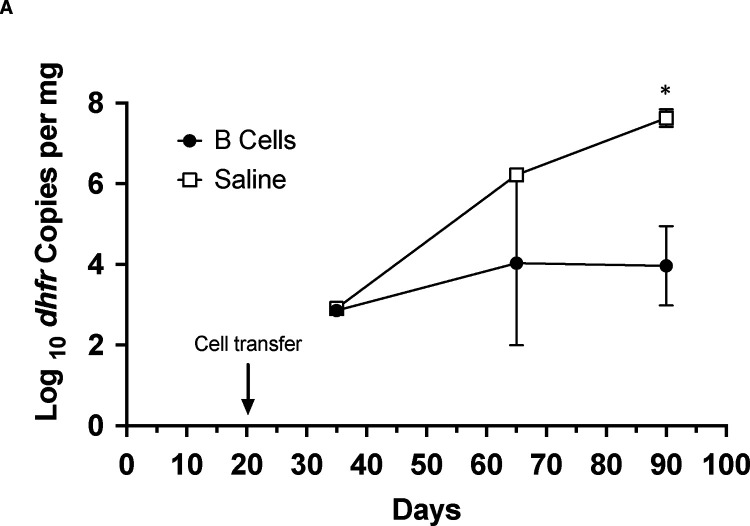
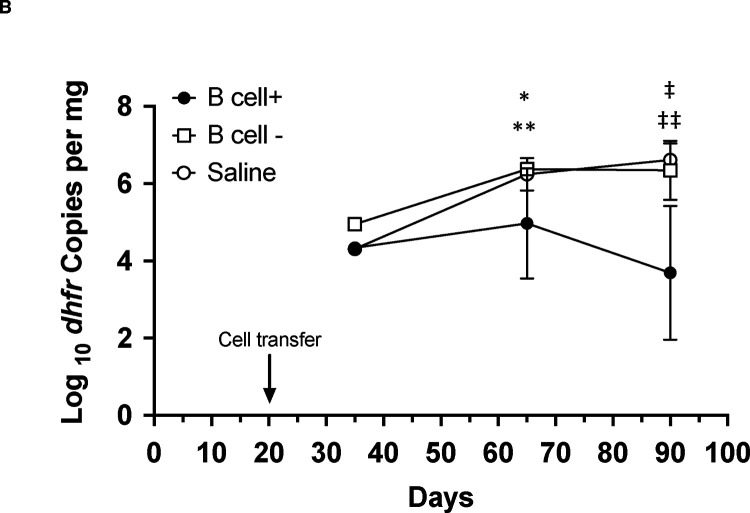
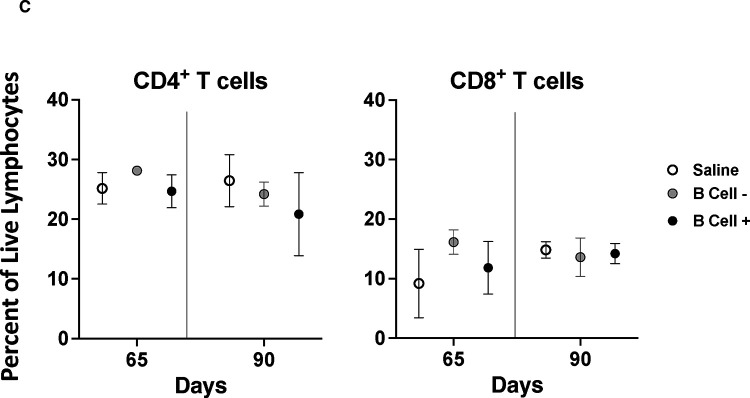
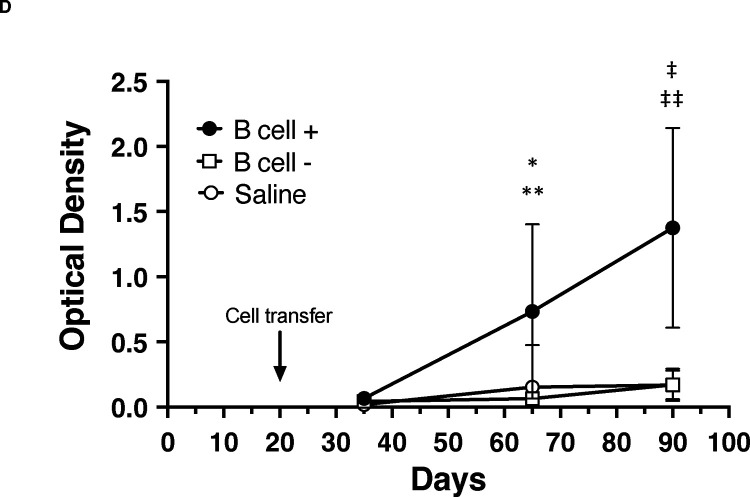
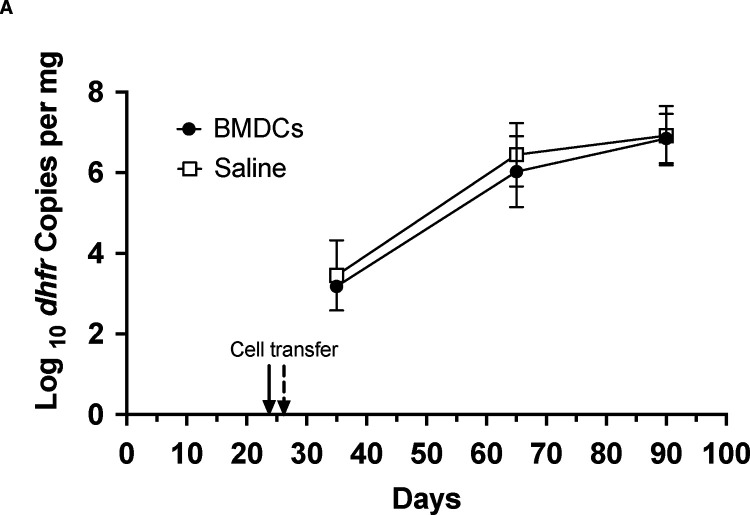
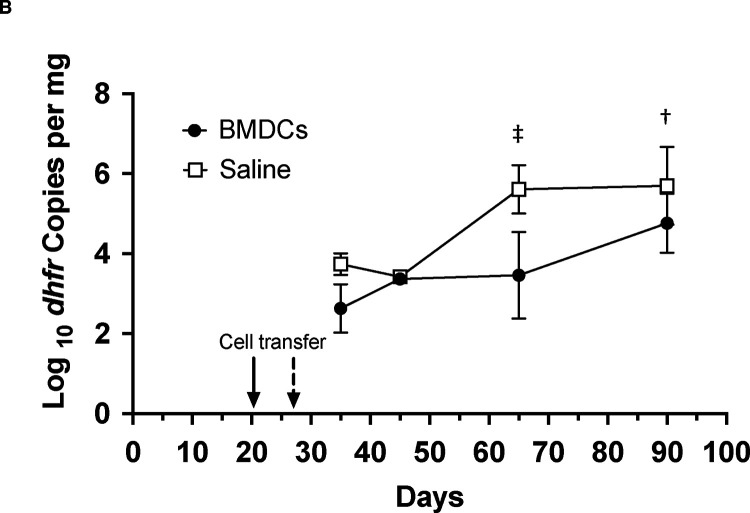
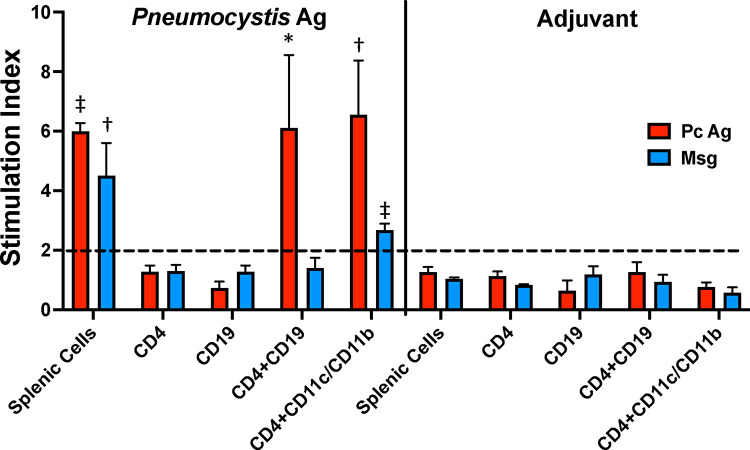
CD40-CD40L interactions are critical for controlling Pneumocystis infection. However, which CD40-expressing cell populations are important for this interaction have not been well-defined. We used a cohousing mouse model of Pneumocystis infection, combined with flow cytometry and qPCR, to examine the ability of different populations of cells from C57BL/6 mice to reconstitute immunity in CD40 knockout (KO) mice. Unfractionated splenocytes, as well as purified B cells, were able to control Pneumocystis infection, while B cell depleted splenocytes and unstimulated bone-marrow derived dendritic cells (BMDCs) were unable to control infection in CD40 KO mice. Pneumocystis antigen-pulsed BMDCs showed early, but limited, control of infection. Consistent with recent studies that have suggested a role for antigen presentation by B cells, using cells from immunized animals, B cells were able to present Pneumocystis antigens to induce proliferation of T cells. Thus, CD40 expression by B cells appears necessary for robust immunity to Pneumocystis.


Figures

Figure 1.
Figure 1.
Flow cytometry analysis of lung and spleen cells following transfer of CD19− cells or CD19+ B cells; gating was on live cells, then lymphocytes, then CD19 and CD45.1. Representative results are shown for spleen and lung cells from CD40 KO mice exposed to a Pneumocystis-infected seeder for 65 days. The exposed mice were reconstituted at day 20 with PBS (control) or with CD19+ B cells (positive), or with CD19 depleted (negative) spleen cells. Transferred B cells (CD45.1+/CD19+) were detected in the spleen and lung of the mouse that received CD19+ B cells, while transferred non-B cells were detected in the mouse that received cells that had been depleted of CD19+ B cells. Neither population was detected in the mouse that had received PBS.
Figure 2.
Figure 2.
Transfer of splenocytes controls P. murina infection in CD40 KO mice. CD40 KO mice were cohoused with a P. murina infected seeder beginning at day 0. At day 20 (Cage 1) or 24 (cage 2) mice were injected via tail-vein with either PBS or ~50 million splenocytes from C57BL/6 mice. Organism loads were deteremined by qPCR targeting the single copy dfhr gene, and are expressed as dhfr copies per mg lung tissue. Data represent the geometric mean ± SD for 2–4 mice per time-point for the splenocyte group, and 1 (day 50) to 2 mice per time-point for the PBS control group. P value is shown for the difference between the 2 groups, using Student’s unpaired t-test. *, p<0.05
Figure 3.
Figure 3.
Transfer of B cells is sufficient to control P. murina infection in CD40 KO mice. A. CD40 KO mice were cohoused with a P. murina infected seeder beginning at day 0. At day 20 mice were injected via tail-vein with either PBS or ~28 million CD19+ B cells from C57BL/6 mice. For A and B, organism loads were deteremined by qPCR targeting the single copy dfhr gene, and are expressed as dhfr copies per mg lung tissue. Data represent the geometric mean ± SD for 2–3 mice per time-point for the splenocyte group, and 1 (days 25 and 65) to 2 (day 90) mice per time-point for the PBS control group. Student’s unpaired t-test was used to compare the groups at each time-point. *, p=0.02 B. CD40 KO mice cohoused as above received either CD19+ B cells (B cell+, ~50 million cells/mouse), splenocytes that had been depleted of CD19+ B cells (B cell-, ~15–25 million cells/mouse) or saline at day 20. For these studies the focus was on later time-points (days 65 and 90), when the differences were seen in the prior studies, to allow for greater numbers of mice at each of these time-points, given the restrictions on the number of mice permitted per cage. In one experiment, no flow data were available due to technical difficulties at the day 65 timepoint; all animals from that time-point were included in the analysis. Data represent the geometric mean ± SD; number of mice per time-point is as follows: day 35, n=1 for each group; day 65, 7 to 12 per group; day 90, 6 to 9 per group. Student’s unpaired t-test was used to compare the different groups at each time-point. *, p=0.02 for B cell+ vs B cell; **, p=0.02 for B cell+ vs saline; ‡, p=0.005 for B cell+ vs B cell; ‡ ‡, p=0.0002 for B cell+ vs saline. C. CD4+ (left) and CD8+ (right) T cells, as determined by flow cytometry and shown as a percent of live lymphocytes, for the 3 groups at days 65 and 90. Symbols represent mean, error bars represent standard deviation. No significant differences were seen among the groups at either time-poiint. D. Anti-Pneumocystis antibodies, as determined by ELISA, for the animals in B, demonstrated that mice receiving CD19+ B cells developed antibodies by day 65 with a further increase by day 90, while no antibodies developed in the other 2 groups. Data represent the mean ± SD. Student’s unpaired t-test was used to compare the different groups at each time-point. *, p=0.02 for B cell+ vs B cell; **, p=0.03 for B cell+ vs saline; ‡, p=0.001 for B cell+ vs B cell; ‡ ‡, p=0.0003 for B cell+ vs saline.
Figure 3.
Figure 3.
Transfer of B cells is sufficient to control P. murina infection in CD40 KO mice. A. CD40 KO mice were cohoused with a P. murina infected seeder beginning at day 0. At day 20 mice were injected via tail-vein with either PBS or ~28 million CD19+ B cells from C57BL/6 mice. For A and B, organism loads were deteremined by qPCR targeting the single copy dfhr gene, and are expressed as dhfr copies per mg lung tissue. Data represent the geometric mean ± SD for 2–3 mice per time-point for the splenocyte group, and 1 (days 25 and 65) to 2 (day 90) mice per time-point for the PBS control group. Student’s unpaired t-test was used to compare the groups at each time-point. *, p=0.02 B. CD40 KO mice cohoused as above received either CD19+ B cells (B cell+, ~50 million cells/mouse), splenocytes that had been depleted of CD19+ B cells (B cell-, ~15–25 million cells/mouse) or saline at day 20. For these studies the focus was on later time-points (days 65 and 90), when the differences were seen in the prior studies, to allow for greater numbers of mice at each of these time-points, given the restrictions on the number of mice permitted per cage. In one experiment, no flow data were available due to technical difficulties at the day 65 timepoint; all animals from that time-point were included in the analysis. Data represent the geometric mean ± SD; number of mice per time-point is as follows: day 35, n=1 for each group; day 65, 7 to 12 per group; day 90, 6 to 9 per group. Student’s unpaired t-test was used to compare the different groups at each time-point. *, p=0.02 for B cell+ vs B cell; **, p=0.02 for B cell+ vs saline; ‡, p=0.005 for B cell+ vs B cell; ‡ ‡, p=0.0002 for B cell+ vs saline. C. CD4+ (left) and CD8+ (right) T cells, as determined by flow cytometry and shown as a percent of live lymphocytes, for the 3 groups at days 65 and 90. Symbols represent mean, error bars represent standard deviation. No significant differences were seen among the groups at either time-poiint. D. Anti-Pneumocystis antibodies, as determined by ELISA, for the animals in B, demonstrated that mice receiving CD19+ B cells developed antibodies by day 65 with a further increase by day 90, while no antibodies developed in the other 2 groups. Data represent the mean ± SD. Student’s unpaired t-test was used to compare the different groups at each time-point. *, p=0.02 for B cell+ vs B cell; **, p=0.03 for B cell+ vs saline; ‡, p=0.001 for B cell+ vs B cell; ‡ ‡, p=0.0003 for B cell+ vs saline.
Figure 4.
Figure 4.
Transfer of BMDCs is insufficient to control P. murina infection in CD40 KO mice. A. CD40 KO mice were cohoused with a P. murina infected seeder beginning at day 0. At day 24–26 mice were injected via tail-vein with either PBS or ~2.5–12 million BMDCs from C57BL/6 mice. For A and B, organism loads were deteremined by qPCR targeting the single copy dfhr gene, and are expressed as dhfr copies per mg lung tissue. Data represent the geometric mean ± SD for 2–5 mice per time-point for the BMDC group, and 2–3 mice per time-point for the PBS control group. B. CD40 KO mice cohoused as above received either PBS or 10 million antigen-primed BMDCs at day 20 (5 cages) or 27 (1 cage); the BMDCs had been incubated with a crude P. murina antigen overnight prior to trasfer. For the latter cage one mouse from each group was harvested at day 45 rather than day 35 as the earliest time-point. For the other times, data represent the geometric mean ± SD for 4–15 mice per time-point for the BMDC group, and 2–11 mice per time-point for the PBS control group. Student’s unpaired t-test was used to compare the groups at each time-point. †, p=0.01; ‡, p=0.001
Figure 4.
Figure 4.
Transfer of BMDCs is insufficient to control P. murina infection in CD40 KO mice. A. CD40 KO mice were cohoused with a P. murina infected seeder beginning at day 0. At day 24–26 mice were injected via tail-vein with either PBS or ~2.5–12 million BMDCs from C57BL/6 mice. For A and B, organism loads were deteremined by qPCR targeting the single copy dfhr gene, and are expressed as dhfr copies per mg lung tissue. Data represent the geometric mean ± SD for 2–5 mice per time-point for the BMDC group, and 2–3 mice per time-point for the PBS control group. B. CD40 KO mice cohoused as above received either PBS or 10 million antigen-primed BMDCs at day 20 (5 cages) or 27 (1 cage); the BMDCs had been incubated with a crude P. murina antigen overnight prior to trasfer. For the latter cage one mouse from each group was harvested at day 45 rather than day 35 as the earliest time-point. For the other times, data represent the geometric mean ± SD for 4–15 mice per time-point for the BMDC group, and 2–11 mice per time-point for the PBS control group. Student’s unpaired t-test was used to compare the groups at each time-point. †, p=0.01; ‡, p=0.001
Figure 5.
Figure 5.
B cells can present P. murina antigens in vitro. A cell proliferation assay was used to determine if Pneumocystis antigens, presented by B cells or dendritic cells plus monocytes, could induce CD4+ T cells to proliferate. Spleen cells from 3–4 C57BL/6 mice that had been previously immunized with 20 μg crude P. murina antigen or adjuvant alone were combined and purified by cell sorting to provide populations of CD4+ T cells, CD19+ B cells, and CD11c+/CD11b+ DCs and monocytes. Purified CD4+ T cells (44,000/well) were cultured for 5 days either alone or co-incubated with B cells (50,000/well) or DCs/monocytes (5,000 cells/well) incubated with P. murina antigen (20 μg/ml), purified Msg (10 μg/ml) or media alone; results are shown as the stimulation index. CD4+ T cells or B cells cultured alone and unpurified splenocytes served as controls. Results are shown as mean stimulation index of 3 replicates for each condition, and are shown for one of 2 experiments with similar results. P values are shown for the difference between the RLU of the antigen incubated wells vs. no antigen control wells, using Student’s unpaired t-test. *, p<0.05; †, p<0.01; ‡, p<0.001.

Similar articles

References

    1. Kovacs JA, Masur H. Evolving health effects of Pneumocystis: one hundred years of progress in diagnosis and treatment. JAMA 2009;301:2578–85 - PubMed
    1. Thomas CF Jr., Limper AH. Pneumocystis pneumonia. N. Engl. J. Med. 2004;350:2487–98 - PubMed
    1. Levy J, Espanol-Boren T, Thomas C, et al. Clinical spectrum of X-linked hyper-IgM syndrome. J. Pediatr. 1997;131:47–54 - PubMed
    1. Maini R, Henderson KL, Sheridan EA, et al. Increasing Pneumocystis pneumonia, England, UK, 2000–2010. Emerg. Infect. Dis. 2013;19:386–92 - PMC - PubMed
    1. Martin SI, Fishman JA. Pneumocystis pneumonia in solid organ transplantation. Am. J. Transplant. 2013;13 Suppl 4:272–9 - PubMed

Publication types