

Identification of a gene network driving the attenuated response to lipopolysaccharide of monocytes from hypertensive coronary artery disease patients
- PMID: 38410507
- PMCID: PMC10894924
- DOI: 10.3389/fimmu.2024.1286382
Identification of a gene network driving the attenuated response to lipopolysaccharide of monocytes from hypertensive coronary artery disease patients
Abstract
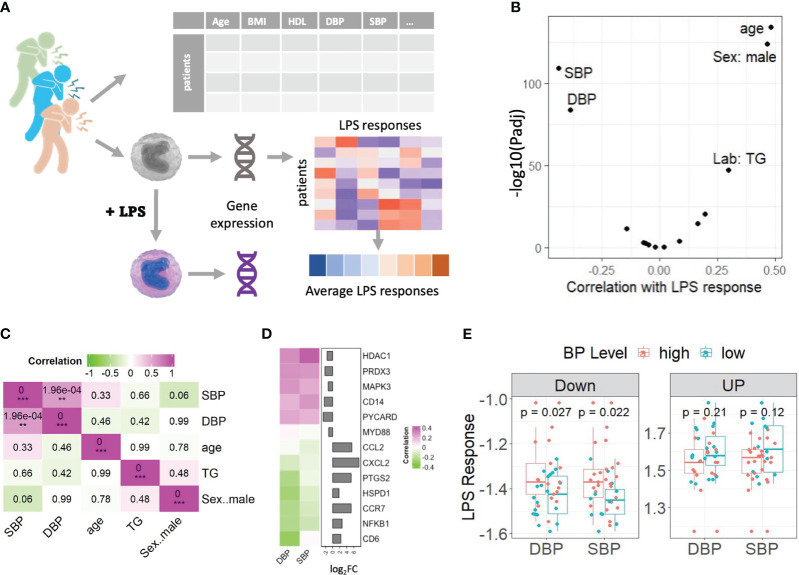
Introduction: The impact of cardiovascular disease (CVD) risk factors, encompassing various biological determinants and unhealthy lifestyles, on the functional dynamics of circulating monocytes-a pivotal cell type in CVD pathophysiology remains elusive. In this study, we aimed to elucidate the influence of CVD risk factors on monocyte transcriptional responses to an infectious stimulus.
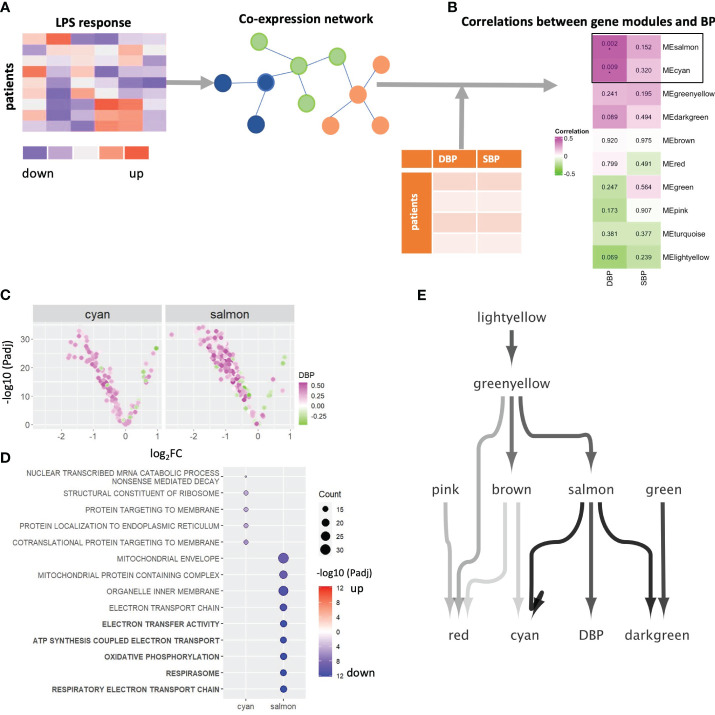
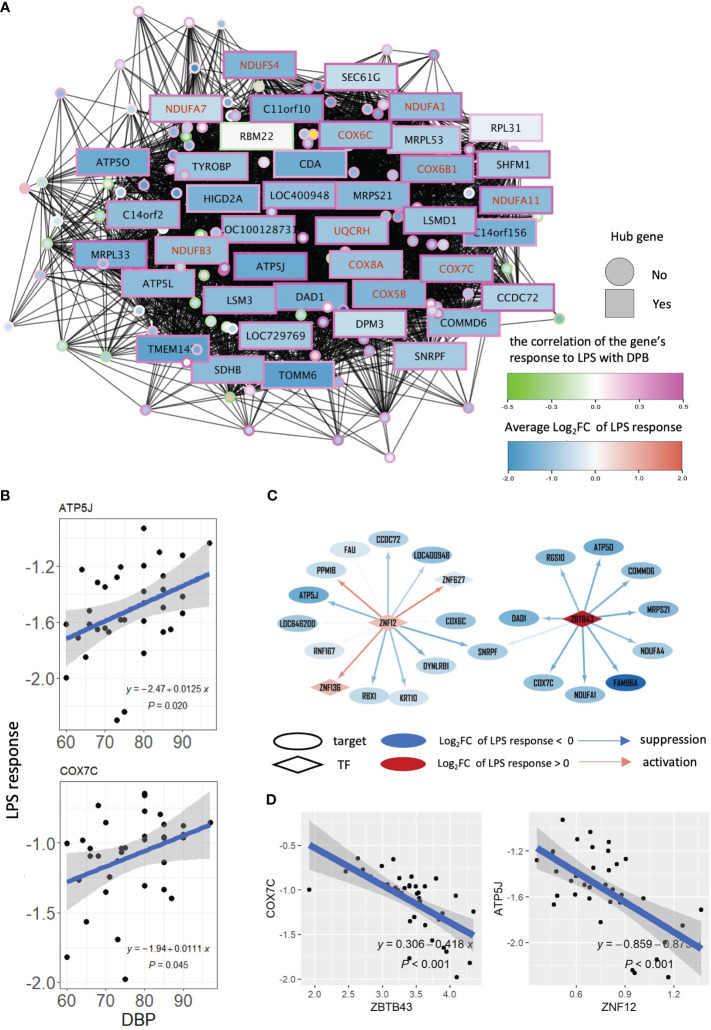
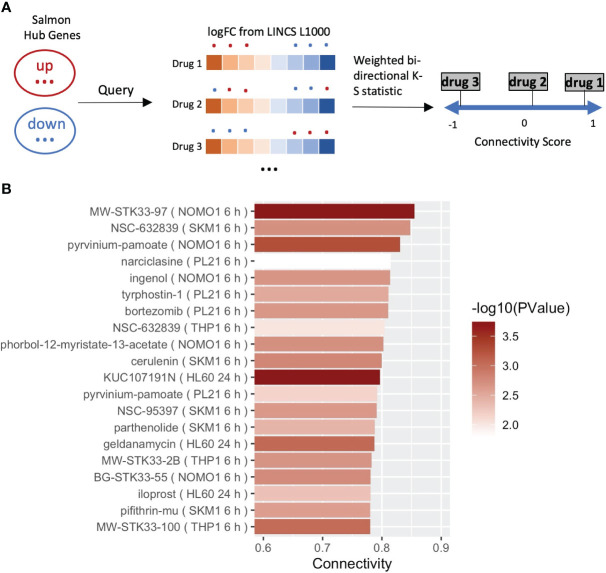
Methods: We conducted a comparative analysis of monocyte gene expression profiles from the CTMM - CIRCULATING CELLS Cohort of coronary artery disease (CAD) patients, at baseline and after lipopolysaccharide (LPS) stimulation. Gene co-expression analysis was used to identify gene modules and their correlations with CVD risk factors, while pivotal transcription factors controlling the hub genes in these modules were identified by regulatory network analyses. The identified gene module was subjected to a drug repurposing screen, utilizing the LINCS L1000 database.
Results: Monocyte responsiveness to LPS showed a highly significant, negative correlation with blood pressure levels (ρ< -0.4; P<10-80). We identified a ZNF12/ZBTB43-driven gene module closely linked to diastolic blood pressure, suggesting that monocyte responses to infectious stimuli, such as LPS, are attenuated in CAD patients with elevated diastolic blood pressure. This attenuation appears associated with a dampening of the LPS-induced suppression of oxidative phosphorylation. Finally, we identified the serine-threonine inhibitor MW-STK33-97 as a drug candidate capable of reversing this aberrant LPS response.
Conclusions: Monocyte responses to infectious stimuli may be hampered in CAD patients with high diastolic blood pressure and this attenuated inflammatory response may be reversed by the serine-threonine inhibitor MW-STK33-97. Whether the identified gene module is a mere indicator of, or causal factor in diastolic blood pressure and the associated dampened LPS responses remains to be determined.
Keywords: circulating monocytes; coronary artery disease; gene regulatory network; hypertension; inflammatory responses.
Copyright © 2024 Lu, Donners, de Baaij, Jin, Otten, Manca, van Zonneveld, Jukema, Kraaijeveld, Kuiper, Pasterkamp, Mees, Sluimer, Cavill, Karel, Goossens and Biessen.
Conflict of interest statement
The authors declare that the research was conducted in the absence of any commercial or financial relationships that could be construed as a potential conflict of interest.
Figures
Similar articles
-
Suppression of inflammatory signaling in monocytes from patients with coronary artery disease.J Mol Cell Cardiol. 2009 Feb;46(2):177-85. doi: 10.1016/j.yjmcc.2008.10.029. Epub 2008 Nov 14. J Mol Cell Cardiol. 2009. PMID: 19059264
-
Monocyte and macrophage subtypes as paired cell biomarkers for coronary artery disease.Exp Physiol. 2019 Sep;104(9):1343-1352. doi: 10.1113/EP087827. Epub 2019 Jul 25. Exp Physiol. 2019. PMID: 31264265 Free PMC article.
-
Regulation of monocyte subset proinflammatory responses within the lung microvasculature by the p38 MAPK/MK2 pathway.Am J Physiol Lung Cell Mol Physiol. 2011 Nov;301(5):L812-21. doi: 10.1152/ajplung.00092.2011. Epub 2011 Aug 26. Am J Physiol Lung Cell Mol Physiol. 2011. PMID: 21873449 Free PMC article.
-
Monocyte gene expression and coronary artery disease.Curr Opin Clin Nutr Metab Care. 2013 Jul;16(4):411-7. doi: 10.1097/MCO.0b013e32836236f9. Curr Opin Clin Nutr Metab Care. 2013. PMID: 23739627 Review.
-
The sentinels of coronary artery disease: heterogeneous monocytes.Front Immunol. 2025 Feb 26;16:1428978. doi: 10.3389/fimmu.2025.1428978. eCollection 2025. Front Immunol. 2025. PMID: 40079002 Free PMC article. Review.
References
Publication types
MeSH terms
Substances
LinkOut - more resources
Full Text Sources
Medical
Molecular Biology Databases
Miscellaneous