. 2024 Feb 12:15:1335675.
doi: 10.3389/fimmu.2024.1335675. eCollection 2024.

Identification of cuproptosis-related gene clusters and immune cell infiltration in major burns based on machine learning models and experimental validation

Affiliations

Identification of cuproptosis-related gene clusters and immune cell infiltration in major burns based on machine learning models and experimental validation

Xin Wang et al. Front Immunol. .

Abstract

Introduction: Burns are a global public health problem. Major burns can stimulate the body to enter a stress state, thereby increasing the risk of infection and adversely affecting the patient's prognosis. Recently, it has been discovered that cuproptosis, a form of cell death, is associated with various diseases. Our research aims to explore the molecular clusters associated with cuproptosis in major burns and construct predictive models.

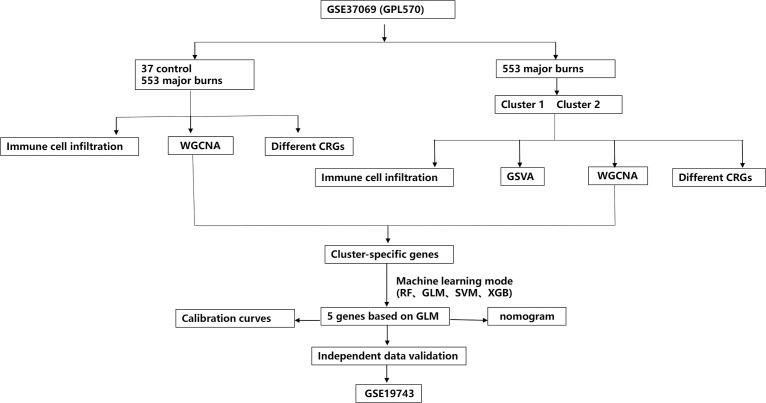
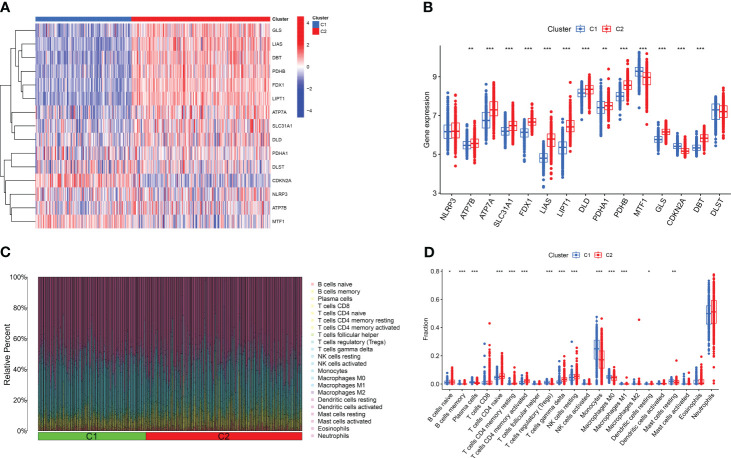
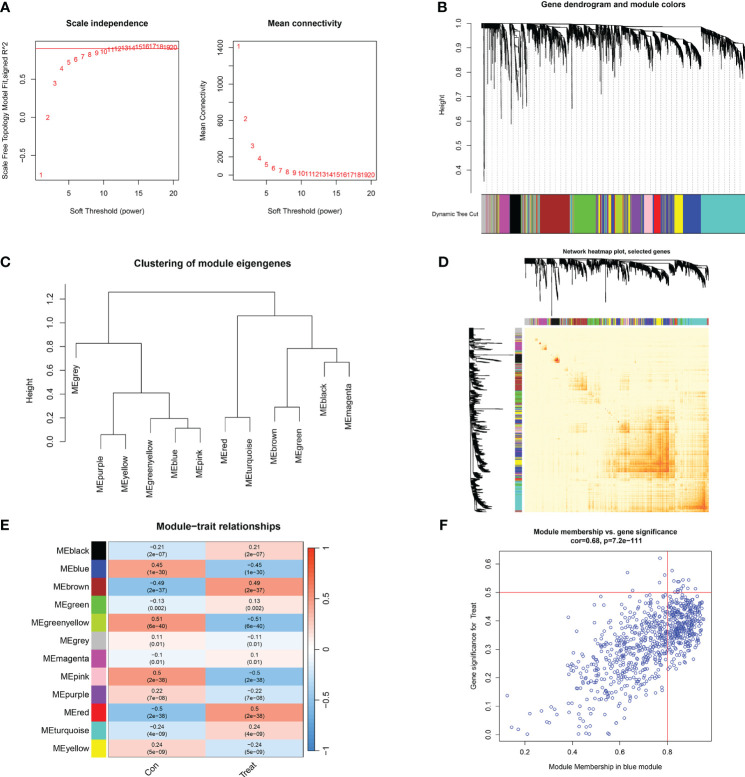
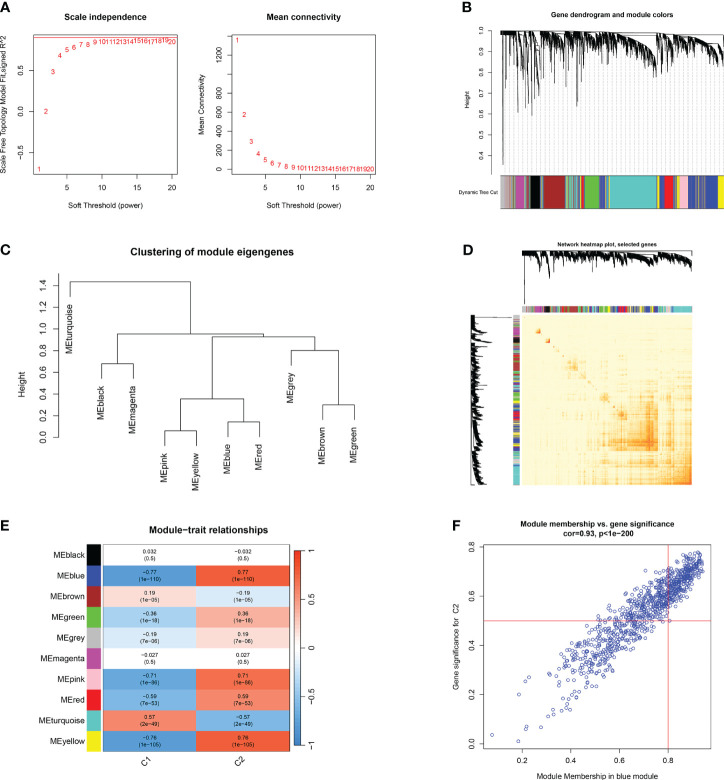
Methods: We analyzed the expression and immune infiltration characteristics of cuproptosis-related factors in major burn based on the GSE37069 dataset. Using 553 samples from major burn patients, we explored the molecular clusters based on cuproptosis-related genes and their associated immune cell infiltrates. The WGCNA was utilized to identify cluster-specific genes. Subsequently, the performance of different machine learning models was compared to select the optimal model. The effectiveness of the predictive model was validated using Nomogram, calibration curves, decision curves, and an external dataset. Finally, five core genes related to cuproptosis and major burn have been was validated using RT-qPCR.

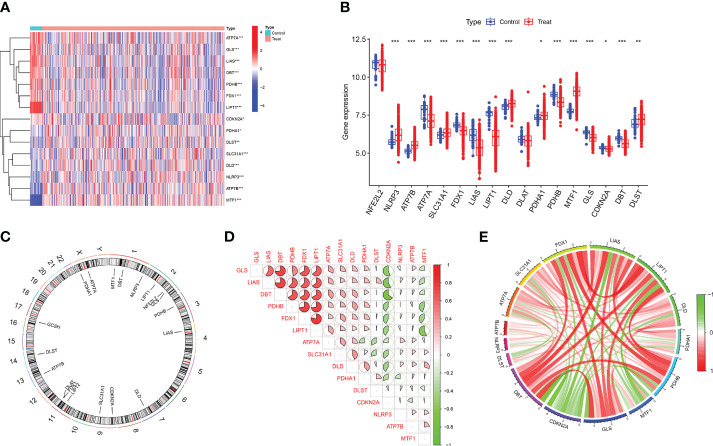
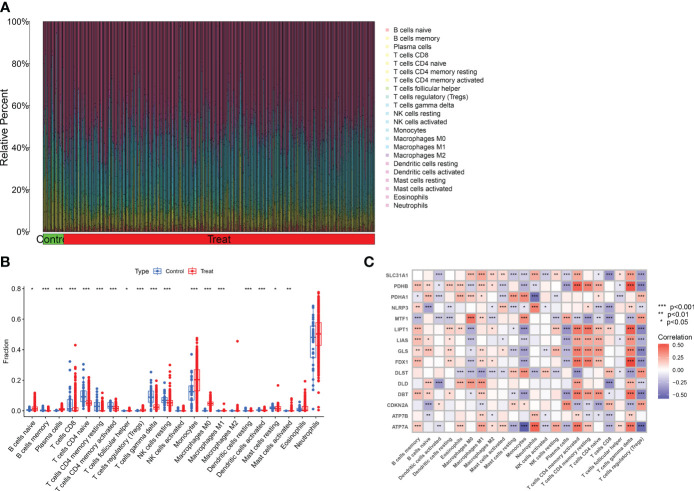
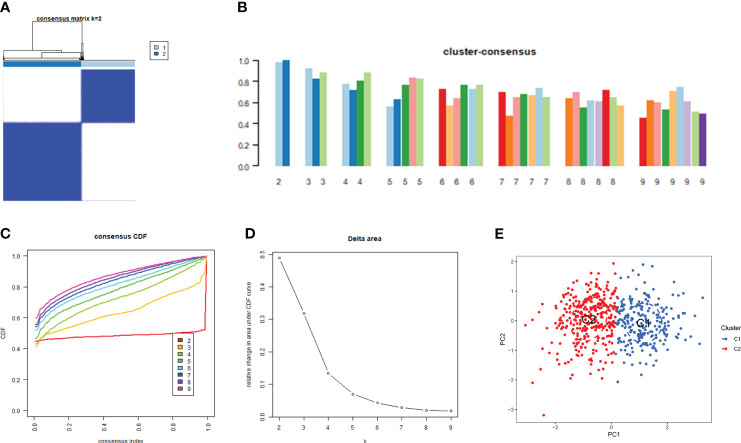
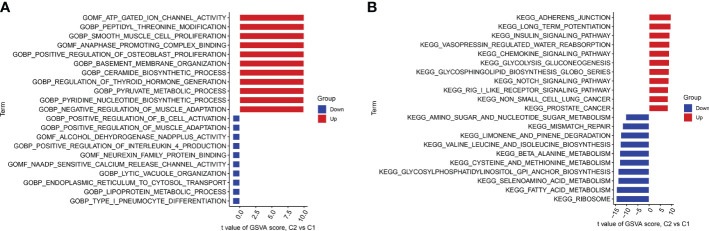
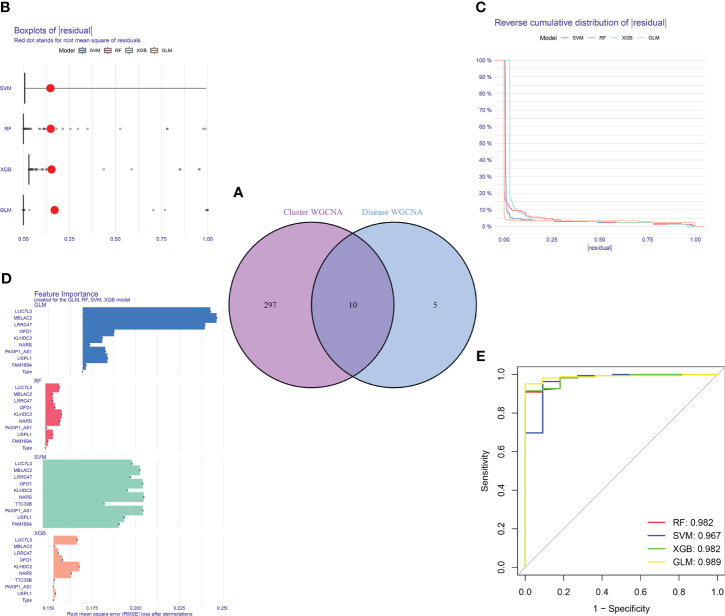
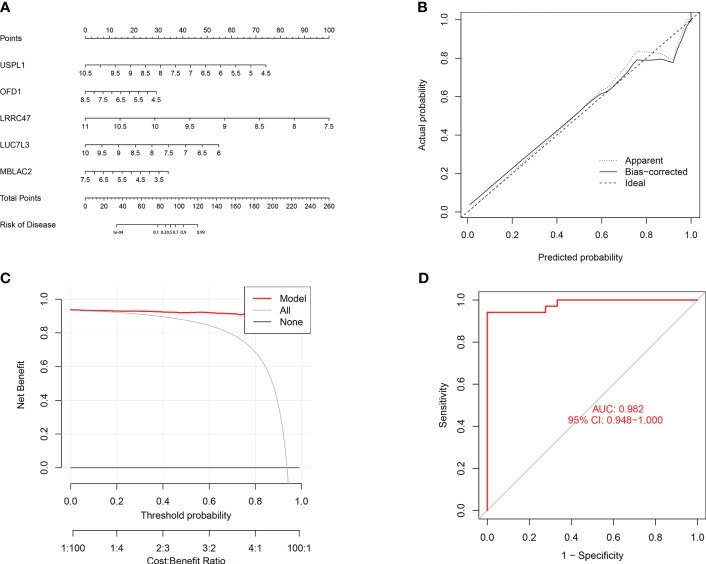
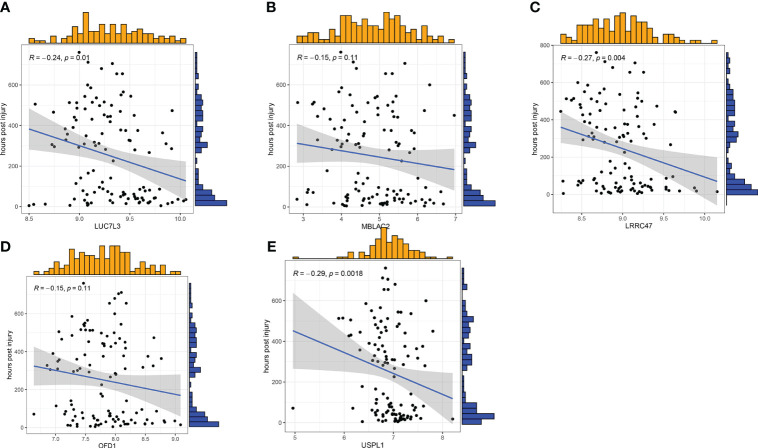
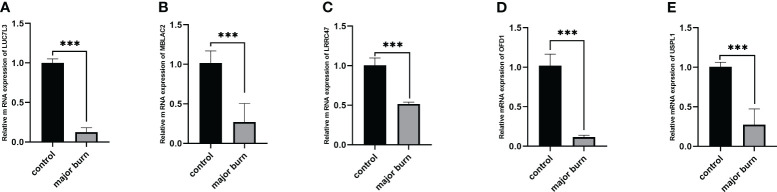
Results: In both major burn and normal samples, we determined the cuproptosis-related genes associated with major burns through WGCNA analysis. Through immune infiltrate profiling analysis, we found significant immune differences between different clusters. When K=2, the clustering number is the most stable. GSVA analysis shows that specific genes in cluster 2 are closely associated with various functions. After identifying the cross-core genes, machine learning models indicate that generalized linear models have better accuracy. Ultimately, a generalized linear model for five highly correlated genes was constructed, and validation with an external dataset showed an AUC of 0.982. The accuracy of the model was further verified through calibration curves, decision curves, and modal graphs. Further analysis of clinical relevance revealed that these correlated genes were closely related to time of injury.

Conclusion: This study has revealed the intricate relationship between cuproptosis and major burns. Research has identified 15 cuproptosis-related genes that are associated with major burn. Through a machine learning model, five core genes related to cuproptosis and major burn have been selected and validated.

Keywords: cuproptosis; immune infiltration; machine learning; major burns; molecular clusters.


Conflict of interest statement

The authors declare that the research was conducted in the absence of any commercial or financial relationships that could be construed as a potential conflict of interest.

Figures

Figure 1
Figure 1
The study flow chart.
Figure 2
Figure 2
Identification of differentially expressed CRGs in patients with major burn. (A) The expression patterns of 15 DE-CRGs were presented in the heatmap. (B) Boxplots showed the expression of 17 major burn-related CRGs between the control group and the major burn group. (C) The location of 19 CRGs on chromosomes. (D) Correlation analysis of 15 differentially expressed CRGs. Red and green colors respectively represent positive and negative correlations. The correlation coefficients were marked with the area of the pie chart. (E) Gene relationship network diagram of 15 differentially expressed CRGs. (*p<0.05, **p<0.01, ***p<0.001).
Figure 3
Figure 3
Analysis of immune cell infiltration in patients with major burn. (A) CIBERSORT analysis revealed differences in the abundance of 22 infiltrating immune cell types between the major burn and control groups. (B) Boxplots showed the differences in immune infiltrating between major burn and control groups. (C) correlation analysis between 15 DE- CRGs and infiltrated immune cells. *p<0.05, **p<0.01, ***p<0.001.
Figure 4
Figure 4
Identification of cuproptosis-related molecular clusters in major burns. (A) Consensus clustering matrix when k = 2. (B–D) the score of consensus clustering (B) Representative cumulative distribution function (CDF) curves (C), CDF delta area curves (D). (E) PCA visualizes the distribution of two subtypes.
Figure 5
Figure 5
Comparison of CRGs expression and immune cell infiltration between molecular subtypes of major burns. (A) Distinct CRGs expression profiles were observed between Cluster 1 and Cluster 2. (B) Boxplots showed the expression of 15 CRGs between two cuproptosis clusters. (C) The difference in the abundance of 22 infiltrating immune cell types between the two clusters. (D) Boxplots showed the differences in immune infiltrating between two cuproptosis clusters. *p<0.05, **p<0.01, ***p<0.001.
Figure 6
Figure 6
GSVA t-value ranking differences in biological characteristics between two cuproptosis clusters. (A) Differences in biological functions between Cluster1 and Cluster2 samples ranked by t-value of GSVA method. (B) Differences in hallmark pathway activities between Cluster1 and Cluster2 samples ranked by t-value of GSVA method.
Figure 7
Figure 7
Co-expression network of differentially expressed genes in major burns. (A) Selection of soft threshold power. (B) Dendrogram of co-expression module clustering. (C) Representative clustering of module characteristic genes. (D) Representative heat map of correlations between 12 modules. (E) Correlation analysis between module characteristic genes and clinical states. Each row represents a module, and each column represents a clinical state. (F) Scatter plot of module membership in the blue module and significance of genes in major burns.
Figure 8
Figure 8
Co-expression network of differentially expressed genes between two clusters of CRGs. (A) Selection of soft threshold power. (B) Dendrogram of co-expression module clustering. (C) Representative clustering of module characteristic genes. (D) Representative heat map of correlations between 10 modules. (E) Correlation analysis between module characteristic genes and clinical states. Each row represents a module, and each column represents a clinical state. (F) Scatter plot of module membership in the blue module and significance of genes in Cluster1.
Figure 9
Figure 9
Construction and evaluation of RF, SVM, GLM, and XGB machine models. (A) Identification of the intersected genes of disease WGCNA and cluster-WGCNA. The intersection of hub genes in the two modules yielded 10 genes. (B) Cumulative residual distribution of each machine learning model. (C) Boxplots showed the residuals of each machine learning model. Red dot represented the root mean square of residuals (RMSE). (D) The important features in RF, SVM, GLM, and XGB machine models. (E) ROC analysis of four machine learning models based on 5-fold cross-validation in the testing cohort.
Figure 10
Figure 10
Validation of the 5-gene-based GLM model. (A) Construction of a nomogram for predicting the risk of major burn clusters based on the 5-gene-based GLM Model. (B, C) Construction of calibration curve (B) and DCA (C) for assessing the predictive efficiency of the nomogram model. (D) the ROC curve of the five genes of the GLM model. the ROC curve of the five genes of the GLM model exhibited good performance (AUC= 0.982).
Figure 11
Figure 11
Correlation analysis between gene expression and disease status in an independent dataset of patients with major burn. (A–E) Correlation between the 5 genes and active/latent major burn. LUC7L3, LRRC47 and USPL1 were negatively correlated with major burn.
Figure 12
Figure 12
Expression analysis of 5 GENES in major burns and controls. (A–E) Differences in mRNA levels of 5 genes between the major burns and control groups. ***p < 0.001.

Similar articles

References

    1. Bailey ME, Sagiraju HKR, Mashreky SR, Alamgir H. Epidemiology and outcomes of burn injuries at a tertiary burn care center in Bangladesh. Burns (2019) 45(4):957–63. doi: 10.1016/j.burns.2018.12.011 - DOI - PubMed
    1. Forbinake NA, Ohandza CS, Fai KN, Agbor VN, Asonglefac BK, Aroke D, et al. . Mortality analysis of burns in a developing country: a CAMEROONIAN experience. BMC Public Health (2020) 20(1):1269. doi: 10.1186/s12889-020-09372-3 - DOI - PMC - PubMed
    1. Udy AA, Roberts JA, Lipman J, Blot S. The effects of major burn related pathophysiological changes on the pharmacokinetics and pharmacodynamics of drug use: An appraisal utilizing antibiotics. Adv Drug Delivery Rev (2018) 123:65–74. doi: 10.1016/j.addr.2017.09.019 - DOI - PubMed
    1. Chen L, Min J, Wang F. Copper homeostasis and cuproptosis in health and disease. Signal Transduct Target Ther (2022) 7(1):378. doi: 10.1038/s41392-022-01229-y - DOI - PMC - PubMed
    1. Tang D, Chen X, Kroemer G. Cuproptosis: a copper-triggered modality of mitochondrial cell death. Cell Res (2022) 32(5):417–8. doi: 10.1038/s41422-022-00653-7 - DOI - PMC - PubMed

Publication types