

VE/VCO2 slope threshold optimization for preoperative evaluation in lung cancer surgery: identifying true high- and low-risk groups
- PMID: 38410536
- PMCID: PMC10894426
- DOI: 10.21037/jtd-23-1292
VE/VCO2 slope threshold optimization for preoperative evaluation in lung cancer surgery: identifying true high- and low-risk groups
Abstract
Background: Cardiopulmonary exercise testing (CPET) enables measurement of the slope of the increase in minute ventilation in relation to carbon dioxide elimination during exercise (the VE/VCO2 slope). Several studies have shown that the VE/VCO2 slope is a strong marker for postoperative complications and mortality. However, current thresholds for adverse outcomes are generated from historical data in heart failure patients.
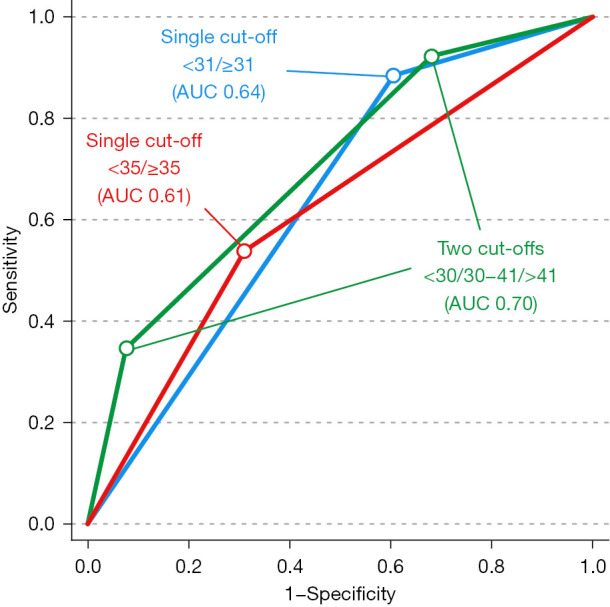
Methods: This was a retrospective analysis of 158 patients with lung cancer who underwent lobectomy or pneumonectomy during 2008-2020. The main outcome was major pulmonary complications (MPC) or death ≤30 days of cancer surgery. Patients were first categorized using two different single threshold approaches; the traditional threshold of 35 and the highest Youden value from the receiver operating curve (ROC) analysis. Secondly, patients were categorized into three risk groups using two thresholds. These two thresholds were determined in an ROC analysis, where the VE/VCO2 slope values generating either a 90% sensitivity (lower threshold) or a 90% specificity (upper threshold) for the main outcome were chosen. The frequency of complications was compared using Chi2. The overall model quality was evaluated by an area under the curve (AUC) analysis. Positive predictive values (PPVs) and negative predictive values (NPVs) are presented.
Results: The two thresholds, <30 (90% sensitivity) and >41 (90% specificity), created three risk groups: low risk (VE/VCO2 slope <30, n=44, 28%); intermediate risk (VE/VCO2 slope 30-41, n=95, 60%) and high risk (VE/VCO2 slope >41, n=19, 12%). The frequency of complications differed between groups: 5%, 16% and 47% (P<0.001). Using two thresholds compared to one threshold increased the overall model quality (reaching AUC 0.70, 95% confidence interval: 0.59-0.81), and identified a high sensitivity threshold (VE/VCO2 slope <30) which generated a NPV of 95% but importantly, also a high specificity threshold (VE/VCO2 slope >41) with a PPV of 47%.
Conclusions: Risk stratification based on three risk groups from the preoperative VE/VCO2 slope increased the model quality, was more discriminative and generated better PPV and NPV compared to traditional risk stratification into two risk groups.
Keywords: Cardiopulmonary exercise testing (CPET); exercise capacity; functional capacity; ventilatory efficiency.
2024 Journal of Thoracic Disease. All rights reserved.
Conflict of interest statement
Conflicts of Interest: All authors have completed the ICMJE uniform disclosure form (available at https://jtd.amegroups.com/article/view/10.21037/jtd-23-1292/coif). The authors have no conflicts of interest to declare.
Figures
Similar articles
-
Different measures of ventilatory efficiency in preoperative cardiopulmonary exercise testing are useful for predicting postoperative complications in abdominal cancer surgery.Acta Anaesthesiol Scand. 2025 Jan;69(1):e14562. doi: 10.1111/aas.14562. Acta Anaesthesiol Scand. 2025. PMID: 39663552 Free PMC article.
-
Ventilatory efficiency in combination with peak oxygen uptake improves risk stratification in patients undergoing lobectomy.JTCVS Open. 2022 Jul 3;11:317-326. doi: 10.1016/j.xjon.2022.06.018. eCollection 2022 Sep. JTCVS Open. 2022. PMID: 36172418 Free PMC article.
-
VE/VCO2 slope and its prognostic value in patients with chronic heart failure.Exp Ther Med. 2015 Apr;9(4):1407-1412. doi: 10.3892/etm.2015.2267. Epub 2015 Feb 5. Exp Ther Med. 2015. PMID: 25780443 Free PMC article.
-
Increased minute ventilation-to-carbon dioxide slope during cardiopulmonary exercise test is associated with poor postoperative outcome following lung cancer resection.Eur J Cardiothorac Surg. 2024 Mar 1;65(3):ezad337. doi: 10.1093/ejcts/ezad337. Eur J Cardiothorac Surg. 2024. PMID: 37812232
-
Risk Stratification in Lung Resection.Curr Surg Rep. 2016;4(11):37. doi: 10.1007/s40137-016-0158-x. Epub 2016 Sep 20. Curr Surg Rep. 2016. PMID: 27730011 Free PMC article. Review.
Cited by
-
Pulmonary function prediction in lung cancer resection candidates: the latest insights.Breathe (Sheff). 2025 Jul 15;21(3):250041. doi: 10.1183/20734735.0041-2025. eCollection 2025 Jul. Breathe (Sheff). 2025. PMID: 40673067 Free PMC article.
-
Different measures of ventilatory efficiency in preoperative cardiopulmonary exercise testing are useful for predicting postoperative complications in abdominal cancer surgery.Acta Anaesthesiol Scand. 2025 Jan;69(1):e14562. doi: 10.1111/aas.14562. Acta Anaesthesiol Scand. 2025. PMID: 39663552 Free PMC article.
References
-
- Brunelli A, Kim AW, Berger KI, et al. Physiologic evaluation of the patient with lung cancer being considered for resectional surgery: Diagnosis and management of lung cancer, 3rd ed: American College of Chest Physicians evidence-based clinical practice guidelines. Chest 2013;143:e166S-90S. - PubMed