

A better method to evaluate the reliability of echocardiography for assessment of pulmonary hypertension: comparison of tricuspid regurgitant spectrum quality grading and tricuspid valve regurgitation degree
- PMID: 38410615
- PMCID: PMC10894378
- DOI: 10.21037/jtd-23-1084
A better method to evaluate the reliability of echocardiography for assessment of pulmonary hypertension: comparison of tricuspid regurgitant spectrum quality grading and tricuspid valve regurgitation degree
Abstract
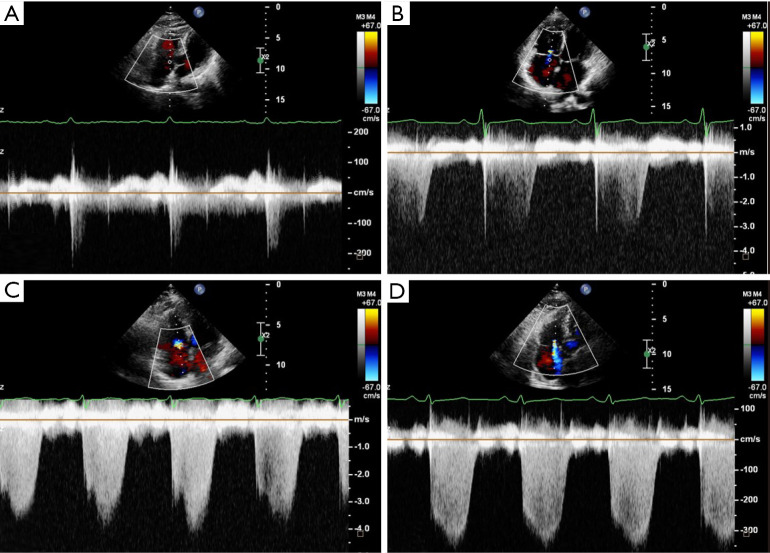
Background: Transthoracic echocardiography (TTE) is recommended as the most important noninvasive screening tool for the diagnosis of pulmonary hypertension (PH), sonographers usually measure the volume of regurgitant flow rather than evaluating the spectral quality, so physicians will determine whether the ultrasound measurements of pulmonary arterial systolic pressure (US-PASP) are reliable based on the volume of tricuspid regurgitation (TR). Therefore, for the first time, we grade the quality of TR spectrum (TRS) based on its integrity and clarity, aiming to assess clinical application value of different tricuspid regurgitant spectrum quality grades (TR-SQG), and investigate whether the accuracy of US-PASP is more trustworthy than TR.
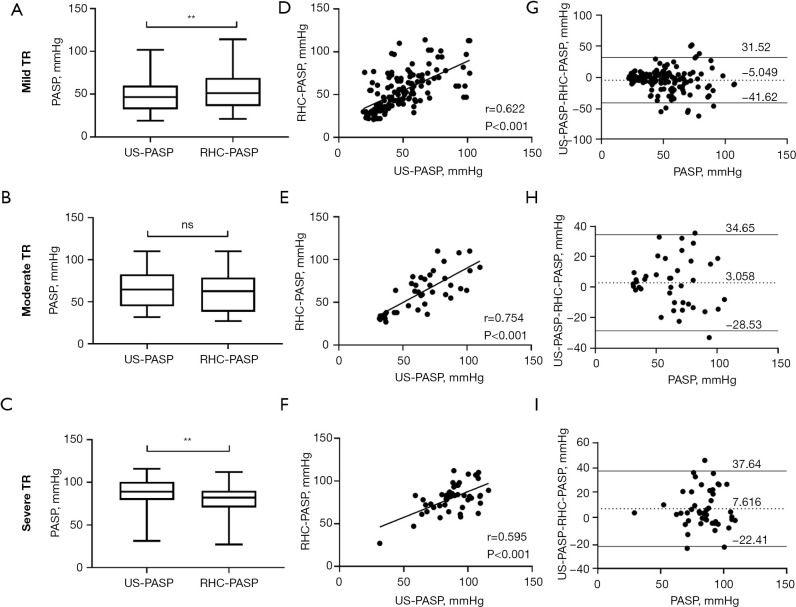
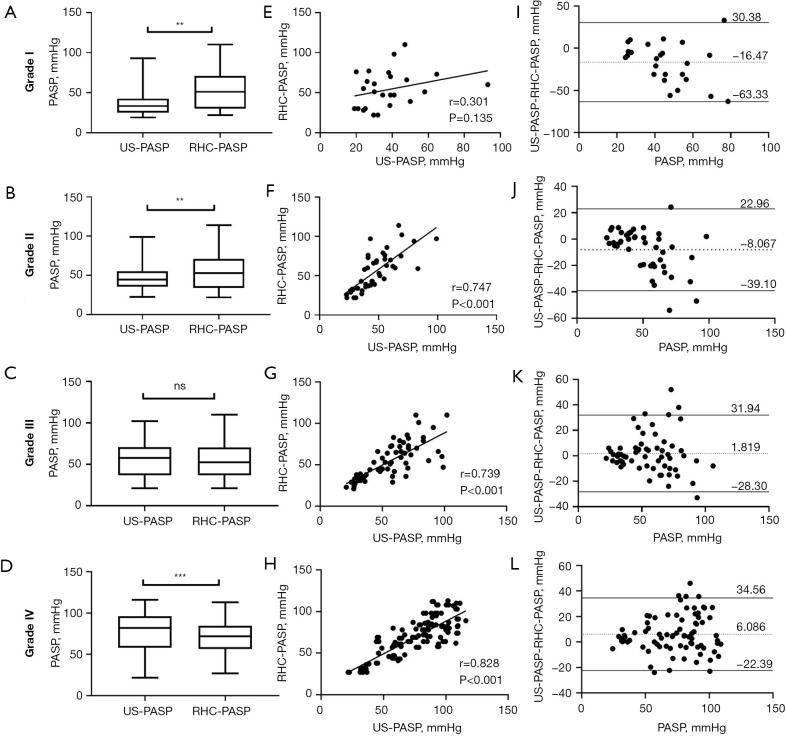
Methods: We retrospectively analyzed 108 patients with chronic thromboembolic PH (CTEPH) to compare the correlation and agreement between US-PASP and right heart catheterization measurements of PASP (RHC-PASP). TR area (TRA) and TRS were measured in each patient, and TR-SQG was performed.
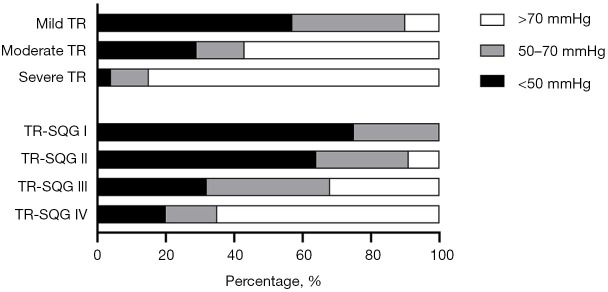
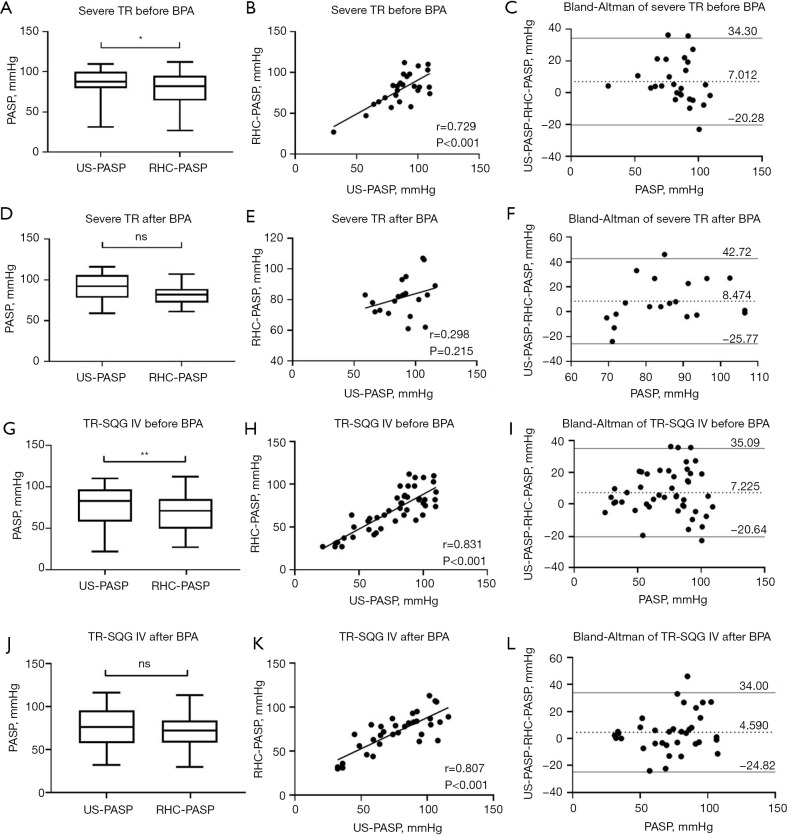
Results: The correlation coefficients between US-PASP and RHC-PASP were r=0.622 (P<0.001), r=0.754 (P<0.001), r=0.595 (P<0.001) in mild, moderate, severe TR, and r=0.301 (P=0.135), r=0.747 (P<0.001), r=0.739 (P<0.001), r=0.828 (P<0.001) in TR-SQG I-IV, respectively. Bland-Altman analysis revealed the mean biases of 5.05, 3.06, 7.62 mmHg in mild, moderate, severe TR, and -16.47, -8.07, 1.82, 6.09 mmHg in TR-SQG I-IV, respectively. In mild TR with the TR-SQG III and IV, the correlation coefficients between US-PASP and RHC-PASP were r=0.779 (P<0.001), intraclass correlation coefficient (ICC) =0.774, paired t-test P=0.160, respectively; and the consistency was significantly higher than that of mild TR without considering TR-SQG. In moderate TR with the TR-SQG III and IV, the r=0.749, ICC =0.746, paired t-test P=0.298 between US-PASP and RHC-PASP.
Conclusions: The US-PASP with TR-SQG III or IV is trustworthy, and its accuracy and consistency are better than those predicted by the traditional severity of TR. The establishment of the ultrasound evaluation system of TR-SQG helps clinicians to judge whether the US-PASP is accurate, credible, and reliable.
Keywords: Pulmonary hypertension (PH); echocardiography; right heart catheterization (RHC); tricuspid regurgitant spectrum; tricuspid regurgitation velocity (TRV).
2024 Journal of Thoracic Disease. All rights reserved.
Conflict of interest statement
Conflicts of Interest: All authors have completed the ICMJE uniform disclosure form (available at https://jtd.amegroups.com/article/view/10.21037/jtd-23-1084/coif). The authors have no conflicts of interest to declare.
Figures
Similar articles
-
Impact of Severe Tricuspid Regurgitation on Accuracy of Echocardiographic Pulmonary Artery Systolic Pressure Estimation.Echocardiography. 2015 Oct;32(10):1483-90. doi: 10.1111/echo.12912. Epub 2015 Mar 3. Echocardiography. 2015. PMID: 25735427
-
Reappraisal of the reliability of Doppler echocardiographic estimations for mean pulmonary artery pressure in patients with pulmonary hypertension: a study from a tertiary centre comparing four formulae.Pulm Circ. 2018 Apr-Jun;8(2):2045894018762270. doi: 10.1177/2045894018762270. Epub 2018 Feb 26. Pulm Circ. 2018. PMID: 29480067 Free PMC article.
-
Tricuspid flow and regurgitation in congenital heart disease and pulmonary hypertension: comparison of 4D flow cardiovascular magnetic resonance and echocardiography.J Cardiovasc Magn Reson. 2018 Jan 15;20(1):5. doi: 10.1186/s12968-017-0426-7. J Cardiovasc Magn Reson. 2018. PMID: 29332606 Free PMC article.
-
The Conundrum of Tricuspid Regurgitation Grading.Front Cardiovasc Med. 2018 Nov 9;5:164. doi: 10.3389/fcvm.2018.00164. eCollection 2018. Front Cardiovasc Med. 2018. PMID: 30474032 Free PMC article. Review.
-
Time to Calm the Fick Down? A Systematic Review and Meta-Analysis of Thermodilution Compared to Direct Fick in Tricuspid Regurgitation.CJC Open. 2024 May 24;6(9):1138-1144. doi: 10.1016/j.cjco.2024.05.008. eCollection 2024 Sep. CJC Open. 2024. PMID: 39525819 Free PMC article. Review.
References
LinkOut - more resources
Full Text Sources