

A bibliometric analysis of autism spectrum disorder signaling pathways research in the past decade
- PMID: 38410675
- PMCID: PMC10895046
- DOI: 10.3389/fpsyt.2024.1304916
A bibliometric analysis of autism spectrum disorder signaling pathways research in the past decade
Abstract
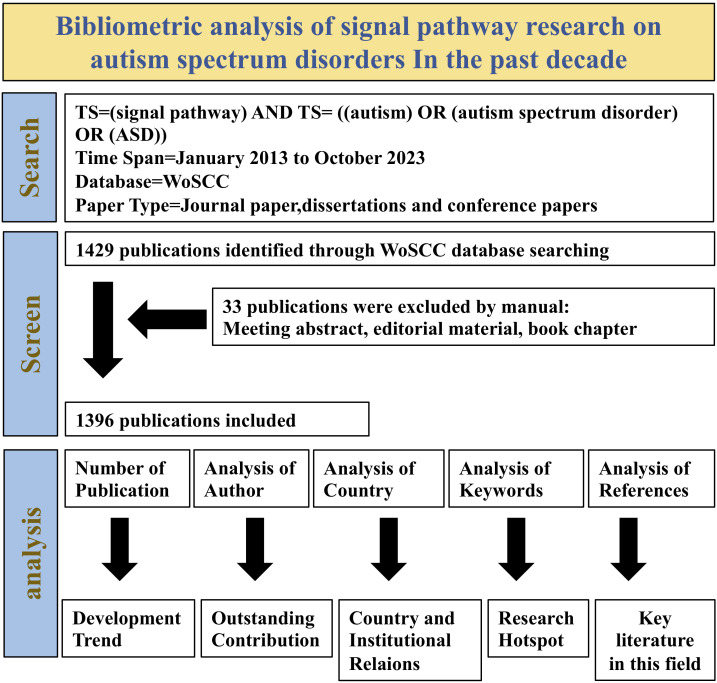
Background: This study employs bibliometric methods to comprehensively understand the fundamental structure of research about Autism Spectrum Disorder (ASD) Signaling Pathways by examining key indicators such as nations, institutions, journals, authors, and keywords.
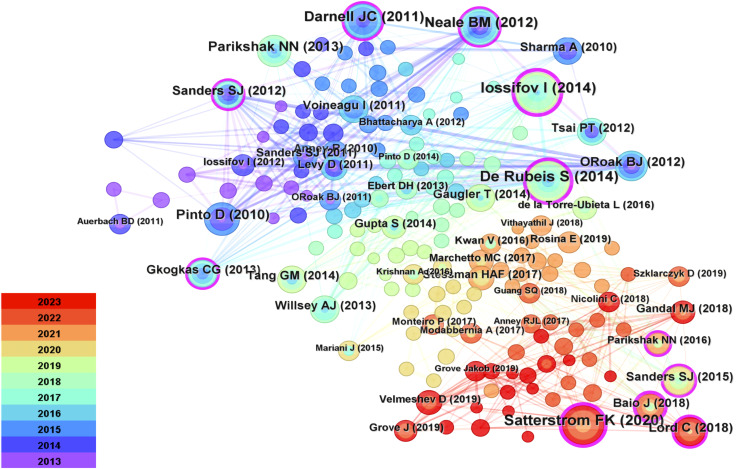
Methodology: We utilized the WoScc database to retrieve literature relevant to ASD Signaling Pathways published between 2013 and 2023. Through visual analysis and tools like CiteSpace and VosViewer, we explored nations, institutions, journals, authors, and keywords, thereby constructing relevant networks.
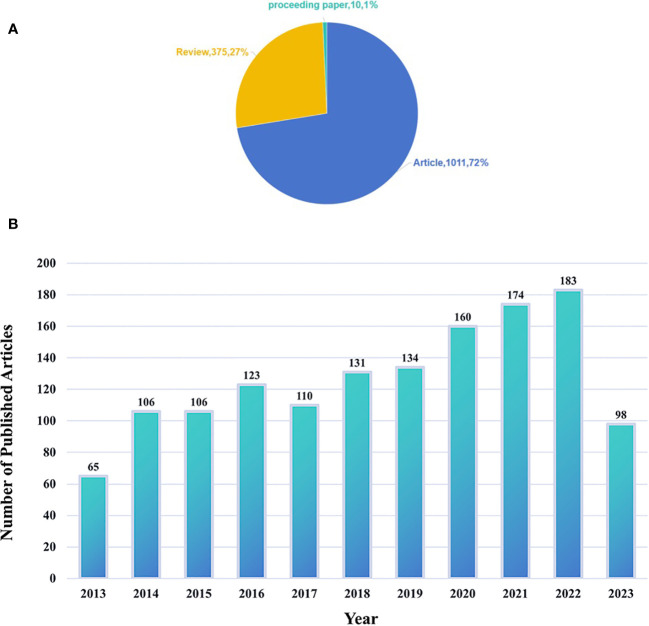
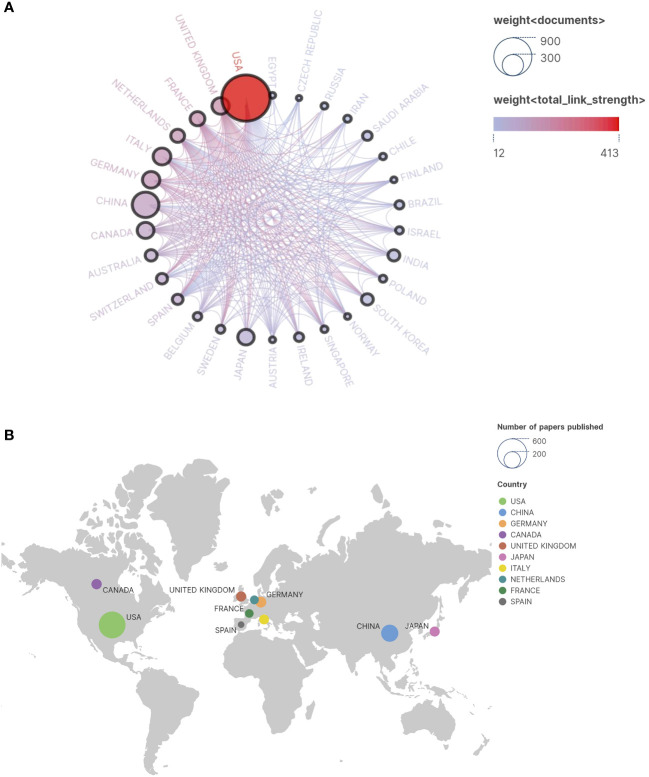
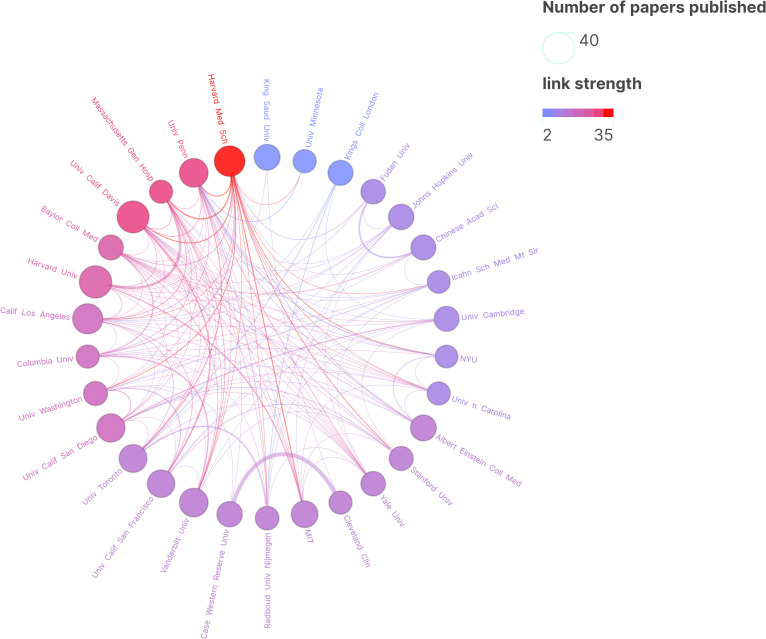
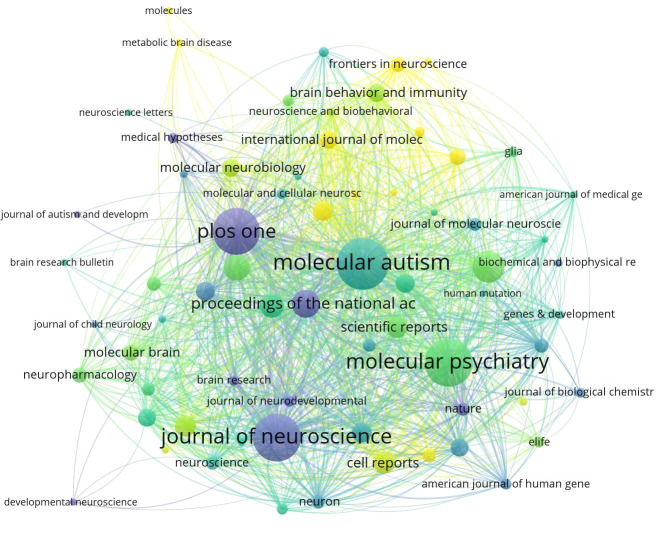
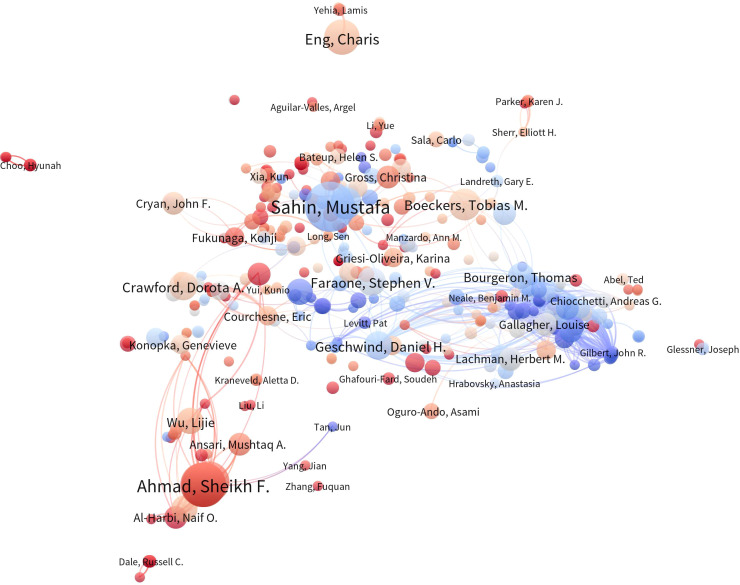
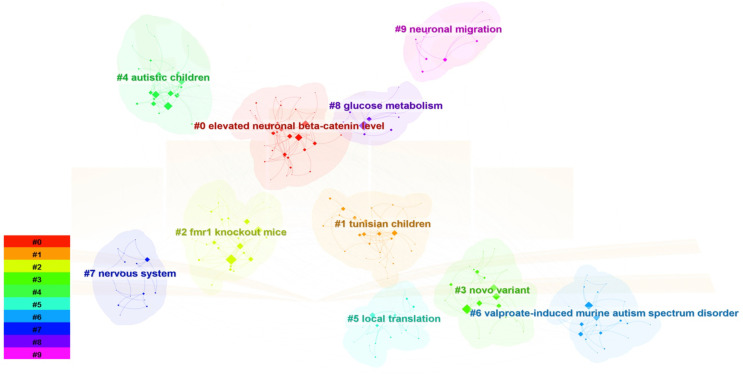
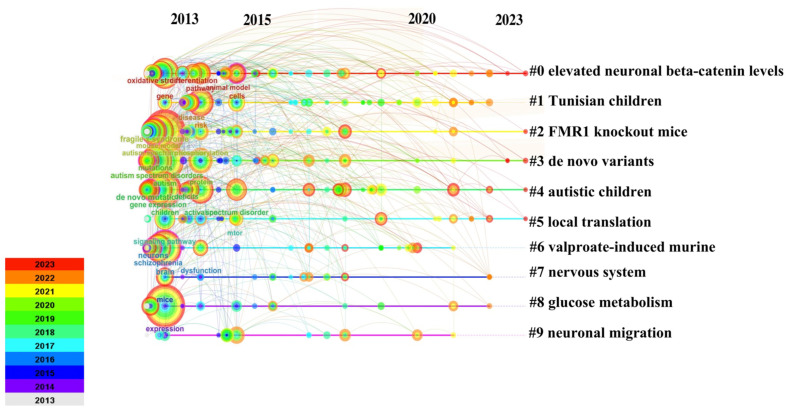
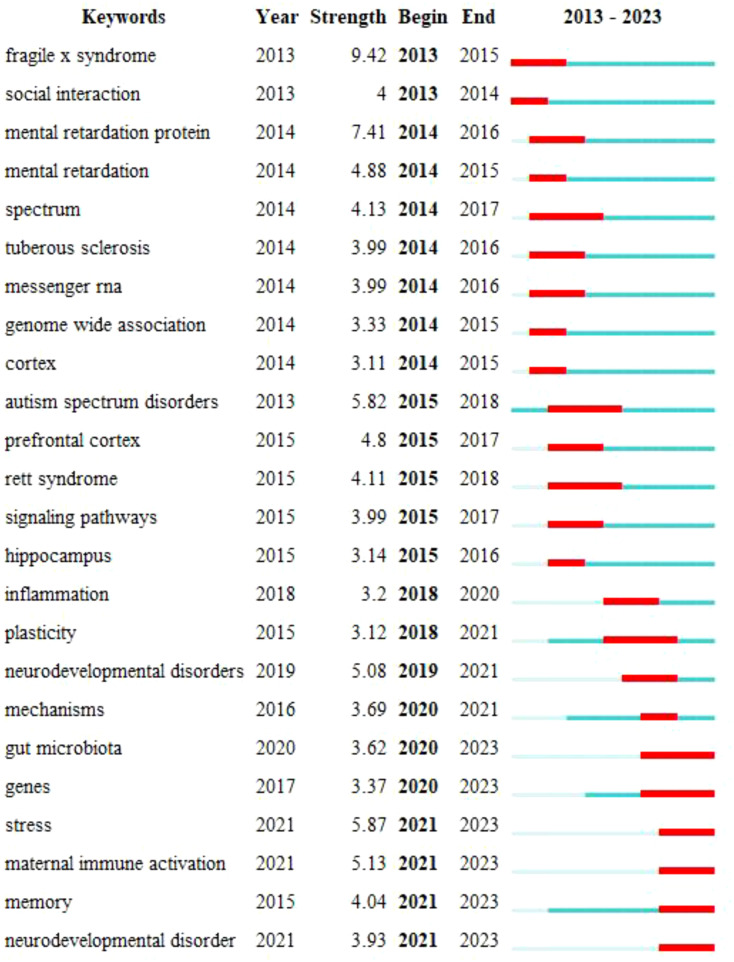
Results: 26 The study encompasses 1,396 articles, revealing a consistent increase in publications. The United States, China, and Germany are leading nations in this literature. Regarding research institutions, the University of California system and Eric Klann have garnered significant attention due to their substantial contributions to the field of ASD Signaling Pathways. Most relevant research is published in the journal "Molecular Autism." Research interests are concentrated across various themes, including "elevating neuronal β-catenin levels," "Tunisian children," "Fmr1 knockout (KO) mice," "de novo mutations," "autistic children," "local translation," "propionic acid-induced mouse models," "neurosystems," "glucose metabolism," and "neuronal migration." Future research may emphasize exploring aspects such as gut microbiota, genes, stress, maternal immune activation, memory, and neurodevelopmental disorders of ASD.
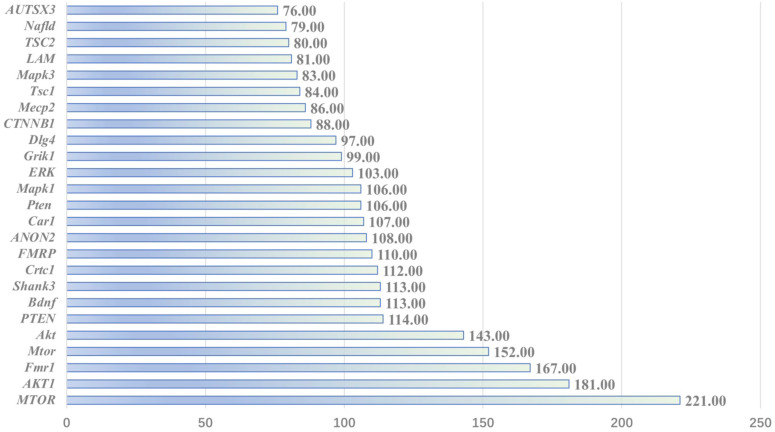
Conclusion: This study, through bibliometric analysis of key indicators such as nations, institutions, journals, authors, and keywords, provides a comprehensive overview of the current state of research on ASD Signaling Pathways. These investigations predominantly focus on molecular mechanisms, animal model studies, population-based research, and the structure and function of neurosystems. Future research directions are also clearly proposed. First, in-depth research on the genes and neurodevelopmental disorders associated with ASD will continue to reveal the genetic basis and provide support for precise treatments. At the same time, attention to the gut microbiota will help explore its association with ASD, which may provide clues for new treatments. In addition, the relationship between stress and ASD will become the focus of research to understand better the emotional and behavioral characteristics of ASD patients in stressful situations. Maternal immune activation will also be further studied to explore how environmental factors influence the risk and development of ASD. Finally, a deeper understanding of the cognitive functions of patients with ASD, especially memory and learning, will help develop individualized treatment strategies to improve patients' quality of life. These directions will work together and are expected to provide a more comprehensive understanding of Signaling Pathways research in ASD and provide new ideas and opportunities for future intervention and treatment.
Keywords: ASD; Citespace; VOSviewer; bibliometric analysis; signaling pathways.
Copyright © 2024 Lyu, Li, Chen, Li, Zhang, Hu, Zhang and Feng.
Conflict of interest statement
The authors declare that the research was conducted in the absence of any commercial or financial relationships that could be construed as a potential conflict of interest.
Figures
Similar articles
-
Bibliometric study of neuroinflammation in autism spectrum disorder.Front Psychiatry. 2023 Jan 19;14:1086068. doi: 10.3389/fpsyt.2023.1086068. eCollection 2023. Front Psychiatry. 2023. PMID: 36741118 Free PMC article.
-
Autism spectrum disorder research: knowledge mapping of progress and focus between 2011 and 2022.Front Psychiatry. 2023 Apr 25;14:1096769. doi: 10.3389/fpsyt.2023.1096769. eCollection 2023. Front Psychiatry. 2023. PMID: 37181872 Free PMC article.
-
Effect of COVID-19 on autism spectrum disorders: A bibliometric analysis based on original articles.Medicine (Baltimore). 2023 Sep 29;102(39):e35310. doi: 10.1097/MD.0000000000035310. Medicine (Baltimore). 2023. PMID: 37773860 Free PMC article.
-
The Current Research Landscape on the Machine Learning Application in Autism Spectrum Disorder: A Bibliometric Analysis From 1999 to 2023.Curr Neuropharmacol. 2025 Mar 25. doi: 10.2174/011570159X332833241222191422. Online ahead of print. Curr Neuropharmacol. 2025. PMID: 40143686
-
Seeing beyond words: Visualizing autism spectrum disorder biomarker insights.Heliyon. 2024 Apr 26;10(9):e30420. doi: 10.1016/j.heliyon.2024.e30420. eCollection 2024 May 15. Heliyon. 2024. PMID: 38694128 Free PMC article. Review.
References
-
- Zabålotsky B, Black LI, Maenner MJ, Schieve LA, Blumberg SJ. Estimated prevalence of autism and other developmental disabilities following questionnaire changes in the 2014 national health interview survey. Natl Health Stat Rep (2015) 87):1–20. - PubMed
-
- Delobel-Ayoub M, Saemundsen E, Gissler M, Ego A, Moilanen I, Ebeling H, et al. . Prevalence of autism spectrum disorder in 7-9-year-old children in Denmark, Finland, France and Iceland: A population-based registries approach within the ASDEU project. J Autism Dev Disord (2020) 50(3):949–59. doi: 10.1007/s10803-019-04328-y - DOI - PubMed
LinkOut - more resources
Full Text Sources
Research Materials
Miscellaneous