

Modeling of flaxseed protein, oil content, linoleic acid, and lignan content prediction based on hyperspectral imaging
- PMID: 38410736
- PMCID: PMC10895056
- DOI: 10.3389/fpls.2024.1344143
Modeling of flaxseed protein, oil content, linoleic acid, and lignan content prediction based on hyperspectral imaging
Abstract
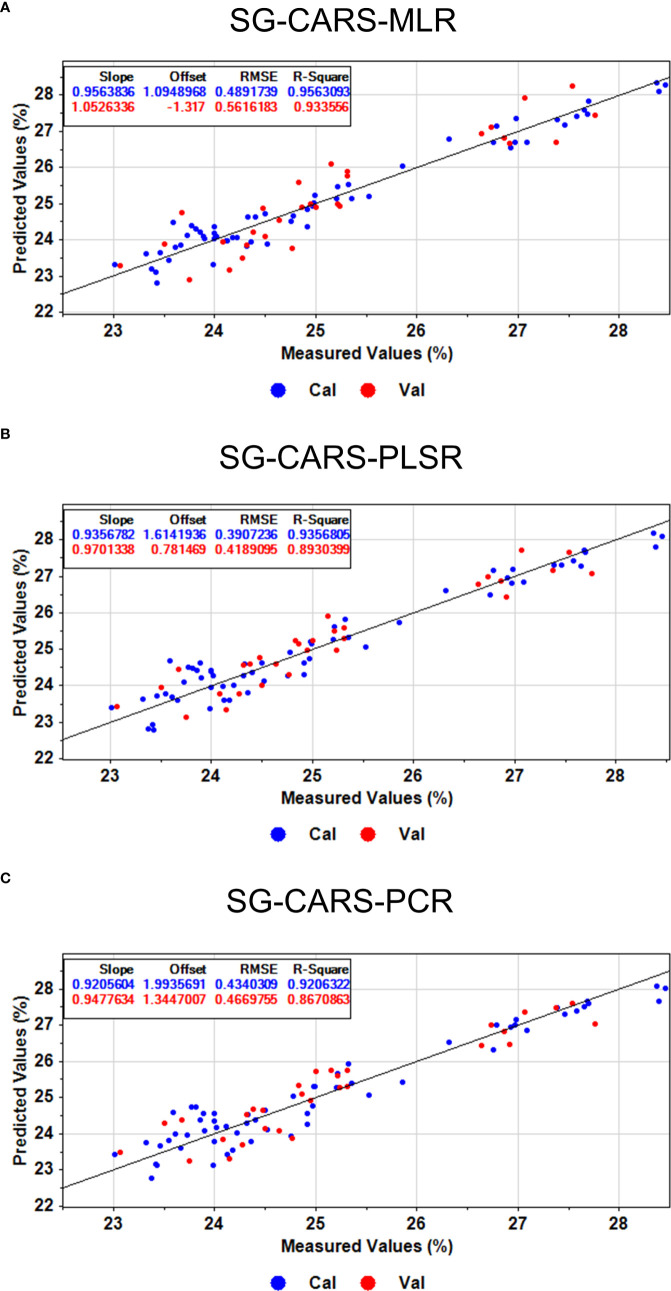
Protein, oil content, linoleic acid, and lignan are several key indicators for evaluating the quality of flaxseed. In order to optimize the testing methods for flaxseed's nutritional quality and enhance the efficiency of screening high-quality flax germplasm resources, we selected 30 flaxseed species widely cultivated in Northwest China as the subjects of our study. Firstly, we gathered hyperspectral information regarding the seeds, along with data on protein, oil content, linoleic acid, and lignan, and utilized the SPXY algorithm to classify the sample set. Subsequently, the spectral data underwent seven distinct preprocessing methods, revealing that the PLSR model exhibited superior performance after being processed with the SG smoothing method. Feature wavelength extraction was carried out using the Successive Projections Algorithm (SPA) and the Competitive Adaptive Reweighted Sampling (CARS). Finally, four quantitative analysis models, namely Partial Least Squares Regression (PLSR), Support Vector Regression (SVR), Multiple Linear Regression (MLR), and Principal Component Regression (PCR), were individually established. Experimental results demonstrated that among all the models for predicting protein content, the SG-CARS-MLR model predicted the best, with and of 0.9563 and 0.9336, with the corresponding Root Mean Square Error Correction (RMSEC) and Root Mean Square Error Prediction (RMSEP) of 0.4892 and 0.5616, respectively. In the optimal prediction models for oil content, linoleic acid and lignan, the was 0.8565, 0.8028, 0.9343, and the RMSEP was 0.8682, 0.5404, 0.5384, respectively. The study results show that hyperspectral imaging technology has excellent potential for application in the detection of quality characteristics of flaxseed and provides a new option for the future non-destructive testing of the nutritional quality of flaxseed.
Keywords: flaxseed; hyperspectral imaging; lignan; linoleic acid; oil content; protein.
Copyright © 2024 Zhu, Han, Liu, Zhang and Qi.
Conflict of interest statement
The authors declare that the research was conducted in the absence of any commercial or financial relationships that could be construed as a potential conflict of interest.
Figures


References
-
- Bjorgan A., Randeberg L. L. (2015). Towards real-time medical diagnostics using hyperspectral imaging technology. Eds. Brown J. Q., Deckert V. (Munich, Germany: European Conference on Biomedical Optics; ), 953712. doi: 10.1117/12.2184155 - DOI
-
- Dang Z., Zhao L. (2008). Application of the near infrared reflectance spectroscopy (NIRSin analyzing flaxseed germplasm quality. Acta Agric. Boreali-Occident. Sin. 17, 110–113.
-
- Feng X., Li G., Song J., Shao H. (2016). Determination of lignan in flaxseed by HPLC. Anim. Husb. Feed Sci. 37, 17–18+22. doi: 10.16003/j.cnki.issn1672-5190.2016.12.005 - DOI
LinkOut - more resources
Full Text Sources