Repetitive transcranial magnetic stimulation regulates effective connectivity patterns of brain networks in the spectrum of preclinical Alzheimer's disease
- PMID: 38410745
- PMCID: PMC10894951
- DOI: 10.3389/fnagi.2024.1343926
Repetitive transcranial magnetic stimulation regulates effective connectivity patterns of brain networks in the spectrum of preclinical Alzheimer's disease
Abstract
Objectives: Subjective cognitive decline (SCD) and amnestic mild cognitive impairment (aMCI) are considered as the spectrum of preclinical Alzheimer's disease (AD), with abnormal brain network connectivity as the main neuroimaging feature. Repetitive transcranial magnetic stimulation (rTMS) has been proven to be an effective non-invasive technique for addressing neuropsychiatric disorders. This study aims to explore the potential of targeted rTMS to regulate effective connectivity within the default mode network (DMN) and the executive control network (CEN), thereby improving cognitive function.
Methods: This study included 86 healthy controls (HCs), 72 SCDs, and 86 aMCIs. Among them, 10 SCDs and 11 aMCIs received a 2-week rTMS course of 5-day, once-daily. Cross-sectional analysis with the spectral dynamic causal model (spDCM) was used to analyze the DMN and CEN effective connectivity patterns of the three groups. Afterwards, longitudinal analysis was conducted on the changes in effective connectivity patterns and cognitive function before and after rTMS for SCD and aMCI, and the correlation between them was analyzed.
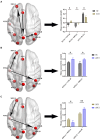
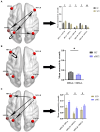
Results: Cross-sectional analysis showed different effective connectivity patterns in the DMN and CEN among the three groups. Longitudinal analysis showed that the effective connectivity pattern of the SCD had changed, accompanied by improvements in episodic memory. Correlation analysis indicated a negative relationship between effective connectivity from the left angular gyrus (ANG) to the anterior cingulate gyrus and the ANG.R to the right middle frontal gyrus, with visuospatial and executive function, respectively. In patients with aMCI, episodic memory and executive function improved, while the effective connectivity pattern remained unchanged.
Conclusion: This study demonstrates that PCUN-targeted rTMS in SCD regulates the abnormal effective connectivity patterns in DMN and CEN, thereby improving cognition function. Conversely, in aMCI, the mechanism of improvement may differ. Our findings further suggest that rTMS is more effective in preventing or delaying disease progression in the earlier stages of the AD spectrum.
Clinical trial registration: http://www.chictr.org.cn, ChiCTR2000034533.
Keywords: amnestic mild cognitive impairment; dynamic causal model; effective connectivity; repetitive transcranial magnetic stimulation; subjective cognitive decline.
Copyright © 2024 Liang, Xue, Zheng, Yuan, Qi, Ruan, Chen, Song, Wu, Lu, Xiao and Chen.
Conflict of interest statement
The authors declare that the research was conducted in the absence of any commercial or financial relationships that could be construed as a potential conflict of interest.
Figures


Similar articles
-
Functional changes in the salience network of patients with amnesic mild cognitive impairment before and after repetitive transcranial magnetic stimulation.Brain Behav. 2023 Sep;13(9):e3169. doi: 10.1002/brb3.3169. Epub 2023 Aug 3. Brain Behav. 2023. PMID: 37534626 Free PMC article.
-
Distinct Disruptive Patterns of Default Mode Subnetwork Connectivity Across the Spectrum of Preclinical Alzheimer's Disease.Front Aging Neurosci. 2019 Nov 13;11:307. doi: 10.3389/fnagi.2019.00307. eCollection 2019. Front Aging Neurosci. 2019. PMID: 31798440 Free PMC article.
-
Repetitive Transcranial Magnetic Stimulation Induced Hypoconnectivity Within the Default Mode Network Yields Cognitive Improvements in Amnestic Mild Cognitive Impairment: A Randomized Controlled Study.J Alzheimers Dis. 2019;69(4):1137-1151. doi: 10.3233/JAD-181296. J Alzheimers Dis. 2019. PMID: 31127779 Clinical Trial.
-
Repetitive Transcranial Magnetic Stimulation (rTMS) in Mild Cognitive Impairment: Effects on Cognitive Functions-A Systematic Review.J Clin Med. 2023 Sep 25;12(19):6190. doi: 10.3390/jcm12196190. J Clin Med. 2023. PMID: 37834834 Free PMC article. Review.
-
Functional MRI-Specific Alterations in Salience Network in Mild Cognitive Impairment: An ALE Meta-Analysis.Front Aging Neurosci. 2021 Jul 26;13:695210. doi: 10.3389/fnagi.2021.695210. eCollection 2021. Front Aging Neurosci. 2021. PMID: 34381352 Free PMC article.
Cited by
-
Research progress on brain network imaging biomarkers of subjective cognitive decline.Front Neurosci. 2025 Feb 13;19:1503955. doi: 10.3389/fnins.2025.1503955. eCollection 2025. Front Neurosci. 2025. PMID: 40018359 Free PMC article. Review.
-
Heterogeneous brain abnormalities in subjective cognitive decline converge on a common network and their transcriptional signature.Alzheimers Dement. 2025 Mar;21(3):e70073. doi: 10.1002/alz.70073. Alzheimers Dement. 2025. PMID: 40145464 Free PMC article.
-
Exploring the changes in functional connectivity of the limbic system in Patients with amnestic mild cognitive impairment treated by acupuncture based on fMRI.Front Neurol. 2025 Jun 13;16:1506367. doi: 10.3389/fneur.2025.1506367. eCollection 2025. Front Neurol. 2025. PMID: 40584525 Free PMC article.
-
Repetitive transcranial magnetic stimulation may promote the reversion of mild cognitive impairment to normal cognition.Front Psychiatry. 2025 Apr 3;16:1544728. doi: 10.3389/fpsyt.2025.1544728. eCollection 2025. Front Psychiatry. 2025. PMID: 40248597 Free PMC article.
-
Disruptive resting state networks characterizing depressive comorbidity in Alzheimer's disease and mild cognitive impairment.J Alzheimers Dis. 2025 Jul;106(1):18-37. doi: 10.1177/13872877251337770. Epub 2025 May 6. J Alzheimers Dis. 2025. PMID: 40329587 Free PMC article.
References
LinkOut - more resources
Full Text Sources
Miscellaneous

