

Optimization of training for professional rugby union players: investigating the impact of different small-sided games models on GPS-derived performance metrics
- PMID: 38410810
- PMCID: PMC10895442
- DOI: 10.3389/fphys.2024.1339137
Optimization of training for professional rugby union players: investigating the impact of different small-sided games models on GPS-derived performance metrics
Abstract
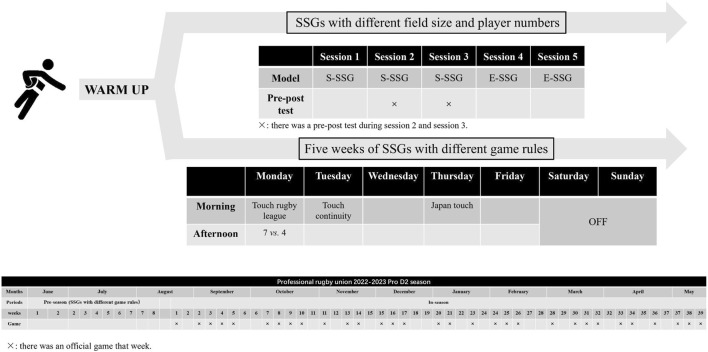
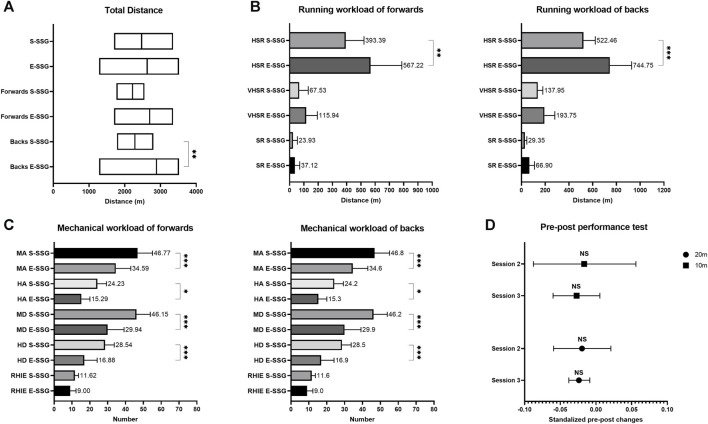
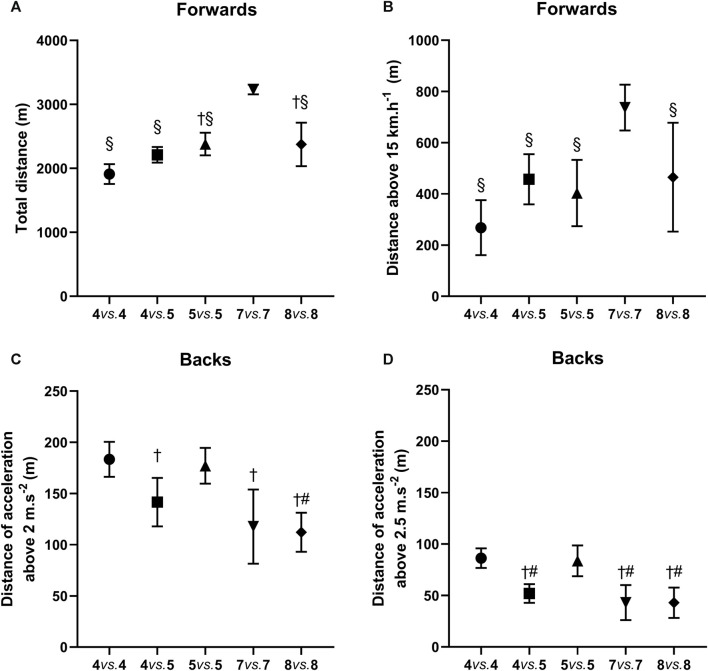
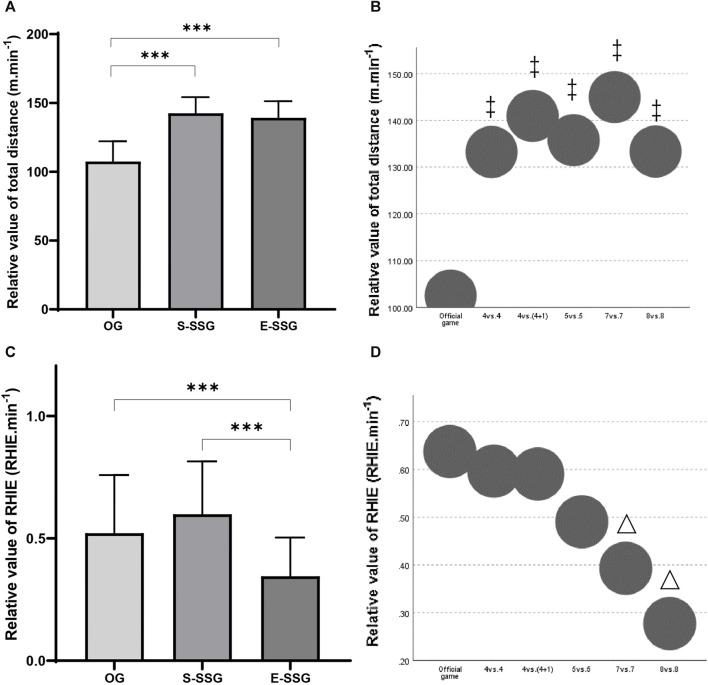
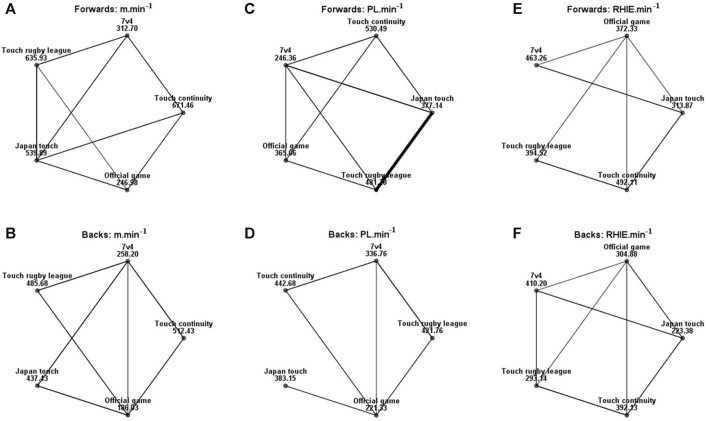
Introduction: Professional rugby union players can improve their performance by engaging in small-sided games (SSGs), which simulate the movement patterns of the game. This study collected metrics related to running performance and mechanical workload and their relative values from both forward and back positions, aiming to explore the impact of different SSGs factors on athlete workload, as well as the workload difference between official games (OGs) and SSGs. Methods: The monitored GPS data were collected from SSGs with different player numbers and pitch sizes (five sessions), SSG rules (5 weeks, four sessions per week), and OGs conducted throughout the year. Additionally, the study compared changes in players' sprinting performance before and after two SSG sessions. Results: Backs had greater workload than forwards. Less space and number of players SSG (4 vs. 4, 660 m2) was conducive to facilitating training for players in acceleration and deceleration. Conversely, larger spaces were associated with improved running performance. However, the introduction of a floater had no significant impact on performance improvement. Additionally, the 7 vs. 4 model (seven players engaged with four opponents) resulted in the greatest workload during medium-hard accelerations (F = 52.76-88.23, p < 0.001, ηp 2 = 0.19-0.28). Japan touch model allowed for more high-speed running training (F = 47.93-243.55, p < 0.001, ηp 2 = 1.52). The workload performed by SSGs can almost cover that of OGs (F = 23.36-454.21, p < 0.05, ηp 2 = 0.03-0.57). In the context of ηp 2, values around 0.01, 0.06 and 0.14 indicate small, medium and large effects respectively. Discussion: However, given the significantly higher workload of SSGs and the slight decrease in sprinting performance, further research is required to examine the training patterns of SSGs. This study provided insight into the impact of player numbers, pitch size, and rules on rugby-specific SSGs. Coaches should optimize SSG setups for enhanced training outcomes, ensuring the long-term development of physical capacity, technical and tactical skills.
Keywords: constraints-led approach; external load; global positioning system; intermittent exercise; team sports.
Copyright © 2024 Ren, Henry, Boisbluche, Philippe, Demy, Ding and Prioux.
Conflict of interest statement
The authors declare that the research was conducted in the absence of any commercial or financial relationships that could be construed as a potential conflict of interest.
Figures
Similar articles
-
Planning Training Workload in Football Using Small-Sided Games' Density.J Strength Cond Res. 2019 Oct;33(10):2801-2811. doi: 10.1519/JSC.0000000000002598. J Strength Cond Res. 2019. PMID: 29742748
-
Estimated metabolic and mechanical demands during different small-sided games in elite soccer players.Hum Mov Sci. 2014 Aug;36:123-33. doi: 10.1016/j.humov.2014.05.006. Epub 2014 Jun 24. Hum Mov Sci. 2014. PMID: 24968370
-
The contributing external load factors to internal load during small-sided games in professional rugby union players.Front Sports Act Living. 2023 Feb 15;5:1092186. doi: 10.3389/fspor.2023.1092186. eCollection 2023. Front Sports Act Living. 2023. PMID: 36873663 Free PMC article.
-
Effects of Small-Sided Game Interventions on the Technical Execution and Tactical Behaviors of Young and Youth Team Sports Players: A Systematic Review and Meta-Analysis.Front Psychol. 2021 May 7;12:667041. doi: 10.3389/fpsyg.2021.667041. eCollection 2021. Front Psychol. 2021. PMID: 34025529 Free PMC article.
-
Small-sided games in team sports training: a brief review.J Strength Cond Res. 2014 Dec;28(12):3594-618. doi: 10.1519/JSC.0000000000000564. J Strength Cond Res. 2014. PMID: 24918302 Review.
Cited by
-
Macronutrient requirements and intake by professional male rugby players.J Int Soc Sports Nutr. 2025 Dec;22(1):2479709. doi: 10.1080/15502783.2025.2479709. Epub 2025 Mar 18. J Int Soc Sports Nutr. 2025. PMID: 40099872 Free PMC article.
-
Exploring the application of knowledge transfer to sports video data.Front Sports Act Living. 2025 Feb 7;6:1460429. doi: 10.3389/fspor.2024.1460429. eCollection 2024. Front Sports Act Living. 2025. PMID: 39989920 Free PMC article.
References
LinkOut - more resources
Full Text Sources