. 2024 May 1;326(5):L539-L550.
doi: 10.1152/ajplung.00239.2023. Epub 2024 Feb 27.

Repetitive sulfur dioxide exposure in mice models post-deployment respiratory syndrome

Affiliations

Repetitive sulfur dioxide exposure in mice models post-deployment respiratory syndrome

Sergey S Gutor et al. Am J Physiol Lung Cell Mol Physiol. .

Abstract

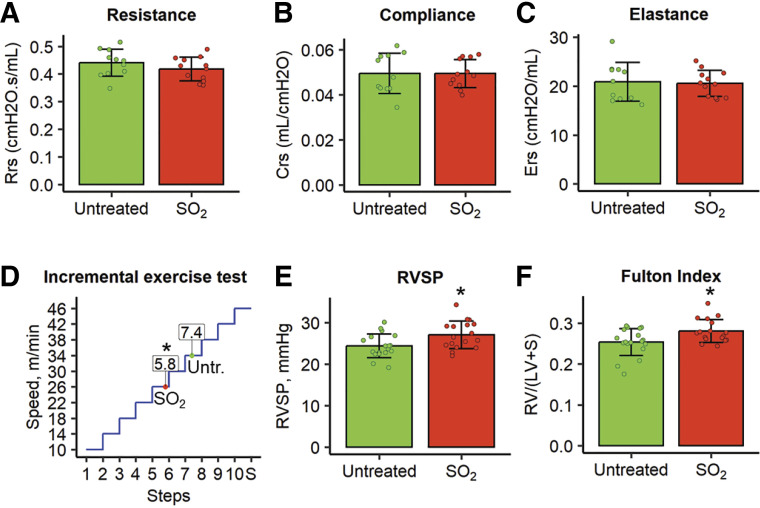
Soldiers deployed to Iraq and Afghanistan have a higher prevalence of respiratory symptoms than nondeployed military personnel and some have been shown to have a constellation of findings on lung biopsy termed post-deployment respiratory syndrome (PDRS). Since many of the subjects in this cohort reported exposure to sulfur dioxide (SO2), we developed a model of repetitive exposure to SO2 in mice that phenocopies many aspects of PDRS, including adaptive immune activation, airway wall remodeling, and pulmonary vascular (PV) disease. Although abnormalities in small airways were not sufficient to alter lung mechanics, PV remodeling resulted in the development of pulmonary hypertension and reduced exercise tolerance in SO2-exposed mice. SO2 exposure led to increased formation of isolevuglandins (isoLGs) adducts and superoxide dismutase 2 (SOD2) acetylation in endothelial cells, which were attenuated by treatment with the isoLG scavenger 2-hydroxybenzylamine acetate (2-HOBA). In addition, 2-HOBA treatment or Siruin-3 overexpression in a transgenic mouse model prevented vascular remodeling following SO2 exposure. In summary, our results indicate that repetitive SO2 exposure recapitulates many aspects of PDRS and that oxidative stress appears to mediate PV remodeling in this model. Together, these findings provide new insights regarding the critical mechanisms underlying PDRS.NEW & NOTEWORTHY We developed a mice model of "post-deployment respiratory syndrome" (PDRS), a condition in Veterans with unexplained exertional dyspnea. Our model successfully recapitulates many of the pathological and physiological features of the syndrome, revealing involvement of the ROS-isoLGs-Sirt3-SOD2 pathway in pulmonary vasculature pathology. Our study provides additional knowledge about effects and long-term consequences of sulfur dioxide exposure on the respiratory system, serving as a valuable tool for future PDRS research.

Keywords: constrictive bronchiolitis; experimental animal models; oxidative stress; pulmonary hypertension; sulfur dioxide.


Conflict of interest statement

No conflicts of interest, financial or otherwise, are declared by the authors.

Figures

None
Graphical abstract
Figure 1.
Figure 1.
SO2 exposure model optimization and validation. A: normal-appearing distal airway in untreated WT mice (left) and epithelial sloughing and epithelial cell agglomerate in distal airway lumen of 125-ppm SO2-exposed mice for 4 h (right). Periodic acid-Schiff (PAS) staining. Scale bars = 50 µm. B: epithelial damage score after 2 and 4 h of 125 ppm SO2 exposure. Groups were compared using Student’s t test and P values were Bonferroni-adjusted for multiple-group comparisons. *P < 0.05 compared with untreated mice, †P < 0.05 compared with untreated and SO2-exposed (for 2 h) mice. n = 4 mice/group. C: normal-appearing distal airway in untreated WT mice (left) and collagen deposition in distal airway wall of 125 ppm SO2-exposed mice for 4 h at 4 wk after the last exposure (right). Picrosirius red staining. Scale bars = 50 µm. D: collagen content in distal airway wall increased exponentially over postexposure time. Data are presented as means (red dots) ± SD (whiskers). Groups were compared using Student’s t test and P values were Bonferroni-adjusted for multiple-group comparisons. *P < 0.05 compared with untreated mice. n = 3–12 mice/time point. E: normal-appearing distal airway in untreated WT mice (left) and distal airway wall thickening after 10 days of 125 ppm SO2-exposed mice for 4 h and 4 wk of postexposure time (right). Red lines outline the subepithelial layer. PAS staining. Scale bars = 50 µm. F: dose-dependent distal airway wall thickening. VS(se,rbm), subepithelium thickness. Groups were compared using Student’s t test and P values were Bonferroni-adjusted for multiple-group comparisons. *P < 0.05 compared with untreated mice, †P < 0.05 compared with untreated, single and three times SO2-exposed mice. n = 12 mice/study group. SO2, sulfur dioxide; WT, wild type.
Figure 2.
Figure 2.
SO2 inhalation exposure leads to distal airway remodeling and chronic inflammatory cell influx. A: strategy and timeline of SO2 exposure for reproduction of PDRS-associated pathological lesions in mice. B: normal-appearing bronchovascular bundle in untreated WT mice; increased collagen deposition in distal small airways in WT mice exposed to 125 ppm SO2 for 4 h a day, 5 days per week for 2 wk, followed by 28 days postexposure period (red arrow). Picrosirius red staining. Scale bars = 50 µm. C: collagen deposition in distal airways. Groups were compared using Student’s t test. *P < 0.001 compared with untreated mice. n = 12 mice/study group. DF: increased numbers of CD4+ and CD8+ T cells, conventional type 1 (cDC1) and 2 (cDC2) and monocyte-derived dendritic cells (moDCs), and alveolar macrophages (AMs) in SO2-exposed mice compared with unexposed age-matched mice. Ne, neutrophils. Groups were compared using Student’s t test. *P < 0.01 compared with untreated mice. n = 6 mice/study group. PDRS, post-deployment respiratory syndrome; SO2, sulfur dioxide; WT, wild type.
Figure 3.
Figure 3.
Effects of SO2 inhalation exposure on pulmonary vasculature. A: normal-appearing bronchovascular bundle in untreated WT mice; increased medial thickness (red arrow) and fibrosis of adventitia in pulmonary artery in WT mice exposed to SO2 (4 wk after exposure). Verhoeff-Van Gieson staining. Scale bars = 50 µm. B: bar plot showing tunica media thickness, VS(media,iem), in adjacent to distal airway pulmonary arteries. Groups were compared using Student’s t test. *P < 0.001 compared with untreated mice. n = 12 mice/study group. C: images illustrating the examples of nonmuscularized, partially muscularized (<50% vessel circumference with smooth muscle), and muscularized (>50% vessel circumference with smooth muscle) blood vessels with size <50 µm. Double immunofluorescence with anti-CD31 (red) and anti-α-smooth muscle actin (green) antibodies. Scale bars = 25 µm. The 2-D pie charts illustrate the distribution of nonmuscularized, partially muscularized, and muscularized intra-acinar blood vessels in untreated and SO2-exposed mice. P < 0.01 for group at 4 wk after SO2 exposure compared with untreated control mice by chi-square test. n = 12 mice/study group. 2-D, two-dimensional; SO2, sulfur dioxide; WT, wild type.
Figure 4.
Figure 4.
Long-term physiological effects of SO2 exposure. AC: total respiratory system resistance (A), compliance (B), and elastance (C) measurements by the flexiVent “Snapshot model.” Groups were compared using Student’s t test. n = 11 or 12 mice/study group. D: incremental treadmill exercise test showing reduced maximal running speed in SO2-exposed mice (red) compared with unexposed mice (green). *P < 0.05 compared with untreated mice (Student’s t test). E and F: increase of RV systolic pressure (RVSP) and Fulton index in SO2-exposed mice compared with unexposed mice. Pulmonary hemodynamics were analyzed via the jugular vein using 1.4-F Mikro-Tip catheter. All experiments are conducted 6 mo after the last exposure. Groups were compared using Student’s t test. *P < 0.05 compared with untreated mice. n = 17 or 18 mice/study group. SO2, sulfur dioxide.
Figure 5.
Figure 5.
ROS and isoLGs accumulation with downstream inactivation of Sirt3 and SOD2 after SO2 exposure. A and B: plots showing increased 2OH-ethidium (marker of superoxide) normalized to protein content (2OH-Et/Pr) in lung tissue of 1 mm thick section (A) and endothelial cells isolated from the lungs (B). Groups were compared using Mann–Whitney U test (A) or Student’s t test (B). n = 4–6 mice/study group. C: ROS accumulation in endothelial cells after SO2 exposure compared with vehicle. Dihydroethidium (DHE) stained in red. Scale bars = 25 µm. Note that data in AC were obtained immediately after the last SO2 exposure. D: representative Western blots for proteins with isoLG adducts and SOD2 acetylation in isolated endothelial cells. Endothelial cells were isolated from lungs of untreated or SO2-exposed mice with or without supplementation of isoLG scavenger 2-HOBA (1 g/L in drinking water). E and F: densitometry graphs showing the accumulation of isoLG protein adducts (E) and SOD2 hyperacetylation (F) in SO2-exposed mice and effect mitigation by 2-HOBA supplementation. Groups were compared using Mann–Whitney U test (E) or Student’s t test (F) and P values were Bonferroni-adjusted for multiple-group comparisons. *P < 0.05 compared with unexposed mice, †P < 0.05 compared with SO2-exposed mice. n = 6 mice/study group. Measurements in DF were performed 4 wk after SO2 exposure. 2-HOBA, 2-hydroxybenzylamine acetate; isoLGs, isolevuglandins; ROS, reactive oxygen species; SO2, sulfur dioxide.
Figure 6.
Figure 6.
2-HOBA supplementation prevents vascular remodeling after SO2 exposure. A and B: graphs showing the distal airway wall thickening (A) and collagen deposition (B) in WT mice exposed to SO2 with or without 2-HOBA supplementation. VS(se,rbm), subepithelium thickness. C: graph showing the protective effect of 2-HOBA on increased medial thickness in pulmonary arteries adjacent to distal airways in WT mice exposed to SO2. VS(media,iem), tunica media thickness. Groups were compared using Mann–Whitney U test (A and C) or Student’s t test (B) and P values were Bonferroni-adjusted for multiple-group comparisons. *P < 0.05 compared with untreated mice, †P < 0.05 compared with SO2-exposed mice. n = 6–12 mice/study group. D: 2-D pie charts illustrate distribution of nonmuscularized, partially muscularized, and muscularized intra-acinar blood vessels (<25 μm in size) in WT untreated or exposed to SO2 mice with or without 2-HOBA supplementation. P < 0.01 for group exposed to SO2 without 2-HOBA supplementation compared with unexposed groups by chi-square test. P < 0.05 for group exposed to SO2 with 2-HOBA supplementation compared with group exposed to SO2 without 2-HOBA supplementation. n = 6–12 mice/study group. All measurements were performed 4 wk after SO2 exposure. 2-HOBA, 2-hydroxybenzylamine acetate; SO2, sulfur dioxide; WT, wild type.
Figure 7.
Figure 7.
Sirt3 overexpression prevents vascular remodeling after SO2 exposure. A and B: graphs showing the distal airway wall thickening (A) and collagen deposition (B) in WT or Sirt3 overexpressing (OX) mice exposed to SO2. VS(se,rbm), subepithelium thickness. C: graph showing the protective effect of Sirt3 overexpression on increased medial thickness in pulmonary arteries adjacent to distal airways in WT mice exposed to SO2. VS(media,iem), tunica media thickness. Groups were compared using Mann–Whitney U test (A and C) or Student’s t test (B) and P values were Bonferroni-adjusted for multiple-group comparisons. *P < 0.05 compared with untreated mice, †P < 0.05 compared with SO2-exposed mice. n = 5–11 mice/study group. D: 2-D pie charts illustrate distribution of nonmuscularized, partially muscularized, and muscularized intra-acinar blood vessels (<25 μm in size) in WT and Sirt3 OX untreated or exposed to SO2 mice. P < 0.01 for group of WT mice exposed to SO2 compared with unexposed groups by chi-square test. P < 0.05 for group of Sirt3 OX mice exposed to SO2 compared with WT mice exposed to SO2. n = 5–12 mice/study group. All measurements were performed 4 wk after SO2 exposure. 2-D, two-dimensional; SO2, sulfur dioxide; Sirt3, sirtuin-3; WT, wild type.

Update of

Similar articles

Cited by

References

    1. National Academies, Sciences, and Engineering; Health and Medicine Division; Board on Population Health and Public Health Practice; Committee on the Respiratory Health Effects of Airborne Hazards Exposures in the Southwest Asia Theater of Military Operations. Respiratory Health Effects of Airborne Hazards Exposures in the Southwest Asia Theater of Military Operations. Washington, DC: National Academies Press (US), 2020. - PubMed
    1. Sanders JW, Putnam SD, Frankart C, Frenck RW, Monteville MR, Riddle MS, Rockabrand DM, Sharp TW, Tribble DR. Impact of illness and non-combat injury during operations Iraqi freedom and enduring freedom (Afghanistan). Am J Trop Med Hyg 73: 713–719, 2005. doi:10.4269/ajtmh.2005.73.713. - DOI - PubMed
    1. Falvo MJ, Osinubi OY, Sotolongo AM, Helmer DA. Airborne hazards exposure and respiratory health of Iraq and Afghanistan veterans. Epidemiol Rev 37: 116–130, 2015. doi:10.1093/epirev/mxu009. - DOI - PubMed
    1. Garshick E, Abraham JH, Baird CP, Ciminera P, Downey GP, Falvo MJ, Hart JE, Jackson DA, Jerrett M, Kuschner W, Helmer DA, Jones KD, Krefft SD, Mallon T, Miller RF, Morris MJ, Proctor SP, Redlich CA, Rose CS, Rull RP, Saers J, Schneiderman AI, Smith NL, Yiallouros P, Blanc PD. Respiratory health after military service in Southwest Asia and Afghanistan. An official American Thoracic Society Workshop report. Ann Am Thorac Soc 16: e1–e16, 2019. doi:10.1513/AnnalsATS.201904-344WS. - DOI - PMC - PubMed
    1. Morris MJ, Walter RJ, McCann ET, Sherner JH, Murillo CG, Barber BS, Hunninghake JC, Holley AB. Clinical evaluation of deployed military personnel with chronic respiratory symptoms: study of active duty military for pulmonary disease related to environmental deployment exposures (STAMPEDE) III. Chest 157: 1559–1567, 2020. doi:10.1016/j.chest.2020.01.024. - DOI - PubMed

Publication types

MeSH terms

LinkOut - more resources