. 2024 Mar 11;25(3):1989-2006.
doi: 10.1021/acs.biomac.3c01396. Epub 2024 Feb 27.

Cellulose-Callose Hydrogels: Computational Exploration of Their Nanostructure and Mechanical Properties

Affiliations

Cellulose-Callose Hydrogels: Computational Exploration of Their Nanostructure and Mechanical Properties

Pallavi Kumari et al. Biomacromolecules. .

Abstract

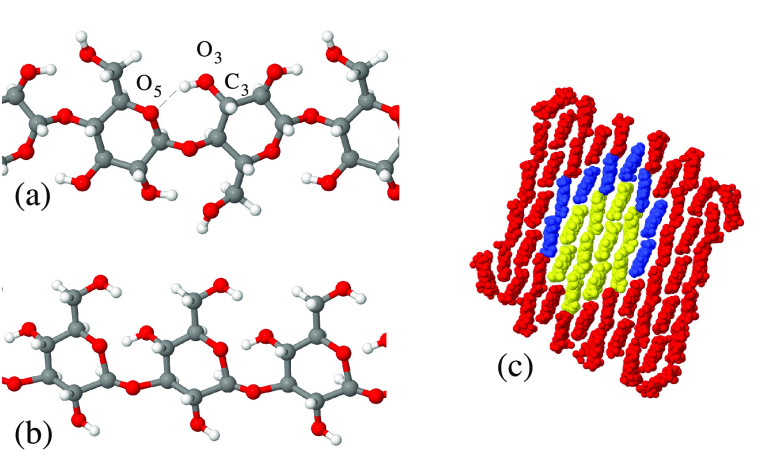
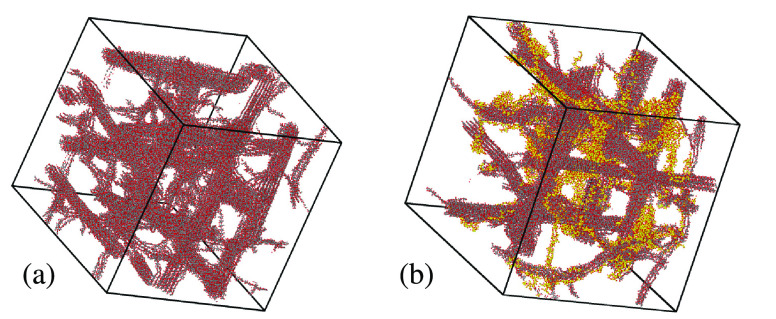
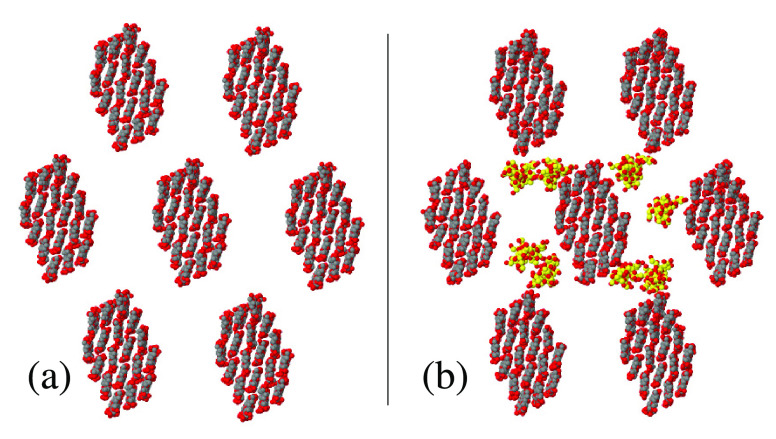
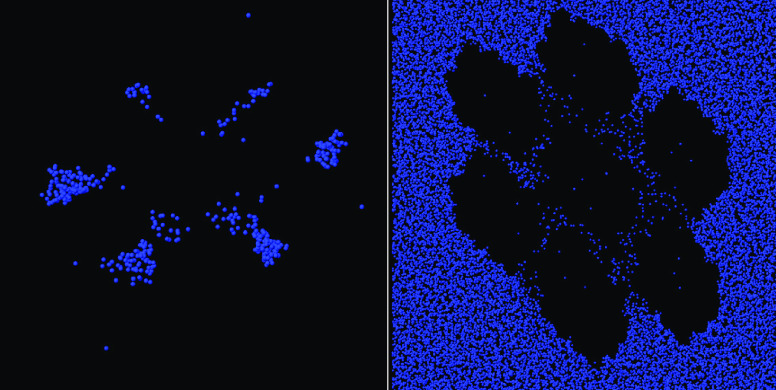
Polysaccharides play a crucial role in virtually all living systems. They also represent the biocompatible and fully sustainable component of a variety of nanoparticles, which are of increasing interest in biomedicine, food processing, cosmetics, and structural reinforcement of polymeric materials. The computational modeling of complex polysaccharide phases will assist in understanding the properties and behavior of all these systems. In this paper, structural, bonding, and mechanical properties of 10 wt % cellulose-callose hydrogels (β-glucans coexisting in plant cell walls) were investigated by atomistic simulations. Systems of this kind have recently been introduced in experiments revealing unexpected interactions between the polysaccharides. Starting from initial configurations inspired by X-ray diffraction data, atomistic models made of ∼1.6 × 10⁶ atoms provide a qualitatively consistent view of these hydrogels, displaying stability, homogeneity, connectivity, and elastic properties beyond those of a liquid suspension. The simulation shows that the relatively homogeneous distribution of saccharide nanofibers and chains in water is not due to the solubility of cellulose and callose, but to the formation of a number of cross-links among the various sample components. The broad distribution of strength and elasticity among the links implies a degree of anharmonicity and irreversible deformation already evident at low external load. Besides the qualitative agreement with experimental observations, the simulation results display also quantitative disagreements in the estimation of elastic coefficients, such as the Young's modulus, that require further investigation. Complementary simulations of dense cellulose-callose mixtures (no hydrogels) highlight the role of callose in smoothing the contact surface of different nanofibers forming larger bundles. Cellulose-callose structures in these systems displayed an enhanced water uptake and delayed dye release when compared to cellulose alone, highlighting potential new applications as drug delivery scaffolds. The simulation trajectories provide a tuning and testing ground for the development of coarse-grained models that are required for the large scale investigation of mechanical properties of cellulose and callose mixtures in a watery environment.


Conflict of interest statement

The authors declare no competing financial interest.

Figures

Figure 1
Figure 1
Atomistic structure of short segments of (a) cellulose and (b) callose chains simulated in the present study: gray dots, C; red dots, O; white dots, H. Both chains have been very briefly relaxed at T = 300 K during a few ps and do not represent equilibrium configurations. (c) Relation among the structure of the 10-, 18-, and 61-chain crystalline cellulose fibers illustrated through their cross section. The 10-chain core is painted yellow, and the 18- and 61-chain fibers are obtained by adding the cellulose chains painted in blue and in red, respectively. Irrespective of their color, all dots in (c) represent nonhydrogen atoms.
Figure 2
Figure 2
X-ray diffractogram of the dried cellulose hydrogel, showing an example of the peaks deconvoluted using the curve fitting process. The gray curve is the raw data, and the black curve is the fitting resulting from the peaks underneath. Peaks corresponding to crystallographic planes (101), (040), and (002) and to amorphous cellulose are used to calculate the crystallinity index reported in Figure 3.
Figure 3
Figure 3
X-ray diffraction of cellulose–Pachyman hydrogels shows a decrease in crystallinity with increasing the % of Pachyman. (a) Raw diffractograms obtained from dried hydrogels containing different Pachyman concentrations (%). Arrows indicate a peak presumably associated with (1,3)-β-glucan structures. (b) Percentage of crystallinity was calculated by the area method from deconvoluted peaks using curve fitting process. A steep reduction is observed at the 20% Pachyman concentration, suggesting less-organized structures.
Figure 4
Figure 4
Perspective view of the hydrogel sample of (a) lowest and (b) highest callose concentrations considered in the present simulation study. Black dots: C atoms in cellulose; Yellow dots: C atoms in callose; Red dots: O atoms in either cellulose and callose. Water oxygens and all H atoms not shown. Both snapshots refer to the samples after a 250 ns relaxation time.
Figure 5
Figure 5
Probability distribution P(l) for the end-to-end separation l of cellulose and callose chains. The sharp peak at l = 25 nm is due to the fully extended cellulose chains in crystalline nanofibers, whose contribution is not included in the average ⟨l⟩ value quoted for cellulose. For each of the two species, 4π∫0P(l)l2 dl is equal to the number of chains belonging to that species.
Figure 6
Figure 6
Snapshots showing the network of nanofibers and chains formed within ∼100 ns in the 76:24 cellulose/callose hydrogel sample. (a) Single cellulose chain (blue) joins one nanofiber and several other cellulose single chains. (b) Callose chain (blue) connects cellulose nanofibers, single cellulose chains, and other callose chains (yellow) in the same sample. Cellulose is represented by the dark gray (C) and red (O) dots. All structural units in the two panels are connected to the blue chain (either cellulose or callose) by the short links defined in the text.
Figure 7
Figure 7
(a) Water structure factor computed according to eq 1. Blue dots, 100:0; green diamonds, 92:8; red squares, 76:24. For the sake of clarity, 84:16 has been omitted. The inset compares the water structure factor computed on the hydrogel 100:0 sample and on bulk water. The difference at k ≤ 1 reflects the relative position of polysaccharide nanofibers and chains devoid of water molecules. (b) Structure factor of the polysaccharide fraction, in which each pyranose ring is represented by a single particle located at the geometric center of mass of the ring itself (see section III).
Figure 8
Figure 8
Strain ⟨ΔL⟩/L0 in the hydrogel samples as a function of the applied uniaxial stress σ. Red dots and line: 100:0 sample; blue squares and line: 76:24 sample. The lines are a guide to the eye.
Figure 9
Figure 9
Cross section of the cellulose nanofibers bundle used to investigate compact structure made of cellulose and callose. Panel (a) shows the initial geometry of the seven 18-chain nanofibers representing the cellulose fraction of the sample. Panel (b) shows the bundle at an intermediate stage (8 callose chains) of callose loading. Gray dots: C atoms; red dots: O atoms. H atoms are not shown.
Figure 10
Figure 10
From left to right: cross section of Bund-1, Bund-2, and Bund-3, respectively. The systems composition is summarized in Table 1. The carbon atoms of callose are painted yellow; the oxygen atoms of water are painted blue. The scale of Bund-3 is slightly reduced to show the amount of water in the sample.
Figure 11
Figure 11
Cross section of a large Iβ nanocrystal made by relaxing the cellulose bundle shown in Figure 9a. The nanocrystal displays dislocations (three of them are highlighted by the blue circles), a grain boundary (highlighted by the green box), and a few point defects.
Figure 12
Figure 12
Side view (slightly tilted, as shown by the bounding box) of sample Bund-2, whose surface is contaminated by water.
Figure 13
Figure 13
Cross section of samples Bund-2 (left) and Bund-3 (right). Cellulose and callose atoms have been removed to highlight the penetration of water into the bundle, as well as the preference of water for the interstitial callose layer. Only the water oxygen is shown, painted in blue.
Figure 14
Figure 14
Pachyman increases the water uptake capacity of cellulose. The graphs show mass loss after freeze-drying the hydrogels (brick red line and symbols) and mass recovery after full rehydration (black line and symbols). The x axis shows the percentage of Pachyman in each hydrogel. The results suggest an increase in water uptake (i.e., mass recovery) as the Pachyman concentration in the gel increases. The results are from three independent replicas and errors are standard deviation.
Figure 15
Figure 15
Hydrogels containing Pachyman (commercial (1,3)-β-glucan) display higher dye loading and slower dye release compared to cellulose gels. Graphs show (a) mass recovery after full rehydration of freeze-dried hydrogels used for dye loading/release, (b) percentage of dye loading after 24 h immersion of the gels in methylene blue solution, (c) percentage of dye released measured at 2 min intervals and for a total of 16 min, blue shows 100% cellulose, red shows 20% Pachyman, (d) the rate of the dye released when comparing 20% Pachyman and 100% cellulose hydrogels (0% Pachyman). Data presented in panel (a) are adjusted to a linear trend with a R2 = 0.87. Error bars are standard deviation.

Similar articles

Cited by

References

    1. Houston K.; Tucker M. R.; Chowdhury J.; Shirley N.; Little A. The plant cell wall: A complex and dynamic structure as revealed by the responses of genes under stress conditions. Front. Plant Sci. 2016, 7, 984.10.3389/fpls.2016.00984. - DOI - PMC - PubMed
    1. Somerville C.; Bauer S.; Brininstool G.; Facette M.; Hamann T.; Milne J.; Osborne E.; Paredez A.; Persson S.; Raab T.; et al. Towards a systems approach to understanding plant cell walls. Science 2004, 306, 2206–2211. 10.1126/science.1102765. - DOI - PubMed
    1. Sobhanadhas L. S. S.; Kesavan L.; Fardim P. Topochemical engineering of cellulose-based functional materials. Langmuir 2018, 34, 9857–9878. 10.1021/acs.langmuir.7b04379. - DOI - PMC - PubMed
    1. Eichhorn S. J.; Rahatekar S. S.; Vignolini S.; Windle A. H. New horizons for cellulose nanotechnology. Phil. Trans. R. Soc. A 2018, 376, 20170200.10.1098/rsta.2017.0200. - DOI - PMC - PubMed
    1. Hasan N.; Rahman L.; Kim S.-H.; Cao J.; Arjuna A.; Lallo S.; Jhun B. H.; Yoo J.-W. Recent advances of nanocellulose indrug delivery systems. J. Pharm. Investig. 2020, 50, 553–572. 10.1007/s40005-020-00499-4. - DOI

Publication types