. 2024 Apr 2;12(4):e0310023.
doi: 10.1128/spectrum.03100-23. Epub 2024 Feb 27.

Validation of a real-time polymerase chain reaction for the detection and quantification of the nucleic acid of Histoplasma from equine clinical samples

Affiliations

Validation of a real-time polymerase chain reaction for the detection and quantification of the nucleic acid of Histoplasma from equine clinical samples

Lewis W S Fisher et al. Microbiol Spectr. .

Abstract

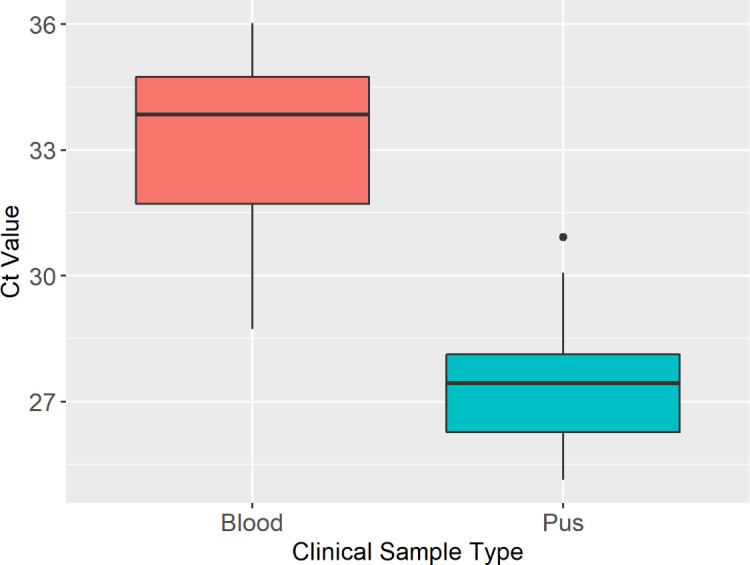
Histoplasma capsulatum var. farciminosum (HCF) is a dimorphic fungus that causes epizootic lymphangitis in equids. Current diagnostic approaches, including culture, microscopy, and clinical presentation, lack speed, sensitivity, and specificity when diagnosing clinical cases. In this study, equine blood and pus samples on Whatman FTA cards from Senegal (n = 3), The Gambia (n = 19), Ethiopia (n = 16), and Mali (n = 13) were tested using a real-time PCR (qPCR) protocol. The assay was optimized and tested for its suitability to detect and quantify HCF in blood and pus loaded onto Whatman FTA cards at sampling. Whatman FTA cards were tested for their suitability for use with qPCR and were found to recover DNA more efficiently than from direct extraction. Using TaqMan fluorescent probes and specific primers, the assay demonstrated 100% analytical specificity when detecting multiple strains of Histoplasma and no false positives with off-target organisms. The assay's diagnostic performance was measured against an existing nested internal transcribed spacer PCR protocol using a receiver operating characteristic curve. The test was found to have a diagnostic specificity and sensitivity of 100% and 71.4%, respectively, when analyzing pus samples using a cycle threshold (Ct) cutoff determined by Youden's index (27.75). Blood sample cutoff Ct value was proposed at 34.55. Further optimization is required to improve the performance of the protocol when applied to blood samples. This study has, for the first time, demonstrated the ability to detect and quantify the DNA of Histoplasma spp. in equine blood and pus samples with a high degree of accuracy, providing a platform to further investigate the pathogenesis and epidemiology of this disease.

Importance: Histoplasmosis is a neglected yet major cause of morbidity and mortality in both equids and people in resource-scarce settings. One of the major hindrances to the control of histoplasmosis is a lack of readily available diagnostic tests. Tests are needed to support clinical decision-making and to be applied in population-based research to further understand this disease in situ. This paper reports, for the first time, the validation and application of a qPCR to detect Histoplasma directly from equine clinical samples, bypassing the need to culture this notoriously difficult organism. We report and comment on the performance of the qPCR in comparison with our previously developed nested PCR.

Keywords: Histoplasma and West Africa; detecting Histoplasma equine samples; equine clinical samples; qPCR Histoplasma.


Conflict of interest statement

The authors declare no conflict of interest.

Figures

Fig 1
Fig 1
Varieties of clinical presentation of epizootic lymphangitis among equine cases in The Gambia. (A) Donkey with extensive severe cutaneous EZL, with cording on both forelimbs, involvement of axillary lymph nodes and extension to the chest and neck.(B) A young horse with moderate cutaneous EZL affecting the right forelimb and chest region. Clusters of variably ruptured pyogranulomatous cutaneous lesions are visible. (C) A severe case with respiratory, cutaneous, and ocular signs. There are ulcerative plaques on the muzzle and within the nasal mucosa, pyogranulomatous lesions around each eye with purulent discharge, and skin excoriation.
Fig 2
Fig 2
The coefficient of variance plotted against the log10 copy number of a series of standard curves. The blue line depicts the variation between assays is 5%, while the red line indicates 10% variations between assays.
Fig 3
Fig 3
An ROC curve demonstrating the performance of the qPCR method compared with a nested ITS method. The red line indicates assay performance with an area under the curve (AUC) of 0.786.
Fig 4
Fig 4
An analysis of a correlation between the Ct values of 12 paired pus and blood samples from 9 horses and 3 donkeys in The Gambia. The graph shows the relationship between the Ct values of blood and pus. No significant relationship was found between positive blood and positive pus samples. The blue vertical line represents the Youden’s index cut-off value in pus (27.75) determined by the ROC curve in Fig. 3. The red horizonal line represents the mean Ct value of standards used to determine the limit of detection (34.55).
Fig 5
Fig 5
Box and whisker plot comparing DNA yield (Ct value) between direct extraction (red) and FTA cards (blue) obtained from blood spiked with serial dilutions of Histoplasma genomic DNA. These data show that FTA cards spiked with blood (n = 20, mean = 24.65, SD = 4.90) consistently yield lower Ct values than DNA extracts prepared directly from whole blood spiked with genomic Histoplasma (n = 20, mean = 25.81, SD = 4.73 paired t-test P-value <0.001).
Fig 6
Fig 6
Comparing Ct values obtained from clinical blood and pus samples from The Gambia. Distribution of Ct values of blood and pus samples from 16 horses and 3 donkeys. Ct values in blood (n = 19, min = 28.73, max = 36.02, median = 33.85, range = 7.29; donkeys = 3 and horses = 16) and pus (n = 13, min = 25.13, max = 30.92, range = 5.79, median = 27.44; donkeys = 3 and horses = 10). The dot outside of the box and whisker plot represents one outlying data point.
Fig 7
Fig 7
Box and whisker plots of the distribution of Ct values obtained from blood and pus samples from horses and donkeys with EZL. Left hand panel: Distribution of Ct values obtained from pus samples from 3 donkeys and 10 horses from The Gambia. Pus samples from donkeys yielded lower Ct values than pus samples from horses (Ct values among donkeys: min = 25.58, max = 26.28, median = 26.16, range = 0.70 and horses: min = 25.13, max = 30.92, median = 27.65, range = 5.79). The dots outside of the box and whisker plot represent outlying data points. Right hand panel: Distribution of Ct values obtained from blood samples from 3 donkeys and 16 horses from The Gambia. Although the median Ct values for blood samples were generally lower in donkeys compared to horses, this was not statistically significant (Wilcoxon rank-sum test P-value = 0.303). The comparison of the Ct values between donkeys (Ct values from donkeys: mean = 31.72, SD = 2.76 and horses: min = 30.14, max = 36.02, range = 5.88, median = 33.94).
Fig 8
Fig 8
Comparison of distribution of Ct values obtained from pus and blood samples among mild (red) and severe (blue) cases of EZL. Left hand panel: Comparison of Ct values obtained from pus samples from nine horses and one donkey with EZL. Mild cases of EZL were significantly associated with higher Ct values than severe cases (Wilcoxon rank-sum P = 0.007). (Distribution of Ct values in mild cases: median = 28.71, min = 27.55, max = 30.92; distribution of CT values in severe cases of EZL: median = 26.72, min = 25.13, max = 27.44.) Right hand panel: Comparison of Ct values obtained from blood samples from 16 horses and 1 donkey with EZL. Those with mild disease (n = 11) tended to yield lower Ct values than those with severe disease (n = 5); however, this was not statistically significant Wilcoxon rank-sum P = 0.18. Ct values obtained from blood samples from mild (median 33.76, min = 30.15, max = 35.97) and severe cases (median 34.19, min = 32.83, max = 36.02).

References

    1. Stringer A. 2014. Improving animal health for poverty alleviation and sustainable livelihoods. Vet Rec 175:526–529. doi:10.1136/vr.g6281 - DOI - PubMed
    1. Jones K. 2006. Epizootic lymphangitis: the impact on subsistence economies and animal welfare. Vet J 172:402–404. doi:10.1016/j.tvjl.2006.06.003 - DOI - PubMed
    1. Ameni G. 2006. Epidemiology of equine histoplasmosis (epizootic lymphangitis) in carthorses in Ethiopia. Vet J 172:160–165. doi:10.1016/j.tvjl.2005.02.025 - DOI - PubMed
    1. Endebu B, Roger F. 2003. Comparative studies on the occurrence and distribution of epizootic lymphangitis and ulcerative lymphangitis in Ethiopia. Int J Appl Res Vet Med 1:219–224.
    1. WAHID Interface OIE . 2005. Epizootic lymphangitis disease distribution map. Available from: http://www.oie.int/wahis_2/public/wahid.php/Diseaseinformation/Diseasedi...