. 2024 Apr 10;15(4):e0346323.
doi: 10.1128/mbio.03463-23. Epub 2024 Feb 27.

The Caenorhabditis elegans proteome response to two protective Pseudomonas symbionts

Affiliations

The Caenorhabditis elegans proteome response to two protective Pseudomonas symbionts

Barbara Pees et al. mBio. .

Abstract

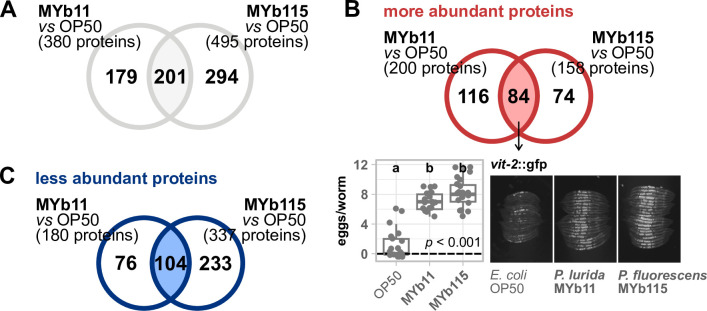
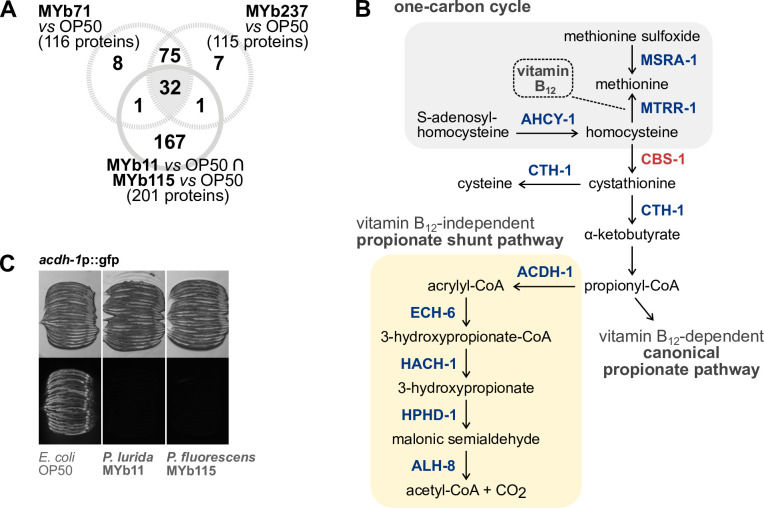
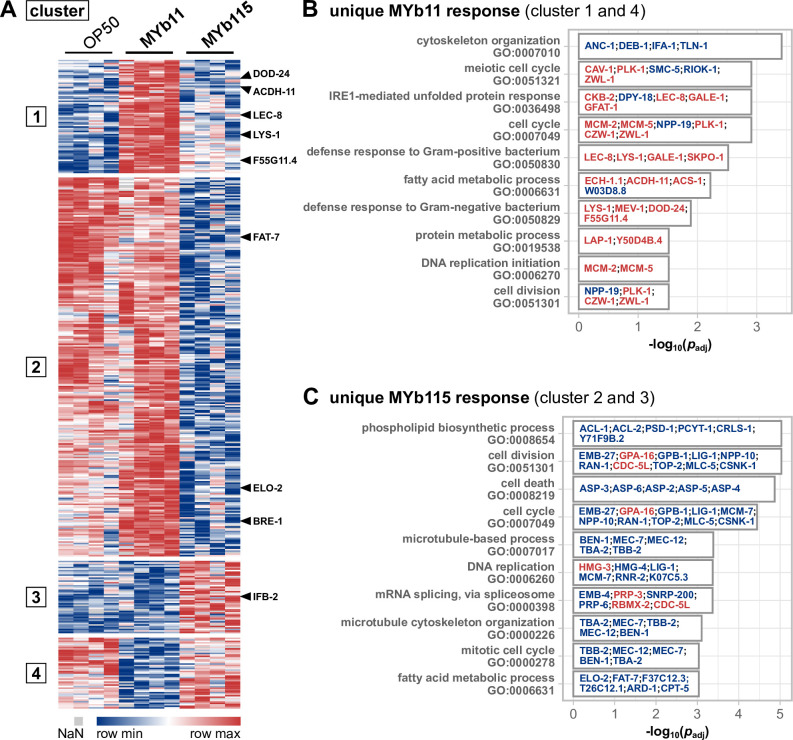
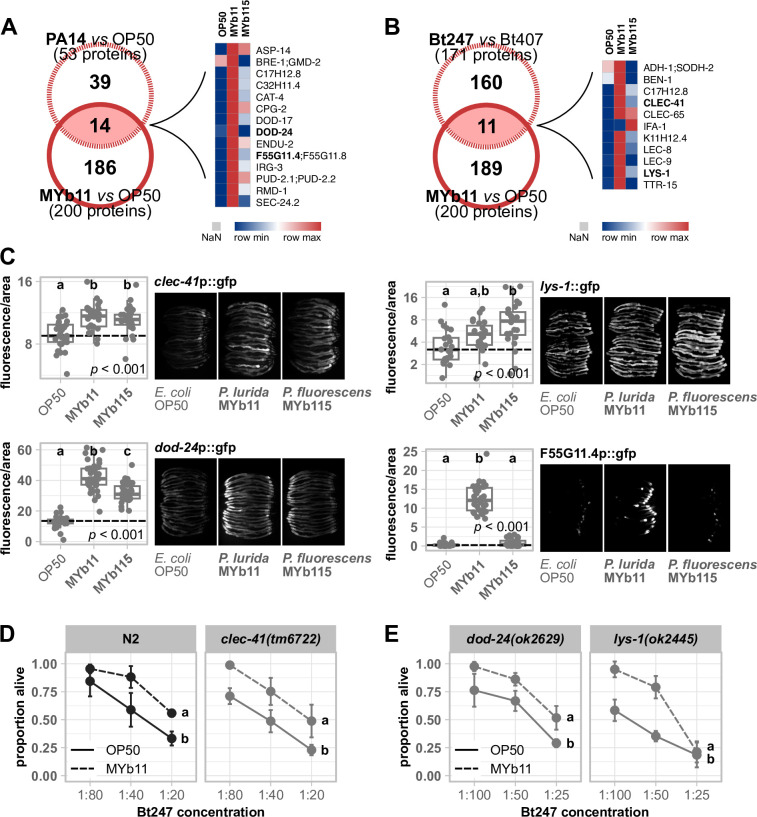
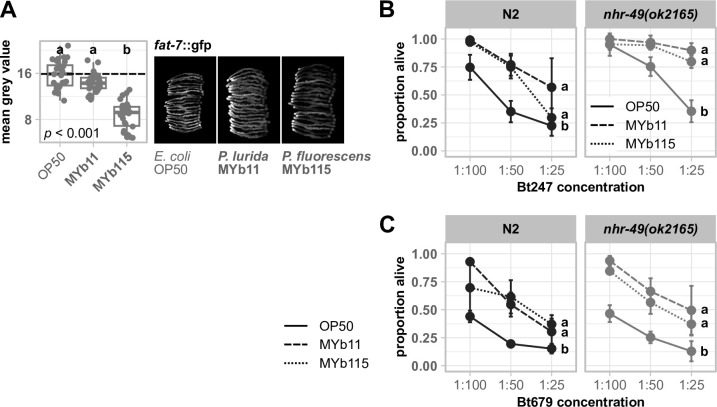
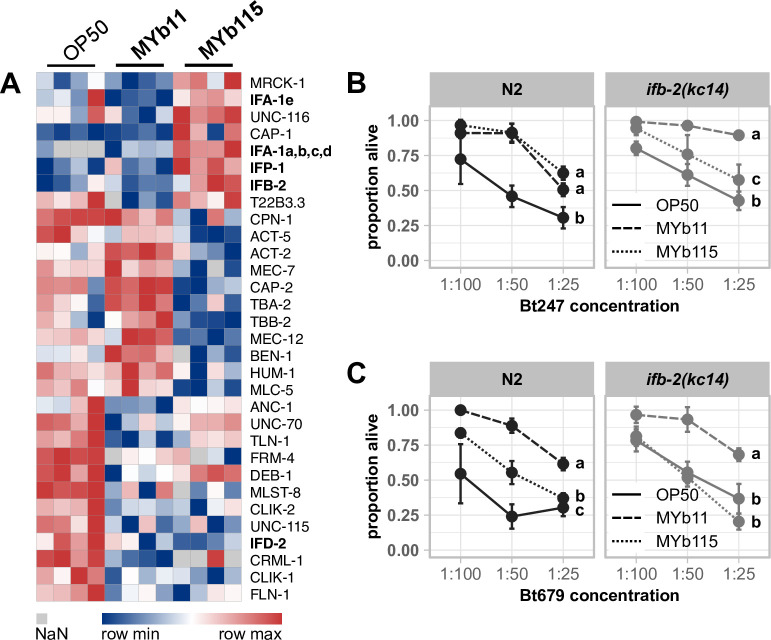
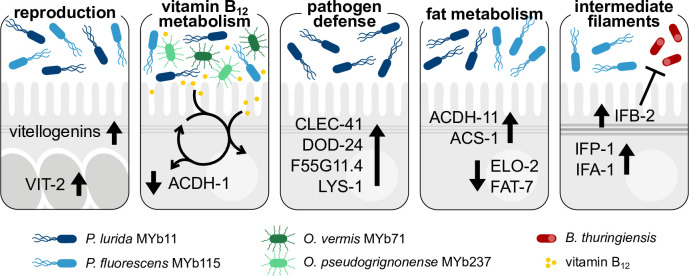
The Caenorhabditis elegans natural microbiota isolates Pseudomonas lurida MYb11 and Pseudomonas fluorescens MYb115 protect the host against pathogens through distinct mechanisms. While P. lurida produces an antimicrobial compound and directly inhibits pathogen growth, P. fluorescens MYb115 protects the host without affecting pathogen growth. It is unknown how these two protective microbes affect host biological processes. We used a proteomics approach to elucidate the C. elegans response to MYb11 and MYb115. We found that both Pseudomonas isolates increase vitellogenin protein production in young adults, which confirms previous findings on the effect of microbiota on C. elegans reproductive timing. Moreover, the C. elegans responses to MYb11 and MYb115 exhibit common signatures with the response to other vitamin B12-producing bacteria, emphasizing the importance of vitamin B12 in C. elegans-microbe metabolic interactions. We further analyzed signatures in the C. elegans response specific to MYb11 or MYb115. We provide evidence for distinct modifications in lipid metabolism by both symbiotic microbes. We could identify the activation of host-pathogen defense responses as an MYb11-specific proteome signature and provide evidence that the intermediate filament protein IFB-2 is required for MYb115-mediated protection. These results indicate that MYb11 not only produces an antimicrobial compound but also activates host antimicrobial defenses, which together might increase resistance to infection. In contrast, MYb115 affects host processes such as lipid metabolism and cytoskeleton dynamics, which might increase host tolerance to infection. Overall, this study pinpoints proteins of interest that form the basis for additional exploration into the mechanisms underlying C. elegans microbiota-mediated protection from pathogen infection and other microbiota-mediated traits.IMPORTANCESymbiotic bacteria can defend their host against pathogen infection. While some protective symbionts directly interact with pathogenic bacteria, other protective symbionts elicit a response in the host that improves its own pathogen defenses. To better understand how a host responds to protective symbionts, we examined which host proteins are affected by two protective Pseudomonas bacteria in the model nematode Caenorhabditis elegans. We found that the C. elegans response to its protective symbionts is manifold, which was reflected in changes in proteins that are involved in metabolism, the immune system, and cell structure. This study provides a foundation for exploring the contribution of the host response to symbiont-mediated protection from pathogen infection.

Keywords: Caenorhabditis elegans; Pseudomonas; microbiota; microbiota-mediated protection; proteome.


Conflict of interest statement

The authors declare no conflict of interest.

Figures

Fig 1
Fig 1
Proteomic response of C. elegans toward Pseudomonas symbionts. Venn diagrams showing (A) all significantly differentially abundant proteins resulting from comparing either MYb11-exposed worms to OP50-exposed worms or MYb115-exposed worms to OP50-exposed worm, (B) only the significantly more abundant proteins, or (C) the significantly less abundant proteins; ANOVA, post hoc Tukey HSD, P > 0.05. (B) Transgenic C. elegans reporter strain vit-2::gfp demonstrating in vivo abundance of VIT-2. Worms were exposed to either E. coli OP50, P. lurida MYb11, or P. fluorescens MYb115, and gfp signals were imaged in groups of 20 individuals as young adults. Worms were arranged with the heads pointing to the right. The boxplot displays the quantification of VIT-2-expressing eggs/embryos in young adults (24 h post-L4). Each dot represents one worm with n = 20, and the dashed line represents the median number of eggs per worm for OP50-exposed worms. The P-value indicates the statistical significance among the differently exposed worms according to a Kruskal-Wallis rank sum test (27). The post hoc Dunn’s test (28) with Bonferroni correction provides the statistical significances between the differently exposed worms and is denoted with letters (same letters indicate no significant differences). Raw data and corresponding P-values are provided in Table S6.
Fig 2
Fig 2
Changes in vitamin B12-dependent metabolism are shared proteomic responses to Pseudomonas and Ochrobactrum symbionts. (A) Venn diagram showing all significantly differentially abundant proteins resulting from the overlap of the comparison MYb11 vs OP50 and MYb115 vs OP50 compared against differentially abundant proteins on Ochrobactrum MYb71 and MYb237. (B) Excerpt of the one-carbon cycle (gray background) and the propionate pathways (yellow background). The steps that involve commonly differentially abundant proteins in worms grown on Pseudomonas and Ochrobactrum symbionts are shown. Protein coloring depicts either less abundant (blue) or more abundant (red) proteins. CoA, coenzyme A. Adapted from references (35, 36). (C) Transgenic C. elegans reporter strain acdh-1p::gfp demonstrating in vivo expression of acdh-1. Worms were exposed to either E. coli OP50, P. lurida MYb11, or P. fluorescens MYb115, and gfp signals were imaged in groups of 20 individuals as young adults. Worms were arranged with the heads pointing to the right; transmission light images in the upper panel correspond to fluorescence images in the lower panel.
Fig 3
Fig 3
Differences in the proteomic responses of C. elegans toward P. lurida MYb11 compared to P. fluorescens MYb115. (A) Heatmap showing the log2 label-free intensity values of differentially abundant proteins in the comparison of MYb11-exposed worms against MYb115-exposed worms. The columns denote the bacterial treatment with four replicates each, and each row represents one protein. By including the data on OP50, abundance values were separated into four clusters using the k-means clustering approach. The rows of exemplary proteins mentioned in the text are marked on the heatmap’s right. Bar plot of significantly enriched gene ontology terms in either (B) clusters 1 and 4 (different abundances of proteins uniquely in MYb11-treated worms) or (C) clusters 2 and 3 (different abundances of proteins uniquely in MYb115-treated worms). The proteins that are assigned to the respective GO term are noted on the bars, their coloring indicates higher (red) or lower (blue) abundance. Shown are the 10 GO terms with the highest significance. The complete list of GO terms is given in Tables S4 and S5.
Fig 4
Fig 4
MYb11 activates the expression of C. elegans innate immune response genes and proteins. Venn diagrams showing significantly more abundant proteins resulting from the comparison of MYb11 vs OP50 against significantly more abundant proteins of (A) P. aeruginosa PA14 vs E. coli OP50 and (B) B. thuringiensis Bt247 vs non-pathogenic strain Bt407. The accompanying heatmaps represent the averaged log2 label-free intensity values (n = 4) of the overlapping significant proteins. Data were taken from references (50, 51). (C) Transgenic C. elegans reporter strains demonstrating in vivo expression of selected promotor sequences tagged with gfp. Transgenic strains were exposed to either E. coli OP50, P. lurida MYb11, or P. fluorescens MYb115, and fluorescent signals were imaged in groups of 20 individuals as young adults. Worms were arranged with the heads pointing to the right. The boxplots display the quantification of the gfp fluorescence in young adults (24 h post-L4) normalized by the worm’s body size (area). Each dot represents one worm with n = 29–35, and the dashed line represents the median of the mean gray value for OP50-exposed worms. The P-value indicates the statistical significance among the differently exposed worms according to Kruskal-Wallis rank sum test (27). The post hoc Dunn’s test (28) with Bonferroni correction provides the statistical significances between the differently exposed worms and is denoted with letters (same letters indicate no significant differences). (D and E) Survival of mutants clec-41(tm6722), dod-24(ok2629), and lys-1(ok2445) and wild-type N2 infected with serial dilutions of B. thuringiensis Bt247 after 24 hpi (post-infection). Worms were exposed to either OP50 or MYb11, before and during infection. Each dot represents the mean ± standard deviation of four worm populations (n = 4). The same letters indicate no significant differences between the dose-response curves according to a generalized linear model (52) and Bonferroni correction. Raw data and corresponding P-values are provided in Table S6, and an additional repetition of the experiment (D) can be found in Fig. S4.
Fig 5
Fig 5
Divergent proteomic changes in fat metabolism occur in MYb11- and MYb115-exposed worms, but common fat metabolism regulator NHR-49 is not involved in the defense against Bt infection. (A) Transgenic C. elegans reporter strain demonstrating in vivo abundance of FAT-7. Worms were exposed to either E. coli OP50, P. lurida MYb11, or P. fluorescens MYb115, and gfp signals were imaged in groups of 20 individuals as young adults. Worms were arranged with the heads pointing to the right. The boxplots display the quantification of the gfp fluorescence in young adults (24 h post-L4) normalized by the worm’s body size (area). Each dot represents one worm with n = 29–30, and the dashed line represents the median of the mean gray value for OP50-exposed worms. The P-value indicates the statistical significance among the differently exposed worms according to a Kruskal-Wallis rank sum test (27). The post hoc Dunn’s test (28) with Bonferroni correction provides the statistical significances between the differently exposed worms and is denoted with letters (same letters indicate no significant differences). (B) Survival of mutant nhr-49(ok2165) and wild-type N2 infected with serial dilutions of (B) B. thuringiensis Bt247 or (C) Bt679 after 24 hpi. Worms were fed with either OP50, MYb11, or MYb115 before and during infection. Each dot represents the mean ± standard deviation of (B) four or (C) three worm populations (n = 3–4). The same letters indicate no significant differences between the dose-response curves according to a generalized linear model (52) and Bonferroni correction. Raw data and corresponding P-values are provided in Table S6, and additional repetitions of the same experiments can be found in Fig. S5.
Fig 6
Fig 6
MYb115-mediated protection against Bt infection may depend on IFB-2. (A) Heatmap showing the log2 label-free intensity values of identified proteins related to the GO term cytoskeleton. The columns denote the bacterial treatment with four replicates each, and each row represents one protein. Survival of wild-type N2 and mutant ifb-2(kc14) infected with serial dilutions of (B) B. thuringiensis Bt247 or (C) Bt679 after 24 hpi. Worms were exposed to either OP50, MYb11, or MYb115 before and during infection. Each dot represents the mean ± standard deviation of (B) four or (C) three worm populations (n = 3–4). The same letters indicate no significant differences between the dose-response curves according to a generalized linear model (52) and Bonferroni correction. Raw data and corresponding P-values are provided in Table S6, and additional repetitions of the same experiments can be found in Fig. S6.
Fig 7
Fig 7
Candidate proteins that are potentially involved in C. elegans microbiota-mediated protection. Both Pseudomonas isolates, P. lurida MYb11 and P. fluorescens MYb115, increase C. elegans vitellogenin protein production and affect host vitamin B12 metabolism. The latter is also affected by other vitamin B12-producing microbiota bacteria, such as O. vermis MYb71 and O. pseudogrignonense MYb237. MYb11 activates host-pathogen defense responses more strongly than MYb115. Moreover, both MYb11 and MYb115 modify host fat metabolism but affect different proteins. MYb115 increases intermediate filament proteins, and MYb115-mediated protection against Bt infection was reduced in an ifb-2 mutant.

References

    1. Zhang J, Holdorf AD, Walhout AJ. 2017. C. elegans and its bacterial diet as a model for systems-level understanding of host–microbiota interactions. Curr Opin Biotechnol 46:74–80. doi:10.1016/j.copbio.2017.01.008 - DOI - PMC - PubMed
    1. Roselli M, Schifano E, Guantario B, Zinno P, Uccelletti D, Devirgiliis C. 2019. Caenorhabditis elegans and probiotics interactions from a prolongevity perspective. Int J Mol Sci 20:5020. doi:10.3390/ijms20205020 - DOI - PMC - PubMed
    1. Dirksen P, Marsh SA, Braker I, Heitland N, Wagner S, Nakad R, Mader S, Petersen C, Kowallik V, Rosenstiel P, Félix M-A, Schulenburg H. 2016. The native microbiome of the nematode Caenorhabditis elegans: gateway to a new host-microbiome model. BMC Biol 14:38. doi:10.1186/s12915-016-0258-1 - DOI - PMC - PubMed
    1. Zhang F, Berg M, Dierking K, Félix M-A, Shapira M, Samuel BS, Schulenburg H. 2017. Caenorhabditis elegans as a model for microbiome research. Front Microbiol 8:485. doi:10.3389/fmicb.2017.00485 - DOI - PMC - PubMed
    1. Dirksen P, Assié A, Zimmermann J, Zhang F, Tietje A-M, Marsh SA, Félix M-A, Shapira M, Kaleta C, Schulenburg H, Samuel B. 2020. CeMbio - the Caenorhabditis elegans microbiome resource. G3 G3.401309.2020 - PMC - PubMed

MeSH terms