. 2024 Jun;13(15):e2304188.
doi: 10.1002/adhm.202304188. Epub 2024 Mar 9.

Intranasal Epitope-Polymer Vaccine Lodges Resident Memory T Cells Protecting Against Influenza Virus

Affiliations

Intranasal Epitope-Polymer Vaccine Lodges Resident Memory T Cells Protecting Against Influenza Virus

Ziyang Liu et al. Adv Healthc Mater. 2024 Jun.

Abstract

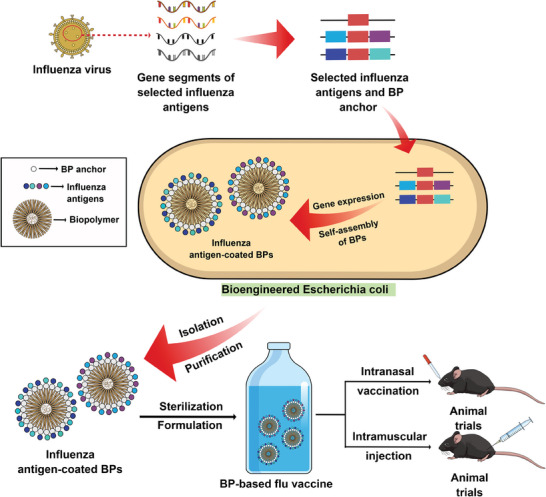
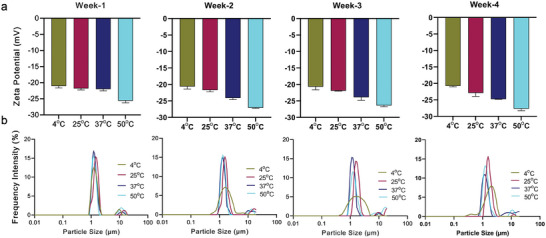
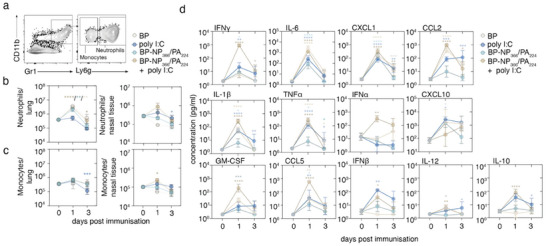
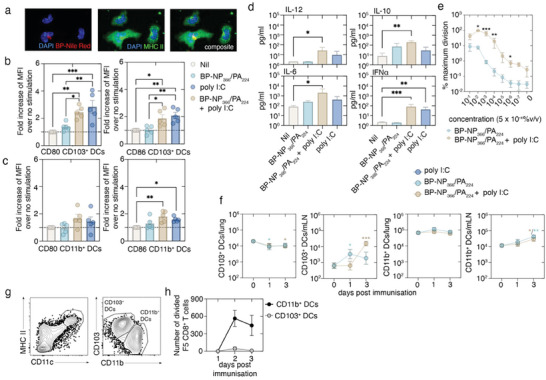
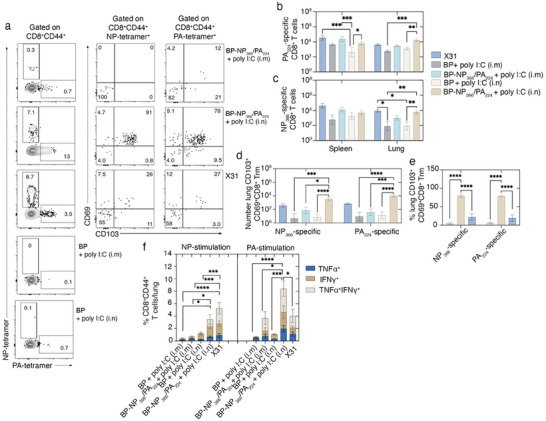
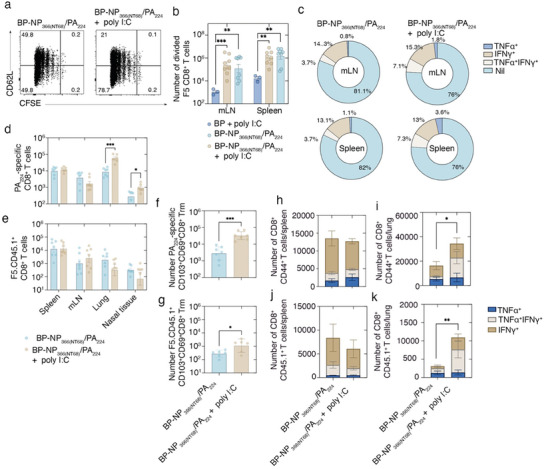
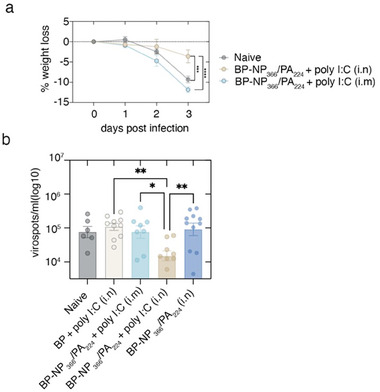
Intranasal vaccines, unlike injectable vaccines, boost immunity along the respiratory tract; this can significantly limit respiratory virus replication and shedding. There remains a need to develop mucosal adjuvants and vaccine delivery systems that are both safe and effective following intranasal administration. Here, biopolymer particles (BP) densely coated with repeats of MHC class I restricted immunodominant epitopes derived from influenza A virus namely NP366, a nucleoprotein-derived epitope and PA224, a polymerase acidic subunit derived epitope, are bioengineered. These BP-NP366/PA224 can be manufactured at a high yield and are obtained at ≈93% purity, exhibiting ambient-temperature stability. Immunological characterization includes comparing systemic and mucosal immune responses mounted following intramuscular or intranasal immunization. Immunization with BP-NP366/PA224 without adjuvant triggers influenza-specific CD8+ T cell priming and memory CD8+ T cell development. Co-delivery with the adjuvant poly(I:C) significantly boosts the size and functionality of the influenza-specific pulmonary resident memory CD8+ T cell pool. Intranasal, but not intramuscular delivery of BP-NP366/PA224 with poly(I:C), provides protection against influenza virus challenge. Overall, the BP approach demonstrates as a suitable antigen formulation for intranasal delivery toward induction of systemic protective T cell responses against influenza virus.

Keywords: influenza; intranasal delivery; polyhydroxybutyrate; resident memory T cells; subunit vaccine; vaccine.


Conflict of interest statement

B.H.A.R. is a cofounder and shareholder of PolyBatics Ltd.

Figures

Figure 1
Figure 1
Schematic diagram of the design and manufacturing process of influenza antigen‐coated biopolymer particles (BPs) and induction of protective immunity against influenza in a mouse model. An endotoxin‐free E. coli strain was bioengineered and used for one‐step production of influenza antigen‐coated BP vaccines. The produced BPs were subsequently isolated, purified, sterilized, and formulated prior to the evaluation of immunogenicity and protective immunity of influenza antigen‐coated BP vaccines in mice.
Figure 2
Figure 2
Design, production, and characterization of influenza A virus antigen‐coated biopolymer particles (BPs). a) Schematic of hybrid gene encoding influenza A virus epitopes translationally fused to the BP anchor protein. PA, polymerase acidic subunit derived epitope; NP, nucleoprotein derived epitope. b) SDS‐PAGE analysis of BP associated proteins. Empty BPs; BNP, BP‐NP366/PA224 (epitope‐coated BPs); M, molecular weight standard. c) Polyhydroxybutyrate (PHB) content analysis of BP producing cells and purified BPs. d) Surface charge analysis of BPs and their formulation with adjuvant poly(I:C) using Zeta sizer. e) Size distribution analysis of BPs and their formulation with adjuvant poly(I:C) using dynamic laser scattering. f) Transmission electron microscopy images of BP‐producing cells and purified BPs.
Figure 3
Figure 3
Thermostability study of BP‐NP366/PA224 at four different temperatures for 4 weeks. a) Surface charge and b) size distribution of BP‐NP366/PA224 stored at different temperatures for different times. Data shown are mean values of triplicates plus standard deviation.
Figure 4
Figure 4
Intranasal delivery of BP‐NP366/PA224 triggers transient inflammation along the respiratory tract. a) Representative flow cytometry profiles gated on CD11b+ and Gr‐1+ cells and further subdivided into Ly6g+ (neutrophils) and Ly6g‐(monocytes). The absolute number of b) neutrophils and c) monocytes in the lung. Symbols represent the mean ± SEM. Data pooled from five independent experiments (n = 2–21 mice per group/time point, two‐way analysis of variance (ANOVA), Dunnett's multiple comparison). d) Mice were intranasally administered 50 µL of BP alone, BP‐NP366/PA224, 50 µL of BP‐NP366/PA224 with 20 µg of poly(I:C), or 20 µg of poly(I:C) alone. On days 0, 1, and 3 post‐immunization, BALF was collected and the concentration of a panel of chemokines/cytokines was measured by cytometric bead array. Data pooled from four independent experiments with n = 3–7 mice per group/time point. Symbols represent the mean ± SEM. Two‐way ANOVA with Dunnett's multiple comparison. *p < 0.05, **p < 0.01, ***p < 0.001, and ****p < 0.0001.
Figure 5
Figure 5
BP‐NP366/PA224 alone does not activate dentritic cells (DCs) but can effectively prime T cell responses. a) DCs purified from the spleen of mice were cultured with Nile Red labeled BPs for 3 h prior to staining and imaging. Representative images show Nile Red BPs (red), MHC‐II (green), and DAPI (blue). Immunofluorescent imaging was performed on a 63× objective. b,c) The expression of CD80 and CD86 on CD103+ and CD11b+ DCs subsets in the spleen following overnight culture with various stimulants. The fold increase in the mean fluorescent intensity of CD80 and CD86 on CD103+ (b) and CD11b+ DC subsets (c) exposed to the various stimulants relative to the expression of the non‐stimulated controls. Symbols represent individual experiments, and the bars show the mean ± SEM. Data pooled from five independent experiments (one‐way ANOVA, Tukey's multiple comparison). d) Supernatants collected from the cultures described in (b) were screened for a panel of inflammatory cytokines using a cytometric bead array. Bars show the mean ± SEM. Data pooled from five independent experiments (one‐way ANOVA, Tukey's multiple comparison). e) 50 000 CFSE labeled F5 CD8+ T cells were cultured with varying concentrations of BP‐NP366(DAM)/PA224 with or without 20 µg of poly (I:C) and 200 000 DCs enriched from the spleen of mice and 60 h later, the number of divided F5 CD8+ T cells (CFSElo) was measured by flow cytometry. The graph shows the relative proliferation seen as a percentage of the maximum proliferation per assay. Data pooled from three independent experiments represents the percentage maximum division ± SEM. f) Mice were intranasally administered 50 µL of BP‐NP366(NT68)/PA224 either alone or with 20 µg of poly(I:C), or 20 µg of poly(I:C) alone. On days 0, 1, and 3 post‐immunization, the number of CD103+ DCs and CD11b+ DCs in the lung and mediastinal lymph node (mLN) was measured by flow cytometry. Symbols represent the mean ± SEM. Data pooled from five independent experiments (n = 2–21 mice per group/time point, two‐way ANOVA, Dunnett's multiple comparison). g) Representative flow cytometry profiles showing the gating strategy to identify CD103+ and CD11b+ DCs. h) Graph shows the absolute number of divided cells ± SEM. Data pooled from three independent experiments. *p < 0.05, **p < 0.01, ***p < 0.001, and ****p < 0.0001.
Figure 6
Figure 6
Intranasal immunization with BP‐NP366/PA224 generates NP366 and PA224‐ specific lung CD103+CD69+ CD8+ Trm. Mice were infected intranasally with 104 PFU X31 or immunized either intranasally (i.n.) or intramuscularly (i.m.) with 5 µg antigen per 50 µL of either BP‐NP366/PA224 + 20 µg of poly(I:C) or blank BPs + 20 µg of poly(I:C) at d0 (primary immunization), d14 (secondary immunization), and d28 (tertiary immunization), and tissue was collected 2 weeks after the final boost. a) Representative flow cytometry profiles gated on CD8+CD44+ T cells showing the proportion of DbNP366‐tetramer+ and DbPA224‐tetramer+ CD8+ T cells in the lung that co‐expressed Trm surface markers CD103 and CD69. b,c) The absolute number of DbPA224 tetramer+ (b) or DbNP366 tetramer+ CD8+ CD44+ T cells in the lung and spleen (c). d) The absolute number and e) percentage of DbNP366‐tetramer+ and DbPA224‐tetramer+ CD8+ T cells in the lung expressing Trm surface markers CD69 and CD103. The bars represent the mean ± SEM. Data were pooled from three independent experiments with n = 5–13 mice per group. f) The percentage of cytokine‐producing CD8+CD44+ T cells in the lung following a brief in vitro stimulation with either NP366 or PA224 peptide. The bars represent the mean ± SEM. Data pooled from three independent experiments with n = 5–13 mice per group. Two‐way ANOVA with Tukey's multiple comparison. *p < 0.05, **p < 0.01, ***p < 0.001, and ****p<0.0001.
Figure 7
Figure 7
Co‐administration of BP‐NP366/PA224 with poly (I:C) boosts influenza‐specific memory CD8+ T cell development but does not impact T cell priming. a–c) C57BL/6 mice (CD45.2) were seeded with 106 CFSE labeled F5.CD45.1+ CD8+ T cells 1 day prior to intranasal immunization with either 5 µg antigen per 50 µL of BP‐NP366(NT68)/PA224 + 20 µg of poly(I:C), 5 µg antigen per 50 µL of BP‐NP366(NT68)/PA224 alone, or 50 µL of BP + 20 µg of poly(I:C), and the number of divided F5 CD8+ T cells (CFSElo) in the mLN and spleen 4 days later was measured by flow cytometry. Representative flow cytometry profiles gated on F5.CD45.1+ CD8+ T cells in the mLN showing the level of expression of CD62L and dilution of CFSE (a). The absolute number of divided (CFSElo) F5 CD8+ T cells in the mLN and spleen. Bars represent the mean ± SEM and symbols represent individual mice. Two‐way ANOVA with Tukey's multiple comparison (b). The percentage of cytokine‐producing F5.CD45.1+ CD8+ T cells in the spleen and mLN following a brief in vitro stimulation with NP366(NT68) peptide. Pie graphs show the proportion of F5 CD8+ T cells making IFNγ, TNFα, or both (c). d) Mice were seeded with 50 000 naïve F5.CD45.1 CD8+ T cells 1 day prior to intranasal immunization with either 5 µg antigen per 50 µL of BP‐NP366(NT68)/PA224 + 20 µg of poly(I:C) or 5 µg antigen per 50 µL of BP‐NP366(NT68)/PA224 alone at d0 (primary immunization), d14 (secondary immunization), and d28 (tertiary immunization). At day 42 post‐immunization, lung, nasal tissue, mLN, and spleen were harvested. d,e) The absolute number of PA244 tetramer+ (d) or F5.CD45.1+ CD8+ CD44+ T cells (e) in the lung, nasal tissue, spleen, and mLN. The bars represent the mean ± SEM symbols represent individual mice. Data were pooled from two independent experiments with n = 7 mice per group. Two‐way ANOVA with Tukey's multiple comparison. f,g) The absolute number of PA244‐tetramer+ CD8+ T cells (f) and F5.CD45.1+ CD8+ T cells in the lung expressing Trm surface markers CD69 and CD103 (g). The bars represent the mean ± SEM symbols represent individual mice. Data were pooled from two independent experiments with n = 7 mice per group. Student's t‐test. h–k) The number of cytokine‐producing CD8+ CD44+ T cells in the spleen (h,j) and lung (i,k) following a brief in vitro stimulation with either PA244 peptide (h,i) or NP366(NT68) peptide (j,k). The bars represent the mean ± SEM. Data were pooled from two independent experiments with n = 7 mice per group. *p < 0.05, **p < 0.01, ***p < 0.001, and ****p < 0.0001.
Figure 8
Figure 8
Intranasal immunization with BP‐NP366/PA224 protects against pulmonary influenza challenge. Mice were immunized either intranasally (i.n.) or intramuscularly (i.m.) with 5 µg antigen per 50 µL of BP‐NP366/PA224 + 20 µg of poly(I:C), BP‐NP366/PA224 alone, or BP + 20 µg of poly(I:C) at d0 (primary immunization), d14 (secondary immunization), and d28 (tertiary immunization). At day 42 post‐immunization, mice were challenged intranasally with 104 PFU of X31 influenza virus. a) Graph depicts average weight loss following influenza challenge. b) Viral loads in the lung on day 3 infection post‐infection. Symbols represent individual mice and the bars represent the mean ± SEM. Two‐way ANOVA with Tukey's multiple comparison.

Similar articles

Cited by

References

    1. Paget J., Spreeuwenberg P., Charu V., Taylor R. J., Iuliano A. D., Bresee J., Simonsen L., Viboud C., J. Global Health 2019, 9, 020421. - PMC - PubMed
    1. de Courville C., Cadarette S. M., Wissinger E., Alvarez F. P., Influenza Other Respir. Viruses 2022, 16, 376. - PMC - PubMed
    1. Barberis I., Myles P., Ault S. K., Bragazzi N. L., Martini M., J. Prev. Med. Hyg. 2016, 57, E115. - PMC - PubMed
    1. Wu T., Hu Y., Lee Y. T., Bouchard K. R., Benechet A., Khanna K., Cauley L. S., J. Leukoc. Biol. 2014, 95, 215. - PMC - PubMed
    1. Wakim L. M., Smith J., Caminschi I., Lahoud M. H., Villadangos J. A., Mucosal Immunol. 2015, 8, 1060. - PubMed

Publication types

MeSH terms