Review
. 2024 Feb;310(2):e232558.
doi: 10.1148/radiol.232558.

Fleischner Society: Glossary of Terms for Thoracic Imaging

Affiliations
Review

Fleischner Society: Glossary of Terms for Thoracic Imaging

Alexander A Bankier et al. Radiology. 2024 Feb.

Abstract

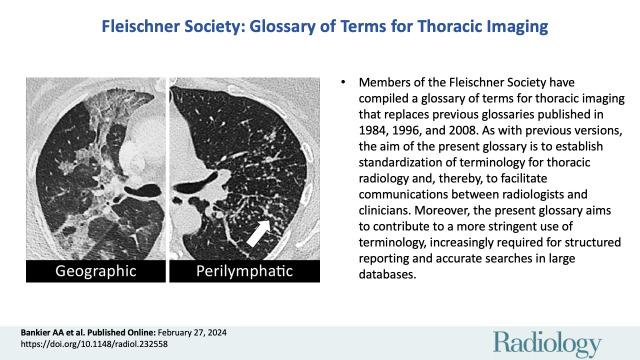
Members of the Fleischner Society have compiled a glossary of terms for thoracic imaging that replaces previous glossaries published in 1984, 1996, and 2008, respectively. The impetus to update the previous version arose from multiple considerations. These include an awareness that new terms and concepts have emerged, others have become obsolete, and the usage of some terms has either changed or become inconsistent to a degree that warranted a new definition. This latest glossary is focused on terms of clinical importance and on those whose meaning may be perceived as vague or ambiguous. As with previous versions, the aim of the present glossary is to establish standardization of terminology for thoracic radiology and, thereby, to facilitate communications between radiologists and clinicians. Moreover, the present glossary aims to contribute to a more stringent use of terminology, increasingly required for structured reporting and accurate searches in large databases. Compared with the previous version, the number of images (chest radiography and CT) in the current version has substantially increased. The authors hope that this will enhance its educational and practical value. All definitions and images are hyperlinked throughout the text. Click on each figure callout to view corresponding image. © RSNA, 2024 Supplemental material is available for this article. See also the editorials by Bhalla and Powell in this issue.


Conflict of interest statement

Disclosures of conflicts of interest: A.A.B. Consulting fees from AstraZeneca, Daiichi, Esai, and Olympus. H.M. No relevant relationships. T.C. No relevant relationships. P.A.G. No relevant relationships. J.M.G. Research grants from Coreline Soft and Taejoon Pharm. A.N.C.L. Grants to institution from National Institutes of Health; payment or honoraria for lectures from CME Science and Radiology International; Executive Committee, Fleischner Society. D.A.L. Grant support from Boehringer Ingelheim; consultant for Boehringer Ingelheim, Daiichi Sankyo, AstraZeneca, and Calyx; payment or honoraria for lectures, presentations, speakers bureaus, manuscript writing or educational events from Clinical Care Options; patents planned, issued, or pending for US Patent# 10,706,533 (July 7, 2020), 11,468,564 (Oct 11, 2022), 11,494,902 (Nov 8, 2022) “Systems and method for automatic detection and quantification of pathology using dynamic feature classification” (2879-198) (with Stephen Humphries, PhD). C.M.S.P. Royalties or licenses from Elsevier, Springer, and Thieme; consulting fees from Siemens and Philips; payment or honoraria for lectures, presentations, speakers bureaus, manuscript writing or educational events from Boehringer and Canon; support for attending meetings and/or travel from Canon. N.T. No relevant relationships. W.T.D. No relevant relationships. J.A.V. No relevant relationships. C.S.W. No relevant relationships. D.P.N. No relevant relationships.

Figures

None
Graphical abstract
Air bronchogram: (A) Coronal CT image reconstruction of the right lung and
(B) frontal chest radiograph of the left lung show air bronchograms (arrows).
Figure 1:
Air bronchogram: (A) Coronal CT image reconstruction of the right lung and (B) frontal chest radiograph of the left lung show air bronchograms (arrows).
Air crescent: Transverse CT image of the right upper lobe shows air
crescent (arrow) caused by angioinvasive aspergillosis.
Figure 2:
Air crescent: Transverse CT image of the right upper lobe shows air crescent (arrow) caused by angioinvasive aspergillosis.
 Air crescent: (A) Frontal chest radiograph and (B) transverse CT image of
the left upper lobe show rim-like air crescents (arrows) surrounding a mycetoma
(asterisks) within a preexisting cavity.
Figure 3:
Air crescent: (A) Frontal chest radiograph and (B) transverse CT image of the left upper lobe show rim-like air crescents (arrows) surrounding a mycetoma (asterisks) within a preexisting cavity.
Air trapping: Transverse CT image at the level of the carina in (A)
inspiration and (B) expiration. While the lung parenchyma in inspiration (A) is
homogeneous, expiration (B) reveals failure of lung density to increase in areas
of air trapping (arrows).
Figure 4:
Air trapping: Transverse CT image at the level of the carina in (A) inspiration and (B) expiration. While the lung parenchyma in inspiration (A) is homogeneous, expiration (B) reveals failure of lung density to increase in areas of air trapping (arrows).
Bronchocentric: Transverse CT image of the left upper lobe shows
bronchocentric opacity (arrow).
Figure 5:
Bronchocentric: Transverse CT image of the left upper lobe shows bronchocentric opacity (arrow).
Centrilobular: Transverse CT image of the lungs shows diffuse
centrilobular micronodules.
Figure 6:
Centrilobular: Transverse CT image of the lungs shows diffuse centrilobular micronodules.
Centrilobular: Transverse CT images of (A) right and (B) left lungs in two
different patients show diffuse centrilobular micronodules.
Figure 7:
Centrilobular: Transverse CT images of (A) right and (B) left lungs in two different patients show diffuse centrilobular micronodules.
Diffuse: Transverse CT image of the right lung shows diffuse increase in
lung attenuation caused by confluent ground-glass nodules.
Figure 8:
Diffuse: Transverse CT image of the right lung shows diffuse increase in lung attenuation caused by confluent ground-glass nodules.
Endobronchial: Transverse CT images in (A) lung and (B) mediastinal window
through the right lung show partially obstructing endobronchial lesion in the
bronchus intermedius (arrow).
Figure 9:
Endobronchial: Transverse CT images in (A) lung and (B) mediastinal window through the right lung show partially obstructing endobronchial lesion in the bronchus intermedius (arrow).
Endobronchial: (A) Transverse and (B) coronal contrast-enhanced CT images
through left lung of the same patient show endobronchial lesion in left upper
lobe bronchus (arrow).
Figure 10:
Endobronchial: (A) Transverse and (B) coronal contrast-enhanced CT images through left lung of the same patient show endobronchial lesion in left upper lobe bronchus (arrow).
Extrapleural: Transverse CT image of the left lower lobe shows
extrapleural fat (arrows).
Figure 11:
Extrapleural: Transverse CT image of the left lower lobe shows extrapleural fat (arrows).
Fissural: Transverse CT images of the right lung in two different patients
show (A) solitary and (B) multiple perifissural micronodules (arrows).
Figure 12:
Fissural: Transverse CT images of the right lung in two different patients show (A) solitary and (B) multiple perifissural micronodules (arrows).
Focal ground-glass opacities: Transverse CT image of the upper lobes shows
subtle, focal ground-glass opacities in the right and left lungs (arrows).
Figure 13:
Focal ground-glass opacities: Transverse CT image of the upper lobes shows subtle, focal ground-glass opacities in the right and left lungs (arrows).
Geographic: (A, B) Transverse contrast-enhanced CT images of the right
lung in two different patients show ground-glass opacities with geographic
distribution.
Figure 14:
Geographic: (A, B) Transverse contrast-enhanced CT images of the right lung in two different patients show ground-glass opacities with geographic distribution.
Multifocal: Transverse CT image shows multifocal opacities (arrows).
Figure 15:
Multifocal: Transverse CT image shows multifocal opacities (arrows).
Figure 16:
Multifocal: Transverse CT image shows multifocal opacities (arrows).
Peribronchovascular: Transverse contrast-enhanced CT image of the right
lung shows radiation reaction with peribronchovascular thickening (arrow).
Figure 17:
Peribronchovascular: Transverse contrast-enhanced CT image of the right lung shows radiation reaction with peribronchovascular thickening (arrow).
Peribronchovascular: Transverse CT image of the right lung shows nodules
with peribronchovascular distribution (arrow).
Figure 18:
Peribronchovascular: Transverse CT image of the right lung shows nodules with peribronchovascular distribution (arrow).
Perilobular: Transverse CT images of the (A) right and (B) left lung in
two different patients show opacities with perilobular distribution (arrows).
Figure 19:
Perilobular: Transverse CT images of the (A) right and (B) left lung in two different patients show opacities with perilobular distribution (arrows).
Perilobular: Transverse CT image of the left lower lobe shows opacities
with perilobular distribution.
Figure 20:
Perilobular: Transverse CT image of the left lower lobe shows opacities with perilobular distribution.
Perilymphatic micronodules: (A, B) Transverse CT images of the left lung
in the same patient at different levels show micronodules with perilymphatic
distribution (arrows).
Figure 21:
Perilymphatic micronodules: (A, B) Transverse CT images of the left lung in the same patient at different levels show micronodules with perilymphatic distribution (arrows).
Perilymphatic micronodules: Transverse CT image of the left lung shows
micronodules with perilymphatic distribution along the fissure (open arrow) and
the bronchus (solid arrow).
Figure 22:
Perilymphatic micronodules: Transverse CT image of the left lung shows micronodules with perilymphatic distribution along the fissure (open arrow) and the bronchus (solid arrow).
Pleural: Transverse CT images of the left lung in (A) lung and (B) soft
tissue window show diffuse nodular pleural thickening (arrows).
Figure 23:
Pleural: Transverse CT images of the left lung in (A) lung and (B) soft tissue window show diffuse nodular pleural thickening (arrows).
Pleural: Transverse CT images of the right lower lobe in (A) lung and (B)
soft tissue window show focal pleural lesion (arrow).
Figure 24:
Pleural: Transverse CT images of the right lower lobe in (A) lung and (B) soft tissue window show focal pleural lesion (arrow).
Pleural: (A, B) Transverse CT images of the lung bases show focal pleural
nodules (solid arrow), some of which are partially calcified (open arrow).
Figure 25:
Pleural: (A, B) Transverse CT images of the lung bases show focal pleural nodules (solid arrow), some of which are partially calcified (open arrow).
Aortopulmonary window: (A) Frontal chest radiograph and (B) coronal CT
image reconstruction in the same patient show aortopulmonary window (arrow).
Figure 26:
Aortopulmonary window: (A) Frontal chest radiograph and (B) coronal CT image reconstruction in the same patient show aortopulmonary window (arrow).
Apical cap: (A) Frontal chest radiograph and (B) coronal CT image
reconstruction in the same patient show bilateral apical caps (arrows).
Figure 27:
Apical cap: (A) Frontal chest radiograph and (B) coronal CT image reconstruction in the same patient show bilateral apical caps (arrows).
Architectural distortion: Transverse CT images of the (A, B) right and (C)
left lung of three different patients show traction bronchiectasis (solid
arrows). Note the presence of coexisting fibrosis and architectural distortion
(open arrow in B and C).
Figure 28:
Architectural distortion: Transverse CT images of the (A, B) right and (C) left lung of three different patients show traction bronchiectasis (solid arrows). Note the presence of coexisting fibrosis and architectural distortion (open arrow in B and C).
Asbestosis: Transverse CT images of the lower lobes show fibrosis
following asbestos exposure. Note that the presence of pleural plaques is not
required for the diagnosis.
Figure 29:
Asbestosis: Transverse CT images of the lower lobes show fibrosis following asbestos exposure. Note that the presence of pleural plaques is not required for the diagnosis.
Atelectasis: Frontal chest radiographs of two different patients show (A)
partial and (B) complete right upper lobe atelectasis (arrows).
Figure 30:
Atelectasis: Frontal chest radiographs of two different patients show (A) partial and (B) complete right upper lobe atelectasis (arrows).
Atelectasis: Frontal chest radiographs of the right lung in the same
patient show (A) complete and (B) partial atelectasis (arrow) of the right upper
lobe.
Figure 31:
Atelectasis: Frontal chest radiographs of the right lung in the same patient show (A) complete and (B) partial atelectasis (arrow) of the right upper lobe.
Atelectasis: (A) Frontal chest radiograph and (B) coronal CT image
reconstruction show right upper lobe atelectasis (solid arrow). Note presence of
juxtaphrenic peak in B (open arrow).
Figure 32:
Atelectasis: (A) Frontal chest radiograph and (B) coronal CT image reconstruction show right upper lobe atelectasis (solid arrow). Note presence of juxtaphrenic peak in B (open arrow).
Atelectasis: (A) Frontal chest radiograph and (B, C) coronal CT image
reconstructions in mediastinal and lung windows show right upper lobe
atelectasis (solid arrow) caused by central tumor (open arrow). Note presence of
juxtaphrenic peak in A (open arrow).
Figure 33:
Atelectasis: (A) Frontal chest radiograph and (B, C) coronal CT image reconstructions in mediastinal and lung windows show right upper lobe atelectasis (solid arrow) caused by central tumor (open arrow). Note presence of juxtaphrenic peak in A (open arrow).
Atelectasis: (A) Frontal and (B) lateral chest radiograph of the same
patient show middle lobe atelectasis (arrow).
Figure 34:
Atelectasis: (A) Frontal and (B) lateral chest radiograph of the same patient show middle lobe atelectasis (arrow).
Atelectasis: Frontal chest radiograph shows right lower lobe atelectasis
(arrows).
Figure 35:
Atelectasis: Frontal chest radiograph shows right lower lobe atelectasis (arrows).
Atelectasis: (A) Frontal and (B) lateral radiograph shows complete left
upper lobe and lingula atelectasis (solid arrows). Note presence of juxtaphrenic
peak (open arrow).
Figure 36:
Atelectasis: (A) Frontal and (B) lateral radiograph shows complete left upper lobe and lingula atelectasis (solid arrows). Note presence of juxtaphrenic peak (open arrow).
Atelectasis: Frontal chest radiographs of two different patients with
complete left lower lobe atelectasis (arrow) show that the size of the
atelectatic lobe can vary from (A) large to (B) small.
Figure 37:
Atelectasis: Frontal chest radiographs of two different patients with complete left lower lobe atelectasis (arrow) show that the size of the atelectatic lobe can vary from (A) large to (B) small.
Atelectasis: (A, B) Frontal chest radiographs of two different patients
show bilateral linear atelectasis (arrows).
Figure 38:
Atelectasis: (A, B) Frontal chest radiographs of two different patients show bilateral linear atelectasis (arrows).
Atelectasis: Transverse image of the left upper lobe shows linear
atelectasis along the major fissure (arrow).
Figure 39:
Atelectasis: Transverse image of the left upper lobe shows linear atelectasis along the major fissure (arrow).
Atelectasis: Transverse CT image of the right lower lobe shows rounded
atelectasis (solid arrow) adjacent to thickened pleura and a small pleural
effusion, and “comet tail” (open arrow).
Figure 40:
Atelectasis: Transverse CT image of the right lower lobe shows rounded atelectasis (solid arrow) adjacent to thickened pleura and a small pleural effusion, and “comet tail” (open arrow).
Atoll sign: Transverse CT images of the (A) right and (B) left lower lobes
in two different patients show focal ground-glass opacities surrounded by a thin
ring of consolidation (arrows).
Figure 41:
Atoll sign: Transverse CT images of the (A) right and (B) left lower lobes in two different patients show focal ground-glass opacities surrounded by a thin ring of consolidation (arrows).
Atoll sign: Transverse CT image of the left lower lobe shows focal
ground-glass opacities surrounded by a thin ring of consolidation (arrows).
Figure 42:
Atoll sign: Transverse CT image of the left lower lobe shows focal ground-glass opacities surrounded by a thin ring of consolidation (arrows).
Azygo-esophageal recess: Frontal chest radiograph of the mediastinum shows
the azygo-esophageal recess (arrows).
Figure 43:
Azygo-esophageal recess: Frontal chest radiograph of the mediastinum shows the azygo-esophageal recess (arrows).
Azygo-esophageal recess: Transverse CT image of the right lung shows the
azygo-esophageal recess (arrow), bordered by the azygos vein and the neighboring
esophagus.
Figure 44:
Azygo-esophageal recess: Transverse CT image of the right lung shows the azygo-esophageal recess (arrow), bordered by the azygos vein and the neighboring esophagus.
Bronchiectasis: Transverse CT images of the lungs in two different
patients show severe bronchiectasis (solid arrow) in (A) right upper lobe and
milder bronchiectasis (solid arrow) in (B) left lower lobe. Note the smaller
diameter of the accompanying pulmonary artery (signet ring sign) (open arrow).
Figure 45:
Bronchiectasis: Transverse CT images of the lungs in two different patients show severe bronchiectasis (solid arrow) in (A) right upper lobe and milder bronchiectasis (solid arrow) in (B) left lower lobe. Note the smaller diameter of the accompanying pulmonary artery (signet ring sign) (open arrow).
Bronchocele: Transverse CT images of the right lung in two different
patients show localized bronchial dilatation (A) with and (B) without mucoid
impaction within a hyperlucent lobe, due to congenital bronchial atresia
(arrow).
Figure 46:
Bronchocele: Transverse CT images of the right lung in two different patients show localized bronchial dilatation (A) with and (B) without mucoid impaction within a hyperlucent lobe, due to congenital bronchial atresia (arrow).
Broncholith: Transverse CT image through the right lung (A, lung window;
B, bone window) show broncholith (arrow).
Figure 47:
Broncholith: Transverse CT image through the right lung (A, lung window; B, bone window) show broncholith (arrow).
Bronchomalacia: Transverse CT image at the level of the main bronchi in
(A) inspiration and (B) expiration. Expiration causes substantial collapse of
the main bronchi (arrows).
Figure 48:
Bronchomalacia: Transverse CT image at the level of the main bronchi in (A) inspiration and (B) expiration. Expiration causes substantial collapse of the main bronchi (arrows).
Bulla: (A) Frontal chest radiograph and (B) transverse CT image of the
right upper lobe show an air-containing cystic structure lined by a thin layer
of collapsed lung parenchyma (arrow).
Figure 49:
Bulla: (A) Frontal chest radiograph and (B) transverse CT image of the right upper lobe show an air-containing cystic structure lined by a thin layer of collapsed lung parenchyma (arrow).
Bulla: Transverse CT image of the right upper lobe shows an air-containing
cystic structure lined by a thin layer of collapsed lung parenchyma (arrow).
Figure 50:
Bulla: Transverse CT image of the right upper lobe shows an air-containing cystic structure lined by a thin layer of collapsed lung parenchyma (arrow).
Cavity: Transverse CT image of the (A) right and (B) left upper lobe in
two different patients show gas-filled structures with thick and partially
irregular walls (arrow).
Figure 51:
Cavity: Transverse CT image of the (A) right and (B) left upper lobe in two different patients show gas-filled structures with thick and partially irregular walls (arrow).
Cavity: Transverse CT image of the left lower lobe shows two round
gas-filled structures (arrows).
Figure 52:
Cavity: Transverse CT image of the left lower lobe shows two round gas-filled structures (arrows).
Cavity: Transverse contrast-enhanced CT image of the left lower lobe shows
(A) soft tissue and (B) lung window of gas-filled structure with thickened and
irregular walls (arrow).
Figure 53:
Cavity: Transverse contrast-enhanced CT image of the left lower lobe shows (A) soft tissue and (B) lung window of gas-filled structure with thickened and irregular walls (arrow).
Consolidation with peripheral ground-glass: Transverse CT image of the
left lower lobe shows consolidation (solid arrow) and ground-glass opacities
(open arrow).
Figure 54:
Consolidation with peripheral ground-glass: Transverse CT image of the left lower lobe shows consolidation (solid arrow) and ground-glass opacities (open arrow).
Cyst: Transverse CT images of the (A) right and (B) left lung of two
different patients. Cysts are solitary (arrow) in A and diffuse in B.
Figure 55:
Cyst: Transverse CT images of the (A) right and (B) left lung of two different patients. Cysts are solitary (arrow) in A and diffuse in B.
Embolism with infarction: Transverse contrast-enhanced CT images in (A)
soft tissue and (B) lung window show emboli (solid arrows) and corresponding
infarction (open arrows). (C) Coronal CT image reconstruction and (D) frontal
chest radiograph in the same patient show central embolus (solid arrow) and
peripheral infarction (open arrow). Emphysema.
Figure 56:
Embolism with infarction: Transverse contrast-enhanced CT images in (A) soft tissue and (B) lung window show emboli (solid arrows) and corresponding infarction (open arrows). (C) Coronal CT image reconstruction and (D) frontal chest radiograph in the same patient show central embolus (solid arrow) and peripheral infarction (open arrow). Emphysema.
Centrilobular: (A, B) Transverse CT images of the right upper lobes of two
different patients show centrilobular emphysema.
Figure 57:
Centrilobular: (A, B) Transverse CT images of the right upper lobes of two different patients show centrilobular emphysema.
Centrilobular: (A, B) Transverse CT images of the right upper lobes of two
different patients show centrilobular emphysema.
Figure 58:
Centrilobular: (A, B) Transverse CT images of the right upper lobes of two different patients show centrilobular emphysema.
Centrilobular: (A, B) Transverse CT images of the right upper lobes of two
different patients show centrilobular emphysema.
Figure 59:
Centrilobular: (A, B) Transverse CT images of the right upper lobes of two different patients show centrilobular emphysema.
Panlobular: Transverse CT image shows panlobular emphysema.
Figure 60:
Panlobular: Transverse CT image shows panlobular emphysema.
Panlobular: (A, B) Transverse CT images of the right upper lobes of two
different patients show panlobular emphysema (arrow).
Figure 61:
Panlobular: (A, B) Transverse CT images of the right upper lobes of two different patients show panlobular emphysema (arrow).
Paraseptal: Transverse CT image of the left upper lobe shows paraseptal
emphysema (arrows). Mild centrilobular emphysema is also present.
Figure 62:
Paraseptal: Transverse CT image of the left upper lobe shows paraseptal emphysema (arrows). Mild centrilobular emphysema is also present.
Paraseptal: Transverse CT image of the upper lobes shows paraseptal
emphysema (arrows).
Figure 63:
Paraseptal: Transverse CT image of the upper lobes shows paraseptal emphysema (arrows).
Visual subtypes of centrilobular emphysema: Transverse CT images of the
right lung in different patients show visual subtypes of centrilobular emphysema
according to reference 63: (A) trace emphysema, (B) mild emphysema, (C) moderate
emphysema, (D) confluent emphysema, and (E) advanced destructive emphysema.
Figure 64:
Visual subtypes of centrilobular emphysema: Transverse CT images of the right lung in different patients show visual subtypes of centrilobular emphysema according to reference : (A) trace emphysema, (B) mild emphysema, (C) moderate emphysema, (D) confluent emphysema, and (E) advanced destructive emphysema.
Empyema: Transverse contrast-enhanced CT image of the right lower lobe
shows empyema (asterisk) surrounded by thickened and enhancing pleura (solid
arrows), with adjacent atelectasis (open arrow).
Figure 65:
Empyema: Transverse contrast-enhanced CT image of the right lower lobe shows empyema (asterisk) surrounded by thickened and enhancing pleura (solid arrows), with adjacent atelectasis (open arrow).
Empyema: Transverse contrast-enhanced CT image of the left lower lobe
shows empyema (asterisk) with air-fluid level, surrounded by thickened and
enhancing pleura (solid arrow), with adjacent atelectasis (open arrow).
Figure 66:
Empyema: Transverse contrast-enhanced CT image of the left lower lobe shows empyema (asterisk) with air-fluid level, surrounded by thickened and enhancing pleura (solid arrow), with adjacent atelectasis (open arrow).
Fibrosis: Transverse CT image of the right lower lobe shows extensive
fibrosis with honeycombing and reticular opacities.
Figure 67:
Fibrosis: Transverse CT image of the right lower lobe shows extensive fibrosis with honeycombing and reticular opacities.
Fissure: Transverse CT image of the right lung shows major fissure
(arrows).
Figure 68:
Fissure: Transverse CT image of the right lung shows major fissure (arrows).
Accessory: Transverse CT image of the right lung shows two accessory
fissures in the right lower lobe (arrows).
Figure 69:
Accessory: Transverse CT image of the right lung shows two accessory fissures in the right lower lobe (arrows).
Accessory: (A) Transverse and (B) sagittal CT images of the left lung of
the same patient show accessory fissure in the left lower lobe (arrow).
Figure 70:
Accessory: (A) Transverse and (B) sagittal CT images of the left lung of the same patient show accessory fissure in the left lower lobe (arrow).
Azygos: Transverse CT image of the right upper lobe shows azygos fissure
(arrows). This structure is in fact a pseudofissure, as it consists of four
rather than the normal two pleural layers.
Figure 71:
Azygos: Transverse CT image of the right upper lobe shows azygos fissure (arrows). This structure is in fact a pseudofissure, as it consists of four rather than the normal two pleural layers.
Incomplete: Transverse CT image of the left lung shows absence of the
medial portion (solid arrow) of the left major fissure (open arrow).
Figure 72:
Incomplete: Transverse CT image of the left lung shows absence of the medial portion (solid arrow) of the left major fissure (open arrow).
Ground-glass opacity: (A–C) Transverse CT images of the left lung
of three different patients show ground-glass opacities. Opacity is subtle and
focal in A (arrow), subtle and diffuse with centrilobular nodules in B, and
severe and diffuse with mild reactive airway dilatation in C.
Figure 73:
Ground-glass opacity: (A–C) Transverse CT images of the left lung of three different patients show ground-glass opacities. Opacity is subtle and focal in A (arrow), subtle and diffuse with centrilobular nodules in B, and severe and diffuse with mild reactive airway dilatation in C.
Ground-glass opacities and consolidation: Transverse CT image of the right
lung shows ground-glass opacities and focal consolidation (arrow).
Figure 74:
Ground-glass opacities and consolidation: Transverse CT image of the right lung shows ground-glass opacities and focal consolidation (arrow).
Halo: Transverse CT image of the right lung shows a ground-glass halo
(arrow) surrounding central nodular consolidation.
Figure 75:
Halo: Transverse CT image of the right lung shows a ground-glass halo (arrow) surrounding central nodular consolidation.
Honeycombing: Transverse CT image of the left lung shows honeycombing
(arrow).
Figure 76:
Honeycombing: Transverse CT image of the left lung shows honeycombing (arrow).
Honeycombing: Transverse CT image of the right lung shows mild
honeycombing (arrow).
Figure 77:
Honeycombing: Transverse CT image of the right lung shows mild honeycombing (arrow).
Honeycombing: (A, B) Transverse CT image of the right lung in two
different patients shows honeycombing (arrow).
Figure 78:
Honeycombing: (A, B) Transverse CT image of the right lung in two different patients shows honeycombing (arrow).
Irregular margination of pulmonary nodule: Transverse CT image of the
right lower lobe shows an irregular nodule with spiculations and pleural tags
(arrow).
Figure 79:
Irregular margination of pulmonary nodule: Transverse CT image of the right lower lobe shows an irregular nodule with spiculations and pleural tags (arrow).
Juxtaphrenic peak: Frontal chest radiograph of the left lung shows
juxtaphrenic peak (arrow).
Figure 80:
Juxtaphrenic peak: Frontal chest radiograph of the left lung shows juxtaphrenic peak (arrow).
Lobulation: Transverse CT images of the left (A) upper and (B) lower lobes
show lobulated nodules (arrow).
Figure 81:
Lobulation: Transverse CT images of the left (A) upper and (B) lower lobes show lobulated nodules (arrow).
Lymph node: Transverse CT image of the mediastinum shows mediastinal lymph
node (arrow) with fatty hilum.
Figure 82:
Lymph node: Transverse CT image of the mediastinum shows mediastinal lymph node (arrow) with fatty hilum.
Lymph node: Transverse CT image of the mediastinum shows mediastinal lymph
node (arrow) with fatty hilum.
Figure 83:
Lymph node: Transverse CT image of the mediastinum shows mediastinal lymph node (arrow) with fatty hilum.
Lymph node: Transverse CT images in (A) soft tissue and (B) lung window
show calcified mediastinal lymph node (arrow).
Figure 84:
Lymph node: Transverse CT images in (A) soft tissue and (B) lung window show calcified mediastinal lymph node (arrow).
Lymphadenopathy: (A–C) Transverse CT images of the mediastinum show
mediastinal lymph node enlargement (arrows).
Figure 85:
Lymphadenopathy: (A–C) Transverse CT images of the mediastinum show mediastinal lymph node enlargement (arrows).
Mass: Transverse CT image of the right upper lobe shows mass with
spiculations (open arrow) and pleural tags (solid arrow).
Figure 86:
Mass: Transverse CT image of the right upper lobe shows mass with spiculations (open arrow) and pleural tags (solid arrow).
Micronodule: Transverse CT image of the right upper lobe shows multiple
micronodules (arrows).
Figure 87:
Micronodule: Transverse CT image of the right upper lobe shows multiple micronodules (arrows).
Mosaic attenuation: Transverse CT image of the left lung shows geographic
regions of normal and abnormally increased attenuation.
Figure 88:
Mosaic attenuation: Transverse CT image of the left lung shows geographic regions of normal and abnormally increased attenuation.
Mucoid impaction: Transverse CT image of the left upper lobe shows
bronchus impacted by mucus (arrow).
Figure 89:
Mucoid impaction: Transverse CT image of the left upper lobe shows bronchus impacted by mucus (arrow).
Mycetoma: Transverse CT images of the left upper lobe in two different
patients show mycetomas (arrow) in preexisting cavities with air crescent
surrounded by (A) abnormal and (B) normal lung parenchyma. The mycetoma in B
shows sponge-like appearance.
Figure 90:
Mycetoma: Transverse CT images of the left upper lobe in two different patients show mycetomas (arrow) in preexisting cavities with air crescent surrounded by (A) abnormal and (B) normal lung parenchyma. The mycetoma in B shows sponge-like appearance.
Mycetoma: Transverse CT images of the right upper lobe in (A) supine and
(B) prone position show mycetoma (arrow) within a preexisting cavity surrounded
by abnormal lung parenchyma, changing position with gravity.
Figure 91:
Mycetoma: Transverse CT images of the right upper lobe in (A) supine and (B) prone position show mycetoma (arrow) within a preexisting cavity surrounded by abnormal lung parenchyma, changing position with gravity.
Nodule: Transverse CT image of the right upper lobe shows a round,
well-defined, solid soft tissue nodule.
Figure 92:
Nodule: Transverse CT image of the right upper lobe shows a round, well-defined, solid soft tissue nodule.
Nodule: Transverse CT images in (A) lung and (B) soft tissue windows of
the right lung show an ovoid soft tissue nodule (arrow).
Figure 93:
Nodule: Transverse CT images in (A) lung and (B) soft tissue windows of the right lung show an ovoid soft tissue nodule (arrow).
Nodule: Transverse CT images in (A) soft issue and (B) lung windows of the
right lung show a well-defined, solid soft tissue nodule (arrow). Note the small
pleural effusion.
Figure 94:
Nodule: Transverse CT images in (A) soft issue and (B) lung windows of the right lung show a well-defined, solid soft tissue nodule (arrow). Note the small pleural effusion.
Nodule: Transverse CT image of the (A) left upper and (B) left lower lobes
of two different patients show ground-glass nodules with irregular margins.
Figure 95:
Nodule: Transverse CT image of the (A) left upper and (B) left lower lobes of two different patients show ground-glass nodules with irregular margins.
Nodule: Transverse CT image of the right lung shows a mildly spiculated
nodule (arrow).
Figure 96:
Nodule: Transverse CT image of the right lung shows a mildly spiculated nodule (arrow).
Nodule: Transverse CT image of the right upper lobe shows an irregular
nodule with mild spiculation.
Figure 97:
Nodule: Transverse CT image of the right upper lobe shows an irregular nodule with mild spiculation.
Nodule: Transverse CT image shows a markedly spiculated nodule in the
right lower lobe.
Figure 98:
Nodule: Transverse CT image shows a markedly spiculated nodule in the right lower lobe.
Nodule, pleural tag: Transverse CT images of the left lung show complex
nodule with single pleural tag (arrow), (A) thin at first appearance, and (B)
thickening over time.
Figure 99:
Nodule, pleural tag: Transverse CT images of the left lung show complex nodule with single pleural tag (arrow), (A) thin at first appearance, and (B) thickening over time.
Nodule: Transverse CT images of the (A) left upper and (B) right lower
lobes show spiculated nodules with pleural tags (solid arrow) and fissural
involvement (open arrow).
Figure 100:
Nodule: Transverse CT images of the (A) left upper and (B) right lower lobes show spiculated nodules with pleural tags (solid arrow) and fissural involvement (open arrow).
Nodule, spiculation, pleural tag: Transverse CT image of the left upper
lobe shows a spiculated nodule with pleural tags (arrows).
Figure 101:
Nodule, spiculation, pleural tag: Transverse CT image of the left upper lobe shows a spiculated nodule with pleural tags (arrows).
Nodule: Transverse CT images in (A) lung and (B) soft tissue window of the
left upper lobe show calcified nodule (arrow).
Figure 102:
Nodule: Transverse CT images in (A) lung and (B) soft tissue window of the left upper lobe show calcified nodule (arrow).
Nodule, complex morphology: Transverse CT image of the left lower lobe
shows a complex nodule with cystic (open arrow) and ground-glass (solid arrow)
components.
Figure 103:
Nodule, complex morphology: Transverse CT image of the left lower lobe shows a complex nodule with cystic (open arrow) and ground-glass (solid arrow) components.
Nodule, complex morphology: Transverse CT image of the right lower lobe
shows a ground-glass nodule with a cystic component (arrow).
Figure 104:
Nodule, complex morphology: Transverse CT image of the right lower lobe shows a ground-glass nodule with a cystic component (arrow).
Nodule: Transverse CT image of the left lower lobe shows a complex nodule
with fat (open arrow) and soft tissue (solid arrow) components.
Figure 105:
Nodule: Transverse CT image of the left lower lobe shows a complex nodule with fat (open arrow) and soft tissue (solid arrow) components.
Nodule: Transverse CT images in (A) soft tissue and (B) lung windows of
the right lower lobe show a complex nodule with a calcified (solid arrow) and
soft tissue (open arrow) component.
Figure 106:
Nodule: Transverse CT images in (A) soft tissue and (B) lung windows of the right lower lobe show a complex nodule with a calcified (solid arrow) and soft tissue (open arrow) component.
Nodule: (A–C) Transverse CT images of the right lung of three
different patients show a complex nodule with solid and ground-glass components
(part-solid nodules). While the ground-glass component is predominantly present
in A, the solid component is larger in B and becomes the dominant component in
C.
Figure 107:
Nodule: (A–C) Transverse CT images of the right lung of three different patients show a complex nodule with solid and ground-glass components (part-solid nodules). While the ground-glass component is predominantly present in A, the solid component is larger in B and becomes the dominant component in C.
Nodule: Transverse CT image of the right upper lobe shows a complex nodule
with fat (solid arrow), calcium (open arrow) and soft tissue (dashed arrow)
components.
Figure 108:
Nodule: Transverse CT image of the right upper lobe shows a complex nodule with fat (solid arrow), calcium (open arrow) and soft tissue (dashed arrow) components.
Nodule: Transverse CT image of the left lower lobe shows a complex nodule
with fat (solid arrow), calcium (open arrow) and soft tissue (dashed arrow)
components.
Figure 109:
Nodule: Transverse CT image of the left lower lobe shows a complex nodule with fat (solid arrow), calcium (open arrow) and soft tissue (dashed arrow) components.
Nodule: Transverse CT image of the left upper lobe shows a complex nodule
with cystic (open arrow), ground-glass (dashed arrow) and soft tissue (solid
arrow) components.
Figure 110:
Nodule: Transverse CT image of the left upper lobe shows a complex nodule with cystic (open arrow), ground-glass (dashed arrow) and soft tissue (solid arrow) components.
Nodule: Transverse CT images of the right upper lobe show the evolution of
a nodule from (A) soft tissue (arrow) to (B) a nodule with cystic (open arrow)
and soft tissue (solid arrow) components.
Figure 111:
Nodule: Transverse CT images of the right upper lobe show the evolution of a nodule from (A) soft tissue (arrow) to (B) a nodule with cystic (open arrow) and soft tissue (solid arrow) components.
Nodule: Transverse CT images of the right lung show the evolution of a
nodule from (A) a ground-glass nodule (arrow) to (B) a nodule with ground-glass
(solid arrow) and soft tissue and cystic (open arrow) components.
Figure 112:
Nodule: Transverse CT images of the right lung show the evolution of a nodule from (A) a ground-glass nodule (arrow) to (B) a nodule with ground-glass (solid arrow) and soft tissue and cystic (open arrow) components.
Nodule: Transverse CT images of the right upper lobe show the evolution of
a nodule with (A) cystic (open arrow) and ground-glass (dashed arrow) components
to (B) a nodule with cystic (open arrow) and soft tissue (solid arrow)
components.
Figure 113:
Nodule: Transverse CT images of the right upper lobe show the evolution of a nodule with (A) cystic (open arrow) and ground-glass (dashed arrow) components to (B) a nodule with cystic (open arrow) and soft tissue (solid arrow) components.
Nodule: Transverse CT images of the left lung show pulmonary nodule that
evolves from (A) a complex to (B) a simple morphology. The complex morphology in
A consists of a ground-glass (open arrow) and a solid (solid arrow) component.
Figure 114:
Nodule: Transverse CT images of the left lung show pulmonary nodule that evolves from (A) a complex to (B) a simple morphology. The complex morphology in A consists of a ground-glass (open arrow) and a solid (solid arrow) component.
Oligemia: Transverse CT image shows areas of oligemia caused by small
airways disease. Note the reduced number of vessels and thickened bronchial
walls.
Figure 115:
Oligemia: Transverse CT image shows areas of oligemia caused by small airways disease. Note the reduced number of vessels and thickened bronchial walls.
Oligemia: Transverse contrast-enhanced CT image shows oligemia caused by
vascular arterial disease. Note the substantially dilated central pulmonary
arteries (asterisk).
Figure 116:
Oligemia: Transverse contrast-enhanced CT image shows oligemia caused by vascular arterial disease. Note the substantially dilated central pulmonary arteries (asterisk).
Organizing pneumonia: Transverse CT image of the left lower lobe shows
consolidation with perilobular and peribronchovascular distribution.
Figure 117:
Organizing pneumonia: Transverse CT image of the left lower lobe shows consolidation with perilobular and peribronchovascular distribution.
Organizing pneumonia: Transverse CT image of the lower lobes shows
groundglass opacities and peribronchial consolidation.
Figure 118:
Organizing pneumonia: Transverse CT image of the lower lobes shows groundglass opacities and peribronchial consolidation.
Paratracheal stripe: Frontal chest radiograph shows right paratracheal
stripe (arrows).
Figure 119:
Paratracheal stripe: Frontal chest radiograph shows right paratracheal stripe (arrows).
Parenchymal band: Transverse CT images of the (A) left and (B) right lung
of two different patients show linear parenchymal bands paralleling the pleura
(arrows). Pattern.
Figure 120:
Parenchymal band: Transverse CT images of the (A) left and (B) right lung of two different patients show linear parenchymal bands paralleling the pleura (arrows). Pattern.
Crazy paving: (A, B) Transverse CT images of the left lung of two
different patients show crazy-paving pattern.
Figure 121:
Crazy paving: (A, B) Transverse CT images of the left lung of two different patients show crazy-paving pattern.
Crazy paving: Transverse CT image of the right lung shows areas of crazy
paving with reticular lines.
Figure 122:
Crazy paving: Transverse CT image of the right lung shows areas of crazy paving with reticular lines.
Interstitial: Transverse CT image of the right upper lobe shows
interstitial pattern caused by thickened interlobular septa.
Figure 123:
Interstitial: Transverse CT image of the right upper lobe shows interstitial pattern caused by thickened interlobular septa.
Miliary: Transverse CT image of the right lung shows miliary micronodules.
Figure 124:
Miliary: Transverse CT image of the right lung shows miliary micronodules.
Miliary: Transverse CT image of the lungs show diffuse distribution of
micronodules.
Figure 125:
Miliary: Transverse CT image of the lungs show diffuse distribution of micronodules.
Mosaic: Transverse CT image of the right lung shows mosaic pattern.
Figure 126:
Mosaic: Transverse CT image of the right lung shows mosaic pattern.
Nodular: Transverse CT images of the right lung of two different patients
show (A) moderate and (B) extensive nodular pattern.
Figure 127:
Nodular: Transverse CT images of the right lung of two different patients show (A) moderate and (B) extensive nodular pattern.
Nodular: Transverse contrast-enhanced CT image of the lungs shows diffuse
nodular pattern.
Figure 128:
Nodular: Transverse contrast-enhanced CT image of the lungs shows diffuse nodular pattern.
Reticular: Transverse CT images in three different patients show (A)
subtle, (B) moderate, and (C) severe reticular opacities, with ground-glass
opacities.
Figure 129:
Reticular: Transverse CT images in three different patients show (A) subtle, (B) moderate, and (C) severe reticular opacities, with ground-glass opacities.
Three Attenuation: Transverse CT images in two different patients through
the (A) right and (B) left lung show lobules with normal, increased, and
decreased attenuation.
Figure 130:
Three Attenuation: Transverse CT images in two different patients through the (A) right and (B) left lung show lobules with normal, increased, and decreased attenuation.
Tree-in-bud: Transverse CT images of the middle lobe. (A) While the
standard reconstruction shows several micronodules only, (B) the maximum
intensity projection reveals the tree-in-bud appearance of these micronodules
(arrow).
Figure 131:
Tree-in-bud: Transverse CT images of the middle lobe. (A) While the standard reconstruction shows several micronodules only, (B) the maximum intensity projection reveals the tree-in-bud appearance of these micronodules (arrow).
Tree-in-bud: Sagittal CT image reconstruction of the left lower lobes
shows focal tree-in-bud opacities (arrows).
Figure 132:
Tree-in-bud: Sagittal CT image reconstruction of the left lower lobes shows focal tree-in-bud opacities (arrows).
Tree-in-bud: Transverse CT image of the right lower lobe shows multifocal
tree-in-bud with branching opacities.
Figure 133:
Tree-in-bud: Transverse CT image of the right lower lobe shows multifocal tree-in-bud with branching opacities.
Tree-in-bud: Transverse CT image of the right lung in (A) thin-section and
(B) maximum intensity projection reconstructions show focal tree-in-bud
opacities (arrow).
Figure 134:
Tree-in-bud: Transverse CT image of the right lung in (A) thin-section and (B) maximum intensity projection reconstructions show focal tree-in-bud opacities (arrow).
Tree-in-bud: (A, B) Transverse CT images of the right lung in two
different patients show focal tree-in-bud opacities.
Figure 135:
Tree-in-bud: (A, B) Transverse CT images of the right lung in two different patients show focal tree-in-bud opacities.
Tree-in-bud: Transverse CT image of right lung shows focal tree-in-bud
opacities (arrows).
Figure 136:
Tree-in-bud: Transverse CT image of right lung shows focal tree-in-bud opacities (arrows).
Effusion: Frontal chest radiograph shows left pleural effusion (arrow).
Figure 137:
Effusion: Frontal chest radiograph shows left pleural effusion (arrow).
Plaque: Transverse CT image of the left upper lobe shows calcified pleural
plaque (arrow).
Figure 138:
Plaque: Transverse CT image of the left upper lobe shows calcified pleural plaque (arrow).
Plaque: (A, B) Transverse CT images of the lower thorax show partially
calcified pleural plaques (arrows).
Figure 139:
Plaque: (A, B) Transverse CT images of the lower thorax show partially calcified pleural plaques (arrows).
Pneumatocele: Transverse CT image through the left lung shows well-defined
pneumatocele (arrow).
Figure 140:
Pneumatocele: Transverse CT image through the left lung shows well-defined pneumatocele (arrow).
Pneumomediastinum: (A) Frontal and (B) lateral chest radiographs show
mediastinal air collection (arrows).
Figure 141:
Pneumomediastinum: (A) Frontal and (B) lateral chest radiographs show mediastinal air collection (arrows).
Pneumomediastinum: (A, B) Transverse CT images in two patients show
mediastinal (solid arrow) and extrapleural (open arrow) air collections.
Figure 142:
Pneumomediastinum: (A, B) Transverse CT images in two patients show mediastinal (solid arrow) and extrapleural (open arrow) air collections.
Pneumopericardium: (A, B) Frontal chest radiographs in two patients show
air in the pericardial cavity (arrows).
Figure 143:
Pneumopericardium: (A, B) Frontal chest radiographs in two patients show air in the pericardial cavity (arrows).
Pneumopericardium: Transverse contrast-enhanced CT image shows ventral
pericardial air collection (arrow).
Figure 144:
Pneumopericardium: Transverse contrast-enhanced CT image shows ventral pericardial air collection (arrow).
Pneumothorax: (A) Frontal chest radiograph and (B) transverse CT image
reconstruction of the left lung show air in the pleural space (arrows).
Figure 145:
Pneumothorax: (A) Frontal chest radiograph and (B) transverse CT image reconstruction of the left lung show air in the pleural space (arrows).
Pneumothorax: (A) Frontal chest radiograph, and (B) coronal and (C)
transverse CT image reconstructions of the lung show air in the left pleural
space loculated due to pleural adhesions.
Figure 146:
Pneumothorax: (A) Frontal chest radiograph, and (B) coronal and (C) transverse CT image reconstructions of the lung show air in the left pleural space loculated due to pleural adhesions.
Saber-sheath trachea: Transverse CT image of the mid trachea shows
saber-sheath configuration.
Figure 147:
Saber-sheath trachea: Transverse CT image of the mid trachea shows saber-sheath configuration.
Secondary pulmonary lobule: Transverse CT image of the right lower lobe
shows secondary pulmonary lobule surrounded by thickened interlobular septa
(arrows).
Figure 148:
Secondary pulmonary lobule: Transverse CT image of the right lower lobe shows secondary pulmonary lobule surrounded by thickened interlobular septa (arrows).
Septum: (A, B) Transverse CT images of the right upper lobe in two
different patients show thickened interlobular septa (arrow).
Figure 149:
Septum: (A, B) Transverse CT images of the right upper lobe in two different patients show thickened interlobular septa (arrow).
Septum: Transverse CT image of the right upper lobe shows thickened
interlobular septa (arrows).
Figure 150:
Septum: Transverse CT image of the right upper lobe shows thickened interlobular septa (arrows).
Septal lines: (A) Frontal chest radiograph and (B) coronal CT image
reconstruction show septal lines (arrows), formerly called Kerley B lines.
Figure 151:
Septal lines: (A) Frontal chest radiograph and (B) coronal CT image reconstruction show septal lines (arrows), formerly called Kerley B lines.
Septal thickening: Frontal chest radiograph shows septal lines (arrow).
Figure 152:
Septal thickening: Frontal chest radiograph shows septal lines (arrow).
Septal thickening: Transverse CT image of the right lower lobe shows
septal thickening and intralobular lines (arrows) in an area of crazy paving.
Figure 153:
Septal thickening: Transverse CT image of the right lower lobe shows septal thickening and intralobular lines (arrows) in an area of crazy paving.
Septal thickening: Transverse CT image of the right upper lobe shows
irregular ground-glass opacities (arrows) with interlobular septal thickening
and intralobular lines in an area of crazy paving.
Figure 154:
Septal thickening: Transverse CT image of the right upper lobe shows irregular ground-glass opacities (arrows) with interlobular septal thickening and intralobular lines in an area of crazy paving.
Septal thickening: Coronal CT image of the right lung shows septal
thickening and intralobular lines (arrow) in an area of crazy paving.
Figure 155:
Septal thickening: Coronal CT image of the right lung shows septal thickening and intralobular lines (arrow) in an area of crazy paving.
Signet ring sign: Transverse CT images of the (A) left and (B) right lower
lobe in two different patients show dilated bronchi accompanied by smaller
pulmonary arteries (arrow).
Figure 156:
Signet ring sign: Transverse CT images of the (A) left and (B) right lower lobe in two different patients show dilated bronchi accompanied by smaller pulmonary arteries (arrow).
Silhouette sign: (A, B) Frontal chest radiographs of two different
patients show obscuration of right-sided heart border by adjacent consolidation
in the middle lobe.
Figure 157:
Silhouette sign: (A, B) Frontal chest radiographs of two different patients show obscuration of right-sided heart border by adjacent consolidation in the middle lobe.
Spiculation: Transverse CT image of the right upper lobe shows a
spiculated mass.
Figure 158:
Spiculation: Transverse CT image of the right upper lobe shows a spiculated mass.
Tracheobronchomalacia: Transverse CT images at the level of the (A, C)
trachea and (B, D) the main bronchi in (A, B) inspiration and (C, D) expiration.
Expiration causes near-complete collapse of both trachea and main bronchi
(arrows).
Figure 159:
Tracheobronchomalacia: Transverse CT images at the level of the (A, C) trachea and (B, D) the main bronchi in (A, B) inspiration and (C, D) expiration. Expiration causes near-complete collapse of both trachea and main bronchi (arrows).
Tracheomalacia: Transverse CT images of the upper thorax. (A) In
inspiration, the shape of the trachea (arrow) is abnormal, with an increased
transverse diameter. (B) Expiration shows near-complete tracheal collapse
(arrow).
Figure 160:
Tracheomalacia: Transverse CT images of the upper thorax. (A) In inspiration, the shape of the trachea (arrow) is abnormal, with an increased transverse diameter. (B) Expiration shows near-complete tracheal collapse (arrow).
Excessive dynamic airway collapse: Transverse CT images at the level of
the aortic arch in (A) inspiration and (B) expiration. Expiration causes an
excessive invagination of the posterior tracheal wall (arrow).
Figure 161:
Excessive dynamic airway collapse: Transverse CT images at the level of the aortic arch in (A) inspiration and (B) expiration. Expiration causes an excessive invagination of the posterior tracheal wall (arrow).

Comment in

Similar articles

Cited by

References

    1. Tuddenham WJ . Glossary of terms for thoracic radiology: recommendations of the Nomenclature Committee of the Fleischner Society . AJR Am J Roentgenol 1984. ; 143 ( 3 ): 509 – 517 . - PubMed
    1. Austin JH , Müller NL , Friedman PJ , et al. . Glossary of terms for CT of the lungs: recommendations of the Nomenclature Committee of the Fleischner Society . Radiology 1996. ; 200 ( 2 ): 327 – 331 . - PubMed
    1. Hansell DM , Bankier AA , MacMahon H , McLoud TC , Müller NL , Remy J . Fleischner Society: glossary of terms for thoracic imaging . Radiology 2008. ; 246 ( 3 ): 697 – 722 . - PubMed
    1. Leivada E , D’Alessandro R , Grohmann KK . Eliciting Big Data From Small, Young, or Non-standard Languages: 10 Experimental Challenges . Front Psychol 2019. ; 10 : 313 . - PMC - PubMed
    1. Brady AP . Radiology reporting-from Hemingway to HAL? Insights Imaging 2018. ; 9 ( 2 ): 237 – 246 . - PMC - PubMed

LinkOut - more resources