. 2024 Apr 1;221(4):e20230561.
doi: 10.1084/jem.20230561. Epub 2024 Feb 27.

E-cadherin loss drives diffuse-type gastric tumorigenesis via EZH2-mediated reprogramming

Affiliations

E-cadherin loss drives diffuse-type gastric tumorigenesis via EZH2-mediated reprogramming

Gengyi Zou et al. J Exp Med. .

Abstract

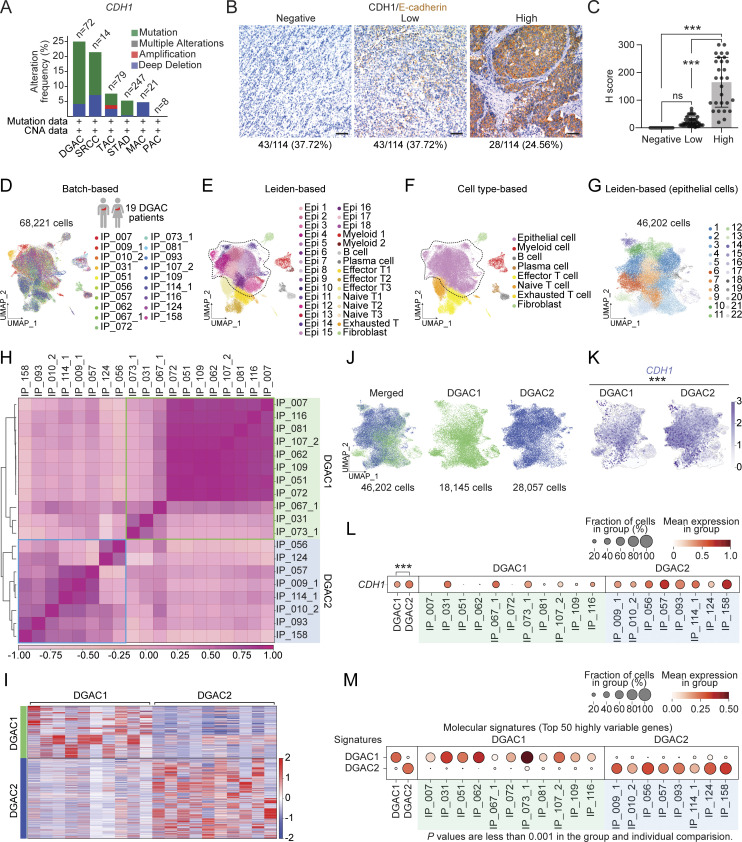
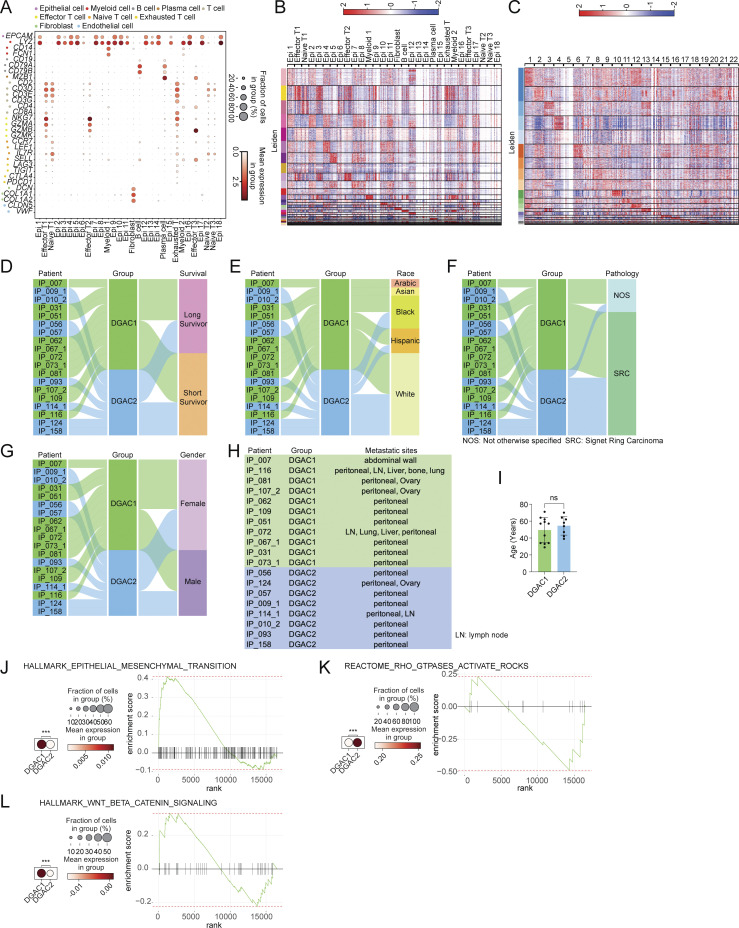
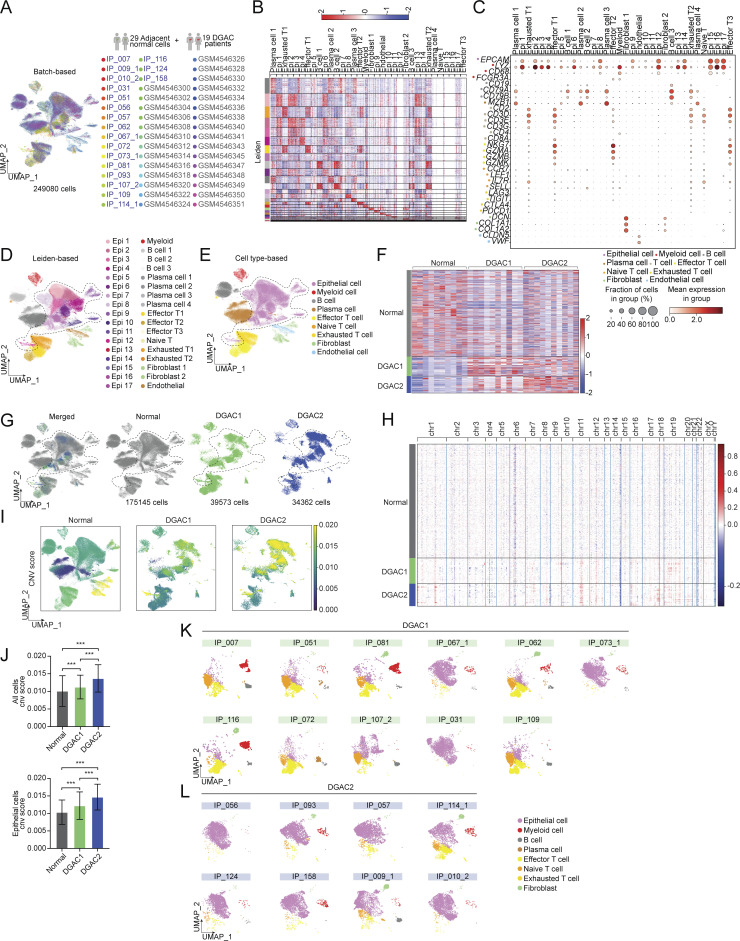
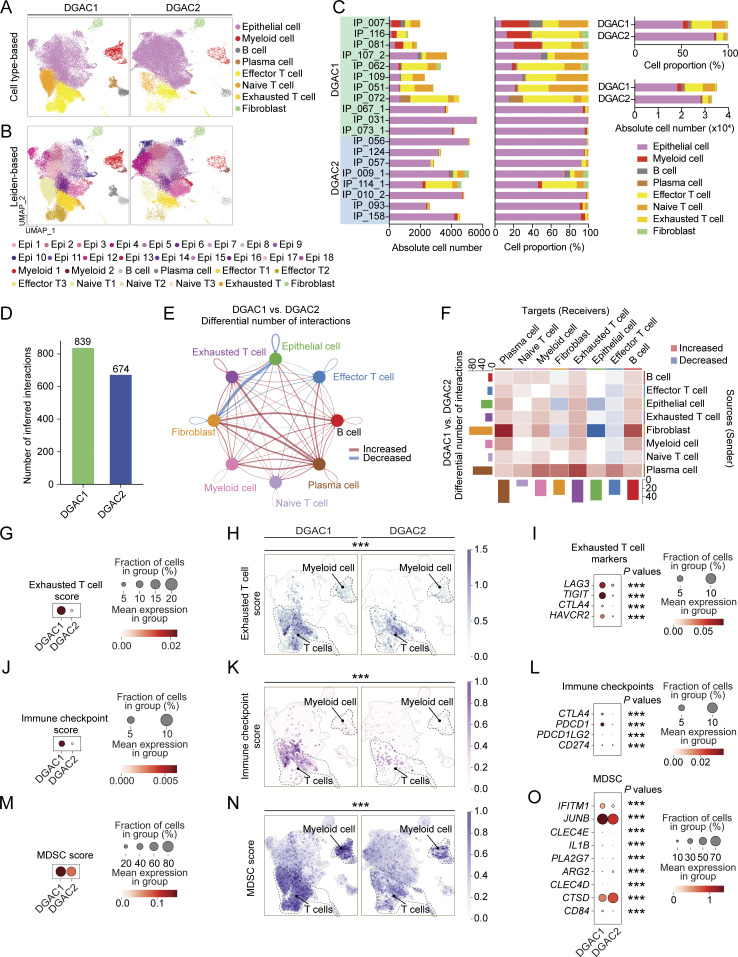
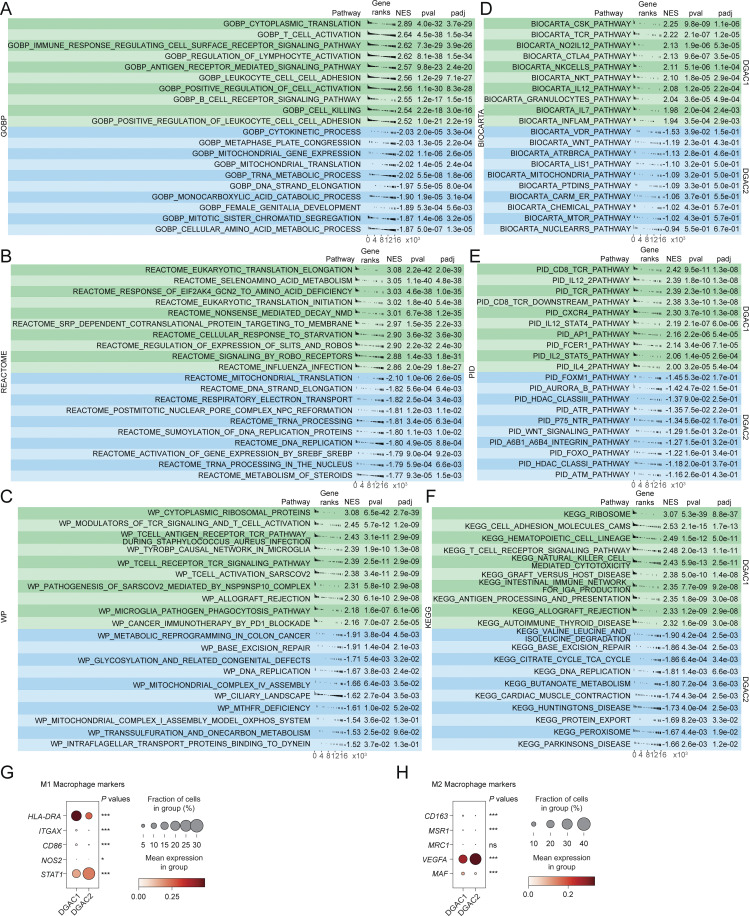
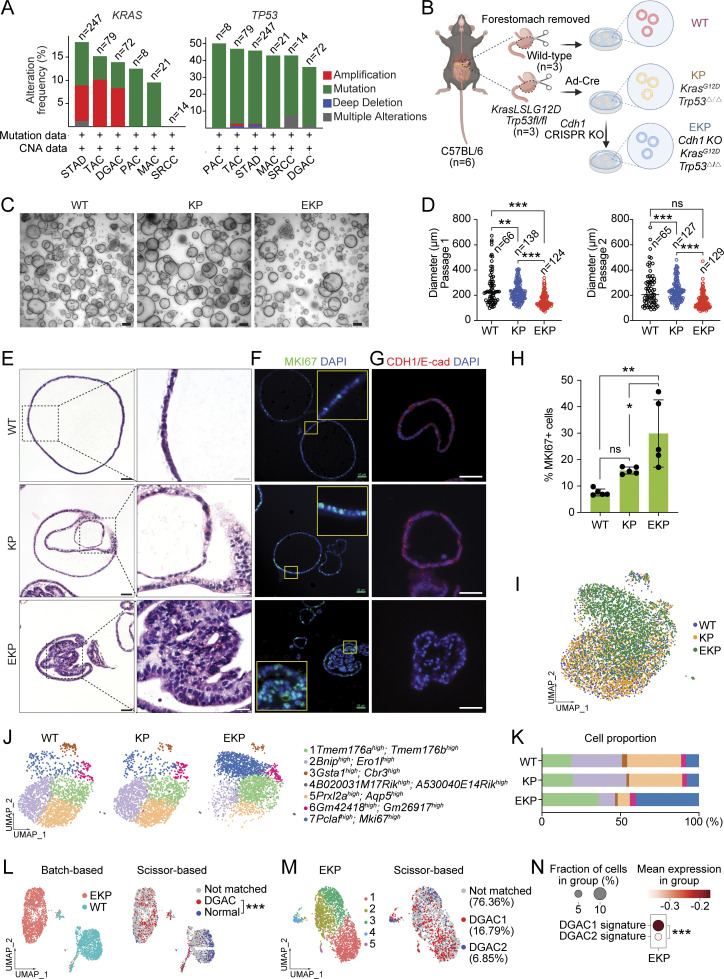
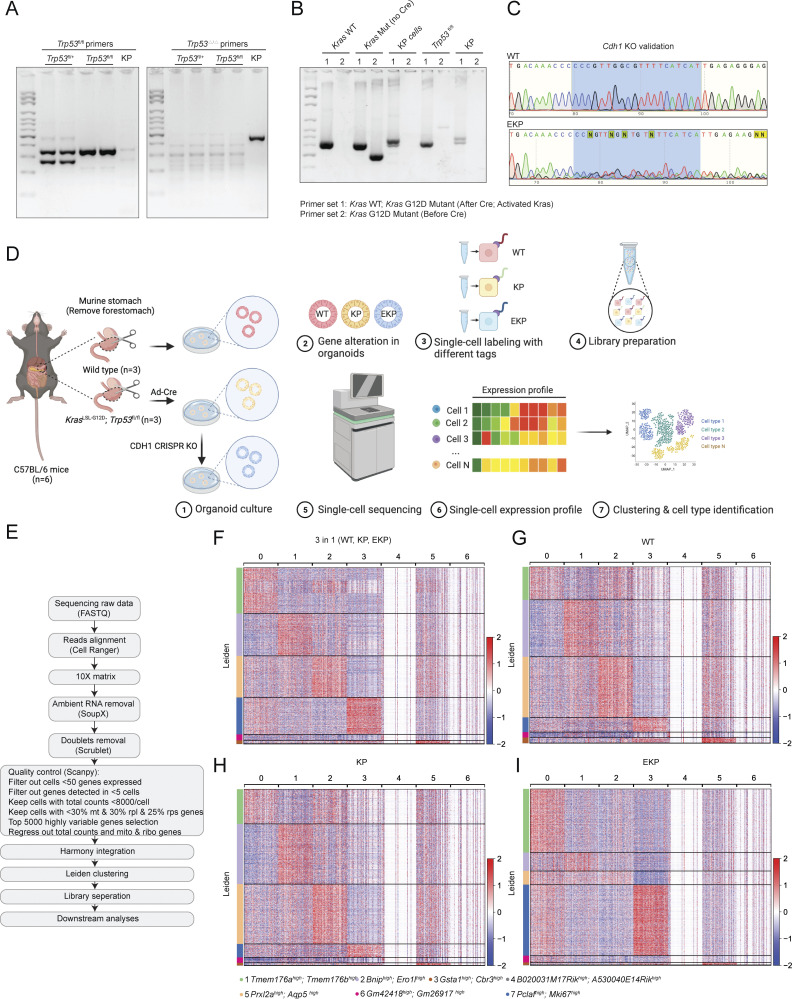
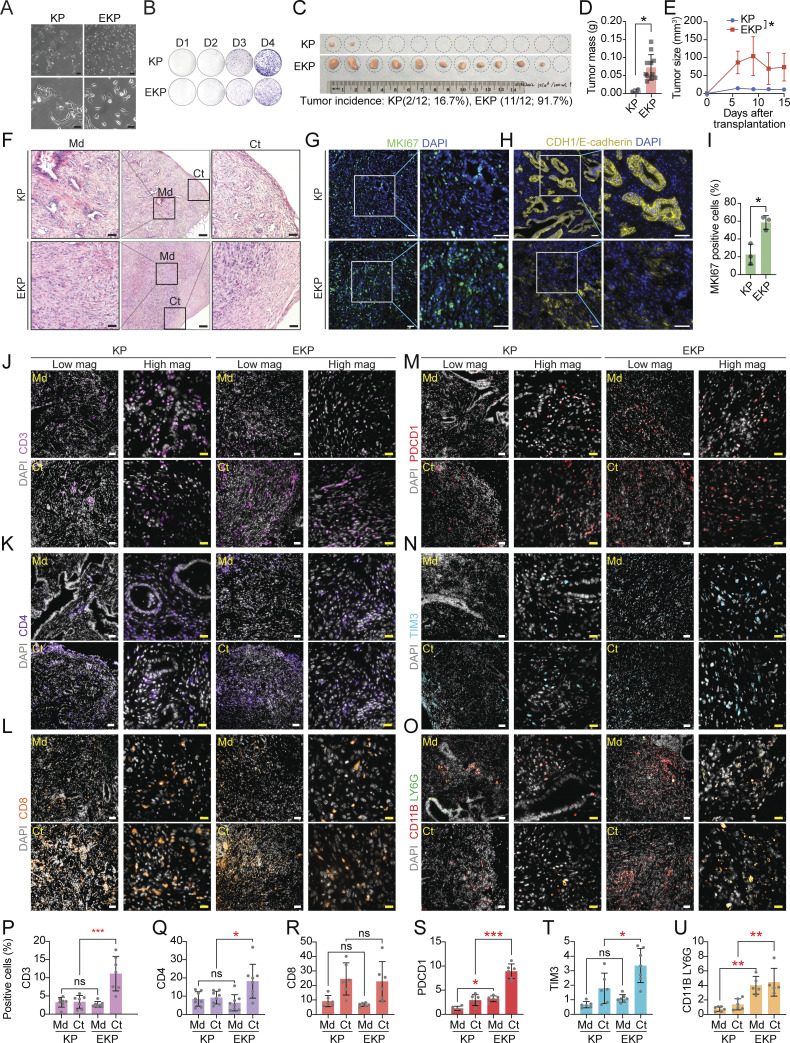
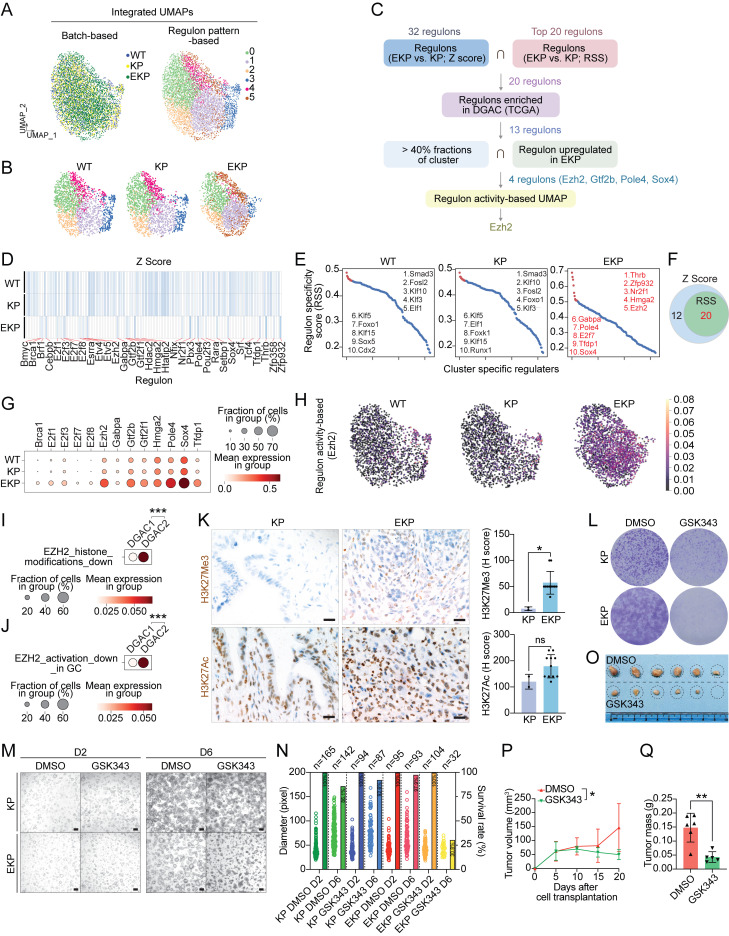
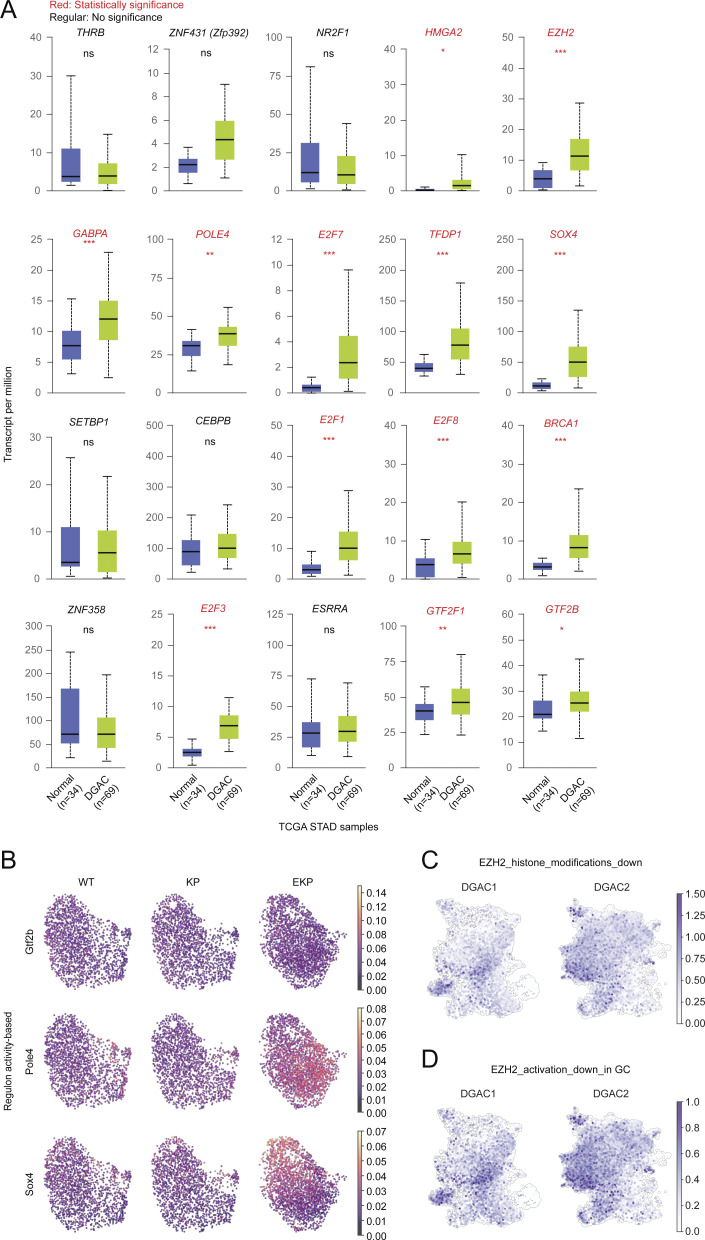
Diffuse-type gastric adenocarcinoma (DGAC) is a deadly cancer often diagnosed late and resistant to treatment. While hereditary DGAC is linked to CDH1 mutations, the role of CDH1/E-cadherin inactivation in sporadic DGAC tumorigenesis remains elusive. We discovered CDH1 inactivation in a subset of DGAC patient tumors. Analyzing single-cell transcriptomes in malignant ascites, we identified two DGAC subtypes: DGAC1 (CDH1 loss) and DGAC2 (lacking immune response). DGAC1 displayed distinct molecular signatures, activated DGAC-related pathways, and an abundance of exhausted T cells in ascites. Genetically engineered murine gastric organoids showed that Cdh1 knock-out (KO), KrasG12D, Trp53 KO (EKP) accelerates tumorigenesis with immune evasion compared with KrasG12D, Trp53 KO (KP). We also identified EZH2 as a key mediator promoting CDH1 loss-associated DGAC tumorigenesis. These findings highlight DGAC's molecular diversity and potential for personalized treatment in CDH1-inactivated patients.


Conflict of interest statement

Disclosures: The authors declare no competing interests exist.

Figures

Figure 1.
Figure 1.
CDH1 inactivation in DGAC patient tumor cells. (A) Genetic alterations of the CDH1 based on the cBioPortal stomach cancer datasets (https://www.cbioportal.org). n represents the total patients number enrolled in each subtype. DGAC, diffuse-type gastric adenocarcinoma; SRCC, signet ring cell carcinoma; TAC, tubular adenocarcinoma; STAD, stomach adenocarcinoma; MAC, mucinous adenocarcinoma; PAC, papillary adenocarcinoma. (B and C) IHC staining of CDH1/E-cadherin in 114 DGAC patient tumor samples. The representative images are shown; scale bar: 50 μm (B). Quantification of H score of CDH1 expression (C). P values were calculated using the one-way ANOVA; error bars: standard deviation (SD). Clinical information of 114 DGAC patients is available in Table S4. (D) Integrated batch-based UMAPs of 19 DGAC patients; integration package: Harmony. Clinical information of 19 DGAC patients is available in Table S5. (E) Integrated Leiden-based UMAP of 19 DGAC patients. Dashed line circle: epithelial cells. Epi: epithelial cells; Myeloid: myeloid cells; Effector T: effector T cells; Naïve T: naïve T cells; Exhausted T: exhausted T cells. (F) Integrated cell type-based UMAP of 19 DGAC patients. All cells were reclustered according to the Leiden clusters and gathered as mega clusters. Dashed line circle: epithelial cells. (G) Epithelial cells were reclustered by Leiden. (H) Correlation matrix plot of epithelial cells showing pair-wise correlations among all samples above. The dendrogram shows the distance of each dataset based on principal component analysis, and the Pearson correlation is displayed with a color spectrum. Groups of patients were categorized by dendrogram and correlation. (I) Type-based heatmap of epithelial cells of integrated datasets in 19 DGAC patients. The top 100 highly variable genes of each type are shown in Table S8. (J) Type-based integrated and separated UMAPs of DGAC1 and DGAC2. (K) Feature plots of epithelial cells displaying CDH1 expression. (L) Dot plots of epithelial cells of CDH1 expression in different DGAC groups and individual patients. P values were calculated by using a t test. (M) Molecular signatures of DGAC1 and DGAC2 patients. Top 50 highly variable genes were used to calculate the molecular signature of each group. Gene list is shown in Table S8. Dot plots of epithelial cells of each molecular signature in different subtypes and individual patient. P values were calculated by Mann–Whitney testing. ns: P > 0.05, ***: P ≤ 0.001. All data are derived from two or more independent experiments with the indicated number of human donors.
Figure S1.
Figure S1.
Transcriptional, clinical, and molecular characterization of DGAC subtypes. (A) Dot plots of epithelial cell, myeloid cell, B cell, plasma cell, T cell, effector T cell, naïve T cell, exhausted T cell, fibroblast, and endothelial cell markers in integrated 19 DGAC patients scRNA-seq data. (B) Leiden-based heatmap of all cells of integrated datasets with annotations in 19 DGAC patients. The most highly variable 100 genes of each cluster are shown in Table S6. (C) Leiden-based heatmap of epithelial cells of integrated datasets in 19 DGAC patients. The most highly variable 100 genes of each cluster were showed in Table S7. (D–G) Venn diagram illustrating 19 DGAC patient groups with survival, race, pathology, and gender data. Long-term survivors (surviving over 1 year after diagnosis) and short-term survivors (deceased within 6 mo post-diagnosis) were classified according to our previous publication (Wang et al., 2021). (H) Metastatic sites of DGAC1 and DGAC2 patients. (I) Age difference between DGAC1 and DGAC2 patients. P values were calculated using Student’s t test; error bars: SD. (J–L) Dot plots and GSEA of EMT (J), RHOA (K), and WNT (L) scores in two DGAC types. The datasets we used for dot plots and GSEA are from GSEA molecular signature database (https://www.gsea-msigdb.org/gsea/msigdb/index.jsp): EMT: Human Gene Set: HALLMARK_EPITHELIAL_MESENCHYMAL_TRANSITION; RHOA: Human Gene Set: REACTOME_RHO_GTPASES_ACTIVATE_ROCKS; WNT: Human Gene Set: HALLMARK_WNT_BETA_CATENIN_SIGNALING. P values were calculated by Mann–Whitney testing (J–L). The genes included in each score are listed in Table S9. ns: P > 0.05; ***: P ≤ 0.001. All data are derived from two or more independent experiments with the indicated number of human donors.
Figure S2.
Figure S2.
scRNA-seq analysis of 19 DGAC patients and 29 adjacent normal stomach tissue. (A) Integrated batch-based UMAP of 29 adjacent normal stomach tissue (normal tissue) and 19 DGAC patients. Total cell numbers are 249,080. Integration package: Harmony. (B) Annotated Leiden-based integrated UMAPs of 19 DGAC patients and 29 adjacent normal stomach tissue. Epi: Epithelial cells; Myeloid: myeloid cells; Effector T: effector T cells; Naïve T: Naïve T cells; Exhausted T: Exhausted T cells; Endothelial: Endothelial cells. (C) Dot plots of epithelial cell, myeloid cell, B cell, plasma cell, T cell, effector T cell, naïve T cell, exhausted T cell, fibroblast, and endothelial cell markers in integrated 19 DGAC patients and 29 adjacent normal stomach tissue scRNA-seq data. (D) Integrated Leiden-based UMAPs of 29 adjacent normal stomach tissue (normal tissue) and 19 DGAC patients. Epi: epithelial cells; Myeloid: myeloid cells; Effector T: effector T cells; Naïve T: naïve T cells; Exhausted T: exhausted T cells. The most highly variable 100 genes of each cluster are shown in Table S10. (E) Integrated cell type–based UMAP of 29 normal tissue and 19 DGAC patients. All cells were reclustered according to the Leiden clusters and gathered as mega clusters. Dashed line-circle: epithelial cells. (F) Type-based heatmap of all cells of integrated datasets in 19 DGAC patients and 29 adjacent normal stomach tissue. (G) Separated UMAPs of normal tissue and two types of DGACs. Dashed line-circle: epithelial cells. (H) CNV heatmap of DGAC1 and DGAC2, tumor-adjacent normal stomach tissue (Normal) was used as a reference for the CNV inference. Red: copy number gain (CNG); blue: copy number loss (CNL). (I) CNV heatmap of DGAC1 and DGAC2, tumor-adjacent normal stomach tissue (Normal) was used as reference for the CNV inference. (J) Statistics analysis of CNV score of all cells (left panel) and epithelial cells (right panel) among Normal, DGAC1, and DGAC2. P values were calculated using the one-way ANOVA; error bars: SD. (K and L) Individual cell type–based UMAP of the patients in DGAC1 and DGAC2. DGAC1 patients were enriched with stromal cells, mainly T cells. DGAC2 patients were enriched with epithelial cells. ***: P ≤ 0.001. All data are derived from two or more independent experiments with the indicated number of human donors.
Figure 2.
Figure 2.
Comparative analyses of immune landscapes of DGAC subtypes. (A and B) Cell type-based and Leiden-based UMAPs of DGAC1 and DGAC2. (C) Absolute and relative cell proportions of individual patients and DGAC subtypes. Patients list was ranked by the DGAC group they belong. (D) Total cell–cell interactions from DGAC1 and DGAC2 were analyzed by using the CellChat package. More interactions were found in DGAC1. (E and F) Differential number of interactions between DGAC1 and DGAC2 using circle plots (E) and heatmap (F). Red (or blue) colored edges (E) and squares (F) represent increased (or decreased) signaling in the DGAC1 compared to DGAC2. (G–I) Score-based dot plot (G), feature plots (H), and dot plot of individual marker gene (I) of exhausted T cell score (markers are included in that score: LAG3, TIGIT, CTLA4, and HAVCR2). Genes that were included in score analysis are shown in Table S9, P values were calculated by Mann–Whitney testing. For the dot plot of a single gene, P values were calculated by using a t test. (J–L) Score-based dot plot (J), feature plots (K), and dot plot of individual marker gene (L) of immune checkpoint score (markers are included in that score: CTLA4, PDCD1, PDCD1LG2, and CD274). Genes that were included in score analysis are shown in Table S9, P values were calculated by Mann–Whitney testing. For the dot plot of single gene, P values were calculated by using a t test. (M–O) Score-based dot plot (M), feature plots (N), and dot plot of individual marker gene (O) of exhausted T cell score (markers are included in that score: IFITM1, JUNB, CLEC4E, IL1B, PLA2G7, ARG2, CLEC4D, CTSD, and CD84). Genes that were included in score analysis are shown in Table S9, P values were calculated by Mann–Whitney testing. For the dot plot of single gene, P values were calculated by using a t test. ***: P ≤0.001. All data are derived from two or more independent experiments with the indicated number of human donors.
Figure S3.
Figure S3.
GSEA analysis and the expression of macrophage polarization markers of DGAC1 and DGAC2. (A–F) GSEA analysis comparing DGAC1 to DGAC2 using DGAC2 as the reference gene set. Enriched pathways in DGAC1 are displayed in the upper green panel, while those in DGAC2 are shown in the lower blue panel. Pathway datasets analyzed include GOBP (A), REACTOME (B), WP (C), BIOCARTA (D), PID (E), and KEGG (F). Pathways with positive normalized enrichment score (NES) indicate enrichment in DGAC1, while those with negative NES indicate enrichment in DGAC2. GOBP: gene ontology biological process; REACTOME: reactome gene sets; WP: WikiPathways gene sets; BIOCARTA: BioCarta gene sets; PID: PID gene sets; KEGG: KEGG gene sets. Pathways related with immune response were enriched in DGAC1 based on GOBP, WP, BIOCARTA, PID, and KEGG. (G and H) Dot plot of macrophage polymerization markers in DGAC1 and DGAC2. Most of the M1 and M2 markers are enriched in DGAC1, except for STAT1 and VEGFA. P values were calculated by using a t test. ns: P > 0.05; *: P ≤ 0.05; ***: P ≤ 0.001. All data are derived from two or more independent experiments with the indicated number of human donors.
Figure 3.
Figure 3.
Establishment of genetically engineered gastric organoids with Cdh1-inactivation. (A) Genetic alteration of the KRAS, and TP53 genes based on the cBioPortal. n represents the total number of patients enrolled in each subtype. DGAC, diffuse-type gastric adenocarcinoma; SRCC, signet ring cell carcinoma; TAC, tubular adenocarcinoma; STAD, stomach adenocarcinoma; MAC, mucinous adenocarcinoma; PAC, papillary adenocarcinoma. (B) Illustration of the workflow for stomach tissue collection and dissociation, gene manipulation of the gastric organoids (GOs), GOs culture, and representative image of GOs. Three GO lines were generated, including WT, KP, and EKP. WT mice and KP mice were sacrificed to collect stomach tissue. After removing the forestomach, stomach tissue was dissociated into a single cell and culture as organoids. Adeno-Cre virus was used to treat KrasLSL-G12D; Trp53fl/fl organoids to generate KP organoids, followed by nutlin-3 selection. After selection, EKP organoids were generated using CRISPR-mediated Cdh1 KO from KP GOs. (C) Representative images of WT, KP, and EKP GOs at passage day 8. Scale bars: 200 μm. (D) Growth analysis for WT, KP, and EKP GOs in two passages on day 8 of each passage. P values were calculated using the one-way ANOVA; error bars: SD. Numbers below each label represent the number of organoids. (E) H&E staining of WT, KP, and EKP GOs. Scale bars: 50 μm (left panels); 200 μm (right panels). (F) MKI67 staining of WT, KP, and EKP GOs (n = 5). Scale bars: 50 μm. (G) CDH1 staining of WT, KP, and EKP GOs (n = 5). Scale bars: 50 μm. (H) Statistics analysis of MKI67 staining (Fig. 3 F). P values were calculated using the one-way ANOVA; error bars: SD. The representative images are shown. (I) Batch-based UMAPs of WT, KP, and EKP GOs. The Harmony integration package was used to remove the batch effect. (J) Leiden-based clustering UMAPs of WT, KP, and EKP GOs. Cell clusters were named by the most highly variable genes. (K) Cell proportion analysis of WT, KP, and EKP GOs. Each color represents a different cell type. The color code is based on the cell types shown in Fig. 3 J. (L) Batch-based and Scissor-based UMAP of WT and EKP GOs generated by the Scissor package. TCGA datasets of normal stomach and DGAC patients were utilized. (M) Cluster-based and Scissor-based UMAP of EKP GOs generated by Scissor package. DGAC1 and DGAC2 datasets were utilized to perform the comparison. (N) Dot plots of EKP GOs of DGAC1 and DGAC2 molecular signatures. The top 50 highly variable genes were used to calculate the molecular signature of each DGAC subtype. Gene list is shown in Table S8. P values were calculated by Mann–Whitney testing. ns: P > 0.05; *: P ≤ 0.05; **: P ≤ 0.01; ***: P ≤ 0.001. All data are derived from two or more independent experiments with the indicated number of mice.
Figure S4.
Figure S4.
Validation of genetic engineering and scRNA-seq analysis of mouse GOs. (A–C) Genotyping results of KP organoids (A and B). After adeno-Cre treatment, KP organoids lost Trp53, while KrasG12D was activated in KP organoids. After CDH1 CRISPR KO, we performed Sanger sequencing to compare the sequence of CDH1 in WT and EKP (C). The five targeting sequences against CDH1 are shown in CRISPR/Cas9-based gene knockout in GOs. The primers used for genotyping are shown in Table S2. (D) Illustration of the workflow for stomach tissue collection and dissociation, gene manipulation of the gastric organoids (GOs), sample preparation of multiplex scRNA sequencing. (E) Workflow of single-cell library preparation. (F) Heatmap of each cell clusters of integrated datasets, including WT, KP, and EKP. (G–I) Separate heatmap of each cell clusters of WT, KP, and EKP datasets, respectively. All data are derived from two or more independent experiments with the indicated number of mice. Source data are available for this figure: SourceData FS4.
Figure 4.
Figure 4.
Cdh1 KO promotes KP-driven gastric tumorigenesis. (A) Bright-field images of KP and EKP cells in low and high magnification. Scale bars: 100 μm (upper panels); 50 μm (lower panels). (B) Crystal violet staining of KP and EKP GOs-derived cells. (C) Bright-field images of KP and EKP allograft tumors; tumor incidence of allograft tumors. (D and E) Plot for tumor mass (D) and tumor size (E) assessment of KP and EKP allografts. (F) H&E staining of KP and EKP allograft tumors (n ≥ 3). Scale bars (from left to right): 50, 200, 50 μm; Md: middle; Ct: cortex. (G and H) Immunostaining of KP and EKP allograft tumors (n ≥ 3) for MKI67 (G) and E-cadherin (H). Scale bars: 50 μm. (I) Statistics analysis of MKi67 staining in Fig. 4 G. P values were calculated using Student’s t test; error bars: SD. (J–O) CD3 (J), CD4 (K), CD8 (L), PDCD1 (M), TIM3 (N) staining and CD11B/LY6G co-staining (O) of KP and EKP allograft tumors (n ≥ 3). Left panels (low magnification [low mag]; right panels (high magnification [high mag]). Scale bars: 50 μm (low mag) and 20 μm (high mag). (P–U) Statistics analysis of CD3 (P), CD4 (Q), CD8 (R), PDCD1 (S), TIM3 (T) staining and CD11B/LY6G co-staining (U). The positive cell percentage indicates the area of cells expressing a specific marker divided by the total field–occupied cells stained by DAPI in the same area, which allows for normalization. Md: middle; Ct: cortex. P values were calculated using the one-way ANOVA; error bars: SD. ns: P > 0.05; *: P ≤ 0.05; **: P ≤ 0.01; ***: P ≤ 0.001. All data are derived from two or more independent experiments with the indicated number of mice.
Figure 5.
Figure 5.
Cdh1 KO-activated Ezh2 promotes gastric tumorigenesis. (A) Integrated batch-based and regulon pattern-based UMAP for WT, KP, and EKP GOs. Six transcriptional modules were identified. (B) Separated regulon patterns based UMAP for WT, KP, and EKP GOs. (C) Flow chart of regulons selection process. (D) Regulons enriched in WT, KP, and EKP GOs, based on Z Score. 32 regulons were highly expressed in EKP samples compared to WT and KP. (E) Regulons enriched in WT, KP, and EKP GOs, based on RSS. The top 20 were selected by Z score. The whole regulon list based on RSS is shown in Table S18. (F) Venn diagram for the regulons from D and E. 20 regulons were overlapped. (G) Dot plot of the regulons (WT, KP, and EKP GOs) increased in TCGA DGAC patients. (H) Regulon activity-based UMAP of Ezh2 in WT, KP, and EKP GOs. The cells with lighter color represent regulated by Ezh2. (I and J) Dot plots of Ezh2 downstream target genes (I, genes which are downregulated by EZH2 activation through histone modification; J, genes which are downregulated by EZH2 activation reported in gastric cancer) scores in the epithelial cells of DGAC1 and DGAC2. P values were calculated by using a Mann–Whitney testing. Gene list of EZH2 targeted genes was listed in Table S9. (K) The level of H3K27Ac and H3K27Me3 expression in KP and EKP allografts. Quantification was displayed. Scale bars: 20 μm. (L) Crystal violet staining of KP and EKP cells after GSK343 (EZH2 inhibitor, 10 μM, 96 h). (M) Bright-field images of KP and EKP GOs after treatment with GSK343 (EZH2 inhibitor, 10 μM, 96 h). D2: day 2; D6: day 6. Scale bars: 200 μm. (N) Statistical analysis of KP and EKP gastric organoid size and number in response to GSK343 treatment. The number of organoids (right Y-axis) and their size (left Y-axis) were assessed following treatment with GSK343. On day 2 (D2), the number of organoids was determined for the image depicted in M, and this count was considered as 100% (n numbers are presented in the bubble plot). On day 6 (D6), the number of organoids in the same field for each group was counted (n numbers also displayed in the bubble plot). The percentage of each group on D6 was calculated by dividing the number of viable organoids at D6 by the number at D2. The viable percentage is presented in the bar graph. (O–Q) Transplantation of EKP cells followed by EZH2 inhibition. (O) Bright-field images of EKP allograft tumors treated with DMSO and GSK343 (20 mg/kg) separately (n = 3). (P) Tumor growth curve of EKP allografts treated with DMSO and GSK343 (20 mg/kg) after cell subcutaneous transplantation. (Q) Tumor mass of EKP allografts treated with DMSO and GSK343 (20 mg/kg) after mice scarification. P values were calculated using Student’s t test; error bars: SD. ns: P > 0.05; *: P ≤ 0.05; **: P ≤ 0.01; ***: P ≤ 0.001. All data are derived from two or more independent experiments with the indicated number of samples.
Figure S5.
Figure S5.
EKP-specific regulons expression and EZH2 downstream targeted genes expression. (A) The expression of 20 regulons in TCGA DGAC patients and normal stomach. (B) Regulon activity based UMAP of Gtf2b, Pole4, and Sox4. P values were calculated by using the Student’s t test; error bars: SD. (C and D) Feature plots of EZH2 downstream target genes (C, genes which are downregulated by EZH2 through histone modification; D, genes which are downregulated by EZH2 reported in gastric cancer) scores in the epithelial cells of DGAC1 and DGAC2. Gene list of EZH2 targeted genes was listed in Table S9. ns: P > 0.05; *: P ≤ 0.05; **: P ≤ 0.01; ***: P ≤ 0.001. All data are derived from two or more independent experiments with the indicated number of samples.

Update of

References

    1. Aibar, S., González-Blas C.B., Moerman T., Huynh-Thu V.A., Imrichova H., Hulselmans G., Rambow F., Marine J.C., Geurts P., Aerts J., et al. . 2017. SCENIC: Single-cell regulatory network inference and clustering. Nat. Methods. 14:1083–1086. 10.1038/nmeth.4463 - DOI - PMC - PubMed
    1. Ajani, J.A., D’Amico T.A., Bentrem D.J., Chao J., Cooke D., Corvera C., Das P., Enzinger P.C., Enzler T., Fanta P., et al. . 2022. Gastric cancer, version 2.2022, NCCN clinical practice guidelines in oncology. J. Natl. Compr. Canc. Netw. 20:167–192. 10.6004/jnccn.2022.0008 - DOI - PubMed
    1. Al-Ahmadie, H.A., Iyer G., Lee B.H., Scott S.N., Mehra R., Bagrodia A., Jordan E.J., Gao S.P., Ramirez R., Cha E.K., et al. . 2016. Frequent somatic CDH1 loss-of-function mutations in plasmacytoid variant bladder cancer. Nat. Genet. 48:356–358. 10.1038/ng.3503 - DOI - PMC - PubMed
    1. Assumpção, P.P., Barra W.F., Ishak G., Coelho L.G.V., Coimbra F.J.F., Freitas H.C., Dias-Neto E., Camargo M.C., and Szklo M.. 2020. The diffuse-type gastric cancer epidemiology enigma. BMC Gastroenterol. 20:223. 10.1186/s12876-020-01354-4 - DOI - PMC - PubMed
    1. Astudillo, P. 2020. Wnt5a signaling in gastric cancer. Front. Cell Dev. Biol. 8:110. 10.3389/fcell.2020.00110 - DOI - PMC - PubMed