. 2024 Apr 1;221(4):e20230699.
doi: 10.1084/jem.20230699. Epub 2024 Feb 27.

Framework for in vivo T cell screens

Affiliations

Framework for in vivo T cell screens

Lauren E Milling et al. J Exp Med. .

Abstract

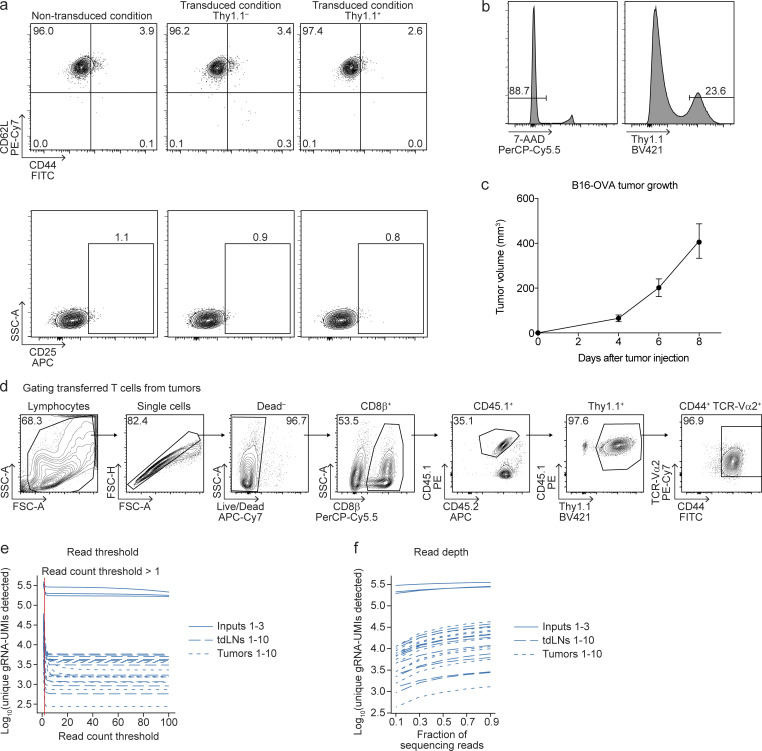
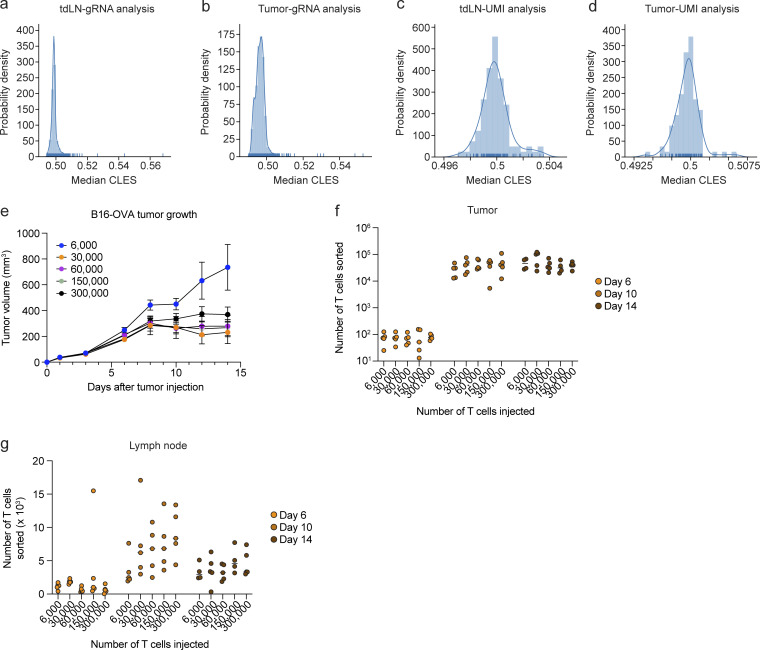
In vivo T cell screens are a powerful tool for elucidating complex mechanisms of immunity, yet there is a lack of consensus on the screen design parameters required for robust in vivo screens: gene library size, cell transfer quantity, and number of mice. Here, we describe the Framework for In vivo T cell Screens (FITS) to provide experimental and analytical guidelines to determine optimal parameters for diverse in vivo contexts. As a proof-of-concept, we used FITS to optimize the parameters for a CD8+ T cell screen in the B16-OVA tumor model. We also included unique molecular identifiers (UMIs) in our screens to (1) improve statistical power and (2) track T cell clonal dynamics for distinct gene knockouts (KOs) across multiple tissues. These findings provide an experimental and analytical framework for performing in vivo screens in immune cells and illustrate a case study for in vivo T cell screens with UMIs.


Conflict of interest statement

Disclosures: L.E. Milling and M.W. LaFleur reported grants from Merck Sharp & Dohme LLC during the conduct of the study. N.M. Derosia and P. Prathima reported grants from Merck during the conduct of the study and grants from Merck outside the submitted work. I.S.L. Streeter and A.M. Lemmen reported grants from Merck during the conduct of the study. G.H. Hickok reported grants from Merck & Co. during the conduct of the study. N. Hacohen reported personal fees from Danger Bio/Related Science, Immune Repertoire Medicines, and CytoReason, grants from Bristol Myers Squibb, and grants from Calico Life Sciences outside the submitted work. J.G. Doench reported personal fees from BioNTech, Tango Therapeutics, Microsoft Research, and Pfizer outside the submitted work; in addition, J.G. Doench consults for Microsoft Research, Abata Therapeutics, Servier, Maze Therapeutics, BioNTech, Sangamo, and Pfizer; consults for and has equity in Tango Therapeutics; serves as a paid scientific advisor to the Laboratory for Genomics Research, funded in part by GlaxoSmithKline; and receives funding support from the Functional Genomics Consortium: Abbvie, Bristol Myers Squibb, Janssen, Vir Biotechnology, and Merck Sharp & Dohme LLC, a subsidiary of Merck & Co., Inc., Rahway, NJ, USA. J.G. Doench’s interests were reviewed and managed by the Broad Institute in accordance with its conflict-of-interest policies. A.H. Sharpe reported grants from NIH U19AI133524 and grants from NIH P01 AI108545 during the conduct of the study; grants from Vertex, Moderna, Merck Sharp & Dohme, AbbVie, Quark/IOME, Roche, Ipsen, Novartis, Erasca, Taiwan Bio, and Calico; personal fees from Surface Oncology, Sqz Biotechnologies, Elpiscience, Selecta, Bicara, Fibrogen, Alixia, GlaxoSmithKline, Janssen, Amgen, and Bioentre; and “other” from IOME, Monopteros, and Corner Therapeutics outside the submitted work; in addition, A.H. Sharpe had patent numbers 7,432,059 and 7,722,868 with royalties paid “Roche, Merck, Bristol-Myers-Squibb, EMD-Serono, Boehringer-Ingelheim, AstraZeneca, Leica, Mayo Clinic, Dako and Novartis,” patent numbers 8,652,465 and 9,457,080 licensed “Roche,” patent numbers 9,683,048, 9,815,898, 9,845,356, 10,202,454, and 10,457,733 licensed “Novartis,” patent numbers 9,580,684, 9,988,452, 10,370,446, 10,457,733, 10,752,687, 10,851,165, 10,934,353, and 15,314,251 issued; and is on scientific advisory boards for the Massachusetts General Cancer Center, Program in Cellular and Molecular Medicine at Boston Children’s Hospital, the Human Oncology and Pathogenesis Program at Memorial Sloan Kettering Cancer Center, The Gladstone Institute, and the Bloomberg-Kimmel Institute for Cancer Immunotherapy is an academic editor for the Journal of Experimental Medicine. A.H. Sharpe is on advisory boards for Elpiscience, Bicara, Monopteros, Fibrogen, Corner Therapeutics, Bioentre, IOME, Alixia, GlaxoSmithKline, Janssen, and Amgen. No other disclosures were reported.

Figures

None
Graphical abstract
Figure 1.
Figure 1.
A subset of clonally distinct CD8+ T cells engrafts in tumors following adoptive transfer. (a) Schematic depicting key parameters—gene number, cell number, and mouse number—that need to be defined for robust in vivo screens in immune cells. (b) 0–300,000 OT-1 naive CD8+ T cells were adoptively transferred to mice (day –1) that were subsequently injected with 5 million B16-OVA tumor cells (day 0). Tumor growth kinetics were monitored (n = 10 mice per group, performed twice, one-way ANOVA at day 12 with Tukey’s multiple comparisons test, all labeled statistics are relative to the 0 group and non-significant comparisons are not labeled, **P < 0.01, ***P < 0.001, ****P < 0.0001). (c) Schematic of in vivo barcoding experiment. OT-1 Cas9-expressing naive CD8+ T cells were transduced with a lentiviral gRNA library containing combinations of 6,000 potential gRNAs and 96 tetraloop-embedded UMIs and a Thy1.1 reporter. Transduced cells were isolated and (1) transferred to recipient animals at 300,000 cells per animal or (2) sequenced for input representation. Recipient animals were injected with B16-OVA tumor cells, and following 8 days of tumor growth, transferred Thy1.1+ cells were isolated from tumors and tdLNs and sequenced for output representation. (d) Quantification of the number of transferred Thy1.1+ CD8+ T cells sorted from the tdLN and tumor in the 576,000-gRNA-UMI barcoding experiment (n = 10 mice, performed once). (e) Predicted distribution of the number of cells per gRNA-UMI based on sampling 300,000 clones from 576,000 possible clones using a Poisson distribution. The y-axis represents the fraction of the population of cells that is represented by one, two, three, four, five, or six cells per gRNA-UMI. (f) Number of gRNA-UMI combinations detected (engraftment number) in the input, tdLN, and tumor samples (input: n = 3 samples and tdLN/tumor: n = 10 mice, performed once). Detection is defined as >1 read. (g) Engraftment rate calculated as the engraftment number in f divided by the number of cells transferred (300,000) in the tdLN and tumor samples (n = 10 mice, performed once). Dashed lines connecting tdLN and tumor represent samples from the same mouse. (h) Schematic of barcoding experiment with 6,000 gRNAs and 384 UMIs. (i) Predicted distribution of the number of cells per gRNA-UMI based on sampling 6,000–300,000 clones from 2,304,000 possible clones using a Poisson distribution. The y-axis represents the fraction of the population of cells that is represented by one, two, three, four, five, or six cells per gRNA-UMI. (j and k) Number of gRNA-UMI combinations detected (engraftment number) in the (j) tdLN and (k) tumor samples (n = 4–5 mice per group per timepoint, performed once). Detection threshold is defined in the methods. Graphs represent: mean and SEM (b), mean and SD (d), mean (f), median and 25th–75th percentiles (g), or mean and 95% confidence interval (j and k).
Figure S1.
Figure S1.
Additional data related to Fig. 1. (a) Naive CD8+ T cells were either transduced and gated on the transduction reporter (Thy1.1) or not transduced. Representative flow cytometry plots of CD62L, CD44, and CD25 expression following lentiviral transduction of naive CD8+ T cells (n = 1 sample per condition, performed twice). (b) Representative flow cytometry plots of the viability and transduction efficiency of transduced naive CD8+ T cells for the 576,000-gRNA-UMI barcoding experiment (n = 1 sample, performed once). (c) Tumor volume curve for the 576,000-gRNA-UMI barcoding experiment (n = 10 mice, performed once). (d) Gating schematic for sorting transferred Thy1.1+ CD8+ T cells from tumors and tdLNs for the 576,000-gRNA-UMI barcoding experiment. (e) Number of gRNA-UMIs detected in the 576,000-gRNA-UMI barcoding experiment calculated using read count thresholds of 0–100 reads (n = 10 mice, performed once). Vertical red line represents the read count threshold of 2. (f) Number of gRNA-UMIs detected in the 576,000-gRNA-UMI barcoding experiment calculated using a read count threshold of >1 read, following random downsampling of the read depth (n = 10 mice, performed once). Graphs represent: mean and SEM (c).
Figure S2.
Figure S2.
Additional data related to Fig. 1. (a and b) Median CLES across the 10 biological replicates for the tdLN (a) and tumor (b) for the 6,000 gRNAs in the 576,000-gRNA-UMI barcoding experiment (n = 10 mice, performed once). Individual gRNAs are represented by dark blue tick marks on the x-axis. (c and d) Median CLES across the 10 biological replicates for the tdLN (c) and tumor (d) for the 96 UMIs in the 576,000-gRNA-UMI barcoding experiment (n = 10 mice, performed once). Individual UMIs are represented by dark blue tick marks on the x-axis. (e) Tumor volume curve for the 2,304,000-gRNA-UMI barcoding experiment (n = 4–5 mice per group per timepoint, performed once). (f and g) Quantification of the number of transferred Thy1.1+ CD8+ T cells sorted from the (f) tumor and (g) tdLN in the 2,304,000-gRNA-UMI barcoding experiment (n = 4–5 mice per group per timepoint, performed once). Circles represent replicate mice. Graphs represent: mean and SEM (e) or median (f and g).
Figure 2.
Figure 2.
FITS enables robust T cell screens in vivo. (a) Schematic of potential impacts of gRNAs on T cell proliferation and trafficking between the tdLN and tumor. (b) Probability of recovery of 0–100 genes in the tdLN and tumor in any of the mice from 0 to 60 mice. This calculation assumes a 300,000-cell transfer, a 0.04% engraftment rate, and that gene recovery is defined as >1 read for ≥6 gRNAs/gene in ≥1 mouse. (c) Schematic for the 100-gRNA in vivo screen. OT-1 Cas9-expressing naive CD8+ T cells were transduced with a lentiviral gRNA library containing combinations of 100 gRNAs and 96 tetraloop-embedded UMIs and a Thy1.1 reporter. Thy1.1+ transduced cells were isolated and (1) transferred to recipient animals at 300,000 cells per animal or (2) sequenced for input representation. Recipient animals were injected with B16-OVA tumor cells and, following 11 days of tumor growth, 48 mice were pooled into six groups of eight mice each to facilitate tissue processing and Thy1.1+ cell isolation. Transferred cells were isolated from tumors and tdLNs and sequenced for output representation. (d) Gene recovery from the screen in the tdLN and tumor superimposed (blue dot) on the probability of recovery of 0–100 genes in any of the mice from 0 to 60 mice (as in b) (n = 48 mice, performed once). Gene recovery is defined as >1 read for ≥6 gRNAs/gene in ≥1 mouse. (e) Heatmaps of Pearson correlation coefficients for tdLN versus input, tumor versus input, and tumor versus tdLN log2-normalized gRNA fold changes across replicate pools (A–F) of mice (n = 6 samples composed of eight pooled mice per sample, performed once). (f and g) Log2-normalized gRNA-level fold changes (organized by gene) for (f) tumor versus input and (g) tumor versus tdLN (n = 6 samples composed of eight pooled mice per sample, performed once). Open circles represent replicate gRNAs and replicate mouse pools. Gray-colored bars represent positive control genes. Graphs represent: mean and SD (f and g).
Figure S3.
Figure S3.
Additional data related to Fig. 2. (a) Probability of recovery of 0–10,000 genes in the tdLN or the tumor in any of the mouse pools (composed of 10 mice pooled together) from 1 to 10 mouse pools. This calculation assumes a 300,000-cell transfer per mouse (3,000,000-cell transfer per mouse pool), a 2% engraftment rate, and that gene recovery is defined as >1 read for ≥15 gRNAs/gene in ≥1 mouse pool. (b) Tumor volume curves for the 100-gRNA (9,600-gRNA-UMI) screen experiment (n = 8 mice per group A–F, performed once). (c) Quantification of the number of transferred Thy1.1+ CD8+ T cells sorted from the tdLN and tumor in the 100-gRNA screen experiment (n = 6 samples composed of eight pooled mice per sample, performed once). (d and e) Recovery of (d) gRNA-UMIs or (e) gRNAs for the 9,600-gRNA-UMI screen in input, tdLN, and tumor samples (input: n = 4 samples, tdLN/tumor: n = 6 samples composed of eight pooled mice per sample, performed once). Recovery is defined as >1 read. The orange dotted line represents 9,600 gRNA-UMIs (d) or 100 gRNAs (e). (f and g) Gene recovery from the screen in the (f) tdLN or (g) tumor superimposed (blue dot) on the probability of recovery of 0–10,000 genes in the tdLN (f) or tumor (g) of any of the mouse pools (as in a) (n = 48 mice, performed once). (h) Log2-normalized gRNA-level fold changes (organized by gene) for tdLN versus input (n = 6 samples composed of eight pooled mice per sample, performed once). Open circles represent replicate gRNAs and replicate mouse pools. Gray colored bars represent positive control genes. Graphs represent: mean and SEM (b) or mean and SD (c–e and h).
Figure 3.
Figure 3.
Screening coverage impacts mouse replicate concordance. (a) Schematic for downsampling UMIs to simulate downsampled cell coverage. (b and c) ICC2 for (b) tdLN versus input and tumor versus input and (c) tumor versus tdLN gRNA fold changes across replicate pools of mice following downsampling of UMIs (n = 6 samples composed of eight pooled mice per sample, performed once). Red dotted line represents an ICC2 of 0.6. (d) Schematic depicting the coverage required for input, tdLN, and tumor comparisons. Graphs represent: mean of the 1,000 iterations (b and c).
Figure 4.
Figure 4.
FAUST improves incorporation of UMI replicates into screen hit analyses. (a) Log2-normalized UMI-level fold changes (organized by gene) for tumor versus input for the 100-gRNA screen in Fig. 2 c (n = 6 samples composed of eight pooled mice per sample, performed once). Each box represents replicate UMIs, replicate gRNAs, and replicate mouse pools. Gray-colored bars represent positive control genes. (b) Percentage of UMIs detected per gRNA for the 100-gRNA screen (n = 6 samples composed of eight pooled mice per sample, performed once). Open circles represent replicate gRNAs and replicate mouse pools. Detection is defined as >1 read. (c) Schematic of FAUST approach for comparison of input, tdLN, and tumor samples through an input/output ratio, which is used to calculate a P value and an effect size. (d–f) Waterfall plot of CLES, the probability of recovering a given target gRNA or a control gRNA following a random sampling, and P values for enriched and depleted hits in the 100-gRNA screen comparing (d) tdLN versus input, (e) tumor versus input, and (f) tumor versus tdLN (n = 6 samples composed of eight pooled mice per sample, performed once, FAUST). The dashed blue horizontal line in d–f represents a CLES of 0.5 (equal probability of detecting a control or target gRNA-UMI). The dashed red horizontal lines in d–f represent effect size cutoffs for genes of interest (<0.4 or >0.6). Hits are defined as having a q value <0.05. Graphs represent: median and 25–75% interquartile range (a), mean and SD (b), or median, the 25th–75th percentiles, replicate pools (black dots), and the distribution of replicates (via kernel density estimation) (d–f).
Figure S4.
Figure S4.
Additional data related to Fig. 4. (a) Histograms of log2-normalized sequencing reads of gRNA-UMIs from input, tdLN, and tumor samples from the 100-gRNA screen experiment (input: n = 4 samples, tdLN/tumor: n = 6 samples composed of eight pooled mice per sample, performed once). (b) Maximum likelihood (left) and minimum Chi-squared (right) evaluation of the fit of the 100-gRNA screen experiment read counts (true) to a modeled negative binomial distribution (modeled) based on mean, SD, skew, and kurtosis (n = 16 samples [input: n = 4 samples, tdLN/tumor: n = 6 samples composed of eight pooled mice per sample], performed once, Wilcoxon signed-rank test). (c–e) Waterfall plot of common language effect sizes and P values for enriched and depleted hits in the 100-gRNA screen comparing (c) tdLN versus input, (d) tumor versus input, and (e) tumor versus tdLN (n = 6 samples composed of eight pooled mice per sample, performed once, FAUST). The dashed blue horizontal line in c–e represents a CLES of 0.5 (equal probability of detecting a control or target gRNA-UMI). The dashed red horizontal lines in c–e represent effect size cutoffs for genes of interest (<0.4 or >0.6). (f–i) gRNA-level enriched (f and g) and depleted (h and i) hit calling, using corresponding single-sided tests, for the 100-gRNA screen experiment comparing FAUST (f and h) to MAGeCK (g and i) (n = 6 samples composed of eight pooled mice per sample, performed once, FAUST/MAGeCK). The long dashed line represents a q value of 0.05. Graphs represent: median and the 25th–75th percentiles (c–i).
Figure S5.
Figure S5.
Additional data related to Fig. 5. (a) Flow cytometry analyses of CD44 and PD-1 expression on OT-1 Thy1.1+ CD8+ T cells from the ipsilateral and contralateral inguinal and axillary LNs (n = 1 sample composed of nine pooled mice, performed once). Ipsilateral = Ipsi, Contralateral = Contra, Inguinal = Ing, and Axillary = Axi. (b) Tumor volume curve for the 100-gRNA screen experiment in Fig. 5 a (n = 9 mice, performed once). (c) Quantification of the number of transferred Thy1.1+ CD8+ T cells sorted from the LNs and tumor in the 100-gRNA screen experiment in Fig. 5 a (n = 1 sample composed of nine pooled mice, performed once). (d) Number of gRNA-UMI combinations detected in the LN and tumor samples (n = 1 sample composed of nine pooled mice, performed once). Detection is defined as >1 read. (e) MOI for UMIs corresponding to a specific gRNA across all 6 LN paired comparisons (n = 1 sample composed of nine pooled mice, performed once). (f–h) Scatter plot of (f) LN-Ipsi-Ing versus input CLES, (g) LN-Contra-Ing versus input CLES, and (h) LN-Contra-Axi versus input CLES compared with the mean MOI between LNs (n = 1 sample composed of nine pooled mice, performed once, Kendall-τ). Each individual black dot represents a gene. Genes are called out for a CLES <0.3 or >0.6. (i) Expansion factor of gRNA-UMIs targeting Zc3h12a or Ptpn2 (n = 1 sample composed of nine pooled mice, performed once). Graphs represent: mean and SEM (b), mean and SD (input bar for d), or mean (e).
Figure 5.
Figure 5.
gRNA-UMI pairs enable characterization of gene KO T cell clonal relationships across multiple tissues. (a) Schematic of screen to assess gRNAs that impact T cell responses derived from multiple LN sites. (b) Heatmap of CLES for each gene in the tumor, ipsilateral inguinal LN (Ipsi-Ing), ipsilateral axillary LN (Ipsi-Axi), contralateral inguinal LN (Contra-Ing), and contralateral axillary LN (Contra-Axi) compared with input (n = 1 sample composed of nine pooled mice, performed once). (c) MOI of UMIs for each gRNA across indicated organs (n = 1 sample composed of nine pooled mice, performed once). MOI values can be between 0 (no overlap) and 1 (complete overlap). (d and e) Scatter plot of (d) tumor versus input CLES compared with the mean MOI between LNs or (e) Ipsi-Axi-LN versus input CLES compared with the mean MOI between LNs (n = 1 sample composed of nine pooled mice, Kendall-τ). Each individual black dot represents a gene. Genes are called out for a CLES <0.3 or >0.6. (f) Counts for individual gRNA-UMIs targeting Zc3h12a and Ptpn2 in the input, indicated LN, and tumor (n = 1 sample composed of nine pooled mice, performed once). Counts were normalized by dividing the counts for gRNA-UMIs targeting Zc3h12a or Ptpn2 by the average number of control gRNA-UMIs at each site. The numbers in each column represent the number of gRNA-UMIs with at least one read (maximum of 288 for all gRNA-UMIs detected). (g) Schematic of two tumor-enriched gene KOs (Zc3h12a and Ptpn2) that illustrate two potential routes for becoming tumor-enriched.
Figure 6.
Figure 6.
Applying the FITS framework to T cell screens. Performing an in vivo barcoding experiment with an optimized number of adoptively transferred T cells can help determine the number of cells that engraft tumors and tdLNs. This number can be used to determine the library size that can be feasibly screened in a given number of mice. Using these values, an in vivo screen can be designed that also incorporates UMIs into the library for increasing statistical power and tracking clonal responses. Following screening, assessment of gRNA recovery, mouse replicate concordance, and the biology of positive and negative controls can be used to determine the robustness of the screen results. If the data are of high quality, hypotheses can be generated from the screen data. This includes novel regulators of cell abundance as well as genes that impact the clonality of responses, through assessment of UMIs. QC, quality control.

References

    1. Chen, Z., Arai E., Khan O., Zhang Z., Ngiow S.F., He Y., Huang H., Manne S., Cao Z., Baxter A.E., et al. 2021. In vivo CD8+ T cell CRISPR screening reveals control by Fli1 in infection and cancer. Cell. 184:1262–1280.e22. 10.1016/j.cell.2021.02.019 - DOI - PMC - PubMed
    1. Chow, R.D., and Chen S.. 2018. Cancer CRISPR screens in vivo. Trends Cancer. 4:349–358. 10.1016/j.trecan.2018.03.002 - DOI - PMC - PubMed
    1. Connolly, K.A., Kuchroo M., Venkat A., Khatun A., Wang J., William I., Hornick N.I., Fitzgerald B.L., Damo M., Kasmani M.Y., et al. 2021. A reservoir of stem-like CD8+ T cells in the tumor-draining lymph node preserves the ongoing antitumor immune response. Sci. Immunol. 6:eabg7836. 10.1126/sciimmunol.abg7836 - DOI - PMC - PubMed
    1. Doench, J.G. 2018. Am I ready for CRISPR? A user’s guide to genetic screens. Nat. Rev. Genet. 19:67–80. 10.1038/nrg.2017.97 - DOI - PubMed
    1. Doench, J.G., Fusi N., Sullender M., Hegde M., Vaimberg E.W., Donovan K.F., Smith I., Tothova Z., Wilen C., Orchard R., et al. 2016. Optimized sgRNA design to maximize activity and minimize off-target effects of CRISPR-Cas9. Nat. Biotechnol. 34:184–191. 10.1038/nbt.3437 - DOI - PMC - PubMed