. 2024 Mar 4;221(3):e20221839.
doi: 10.1084/jem.20221839. Epub 2024 Feb 27.

Nutrients: Signal 4 in T cell immunity

Affiliations

Nutrients: Signal 4 in T cell immunity

Jana L Raynor et al. J Exp Med. .

Abstract

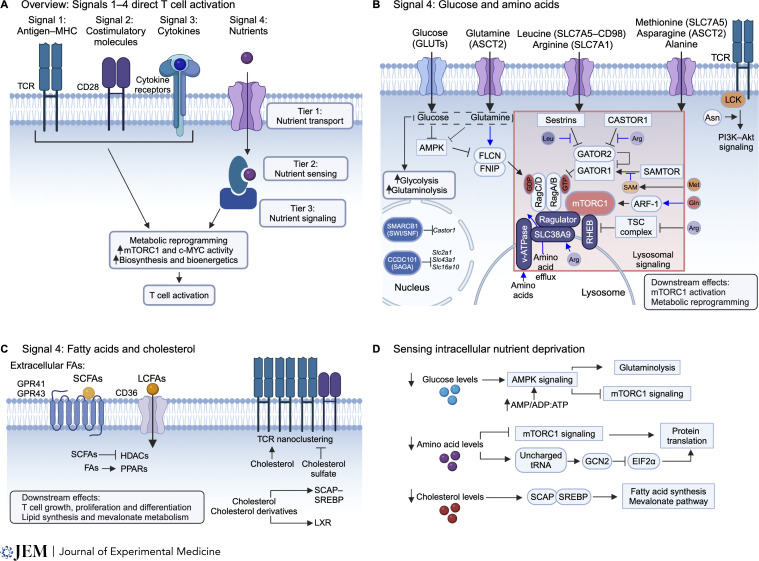
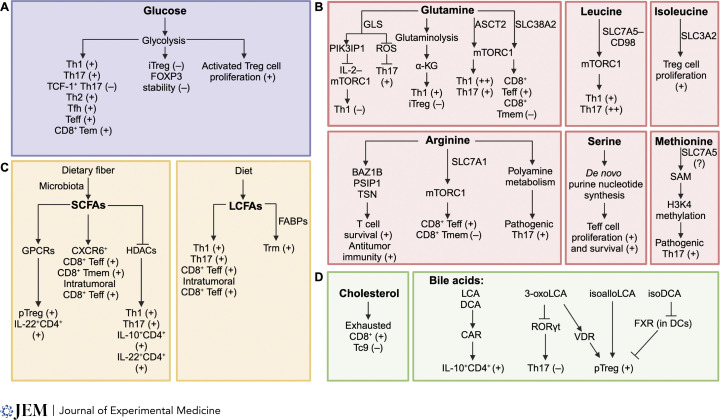
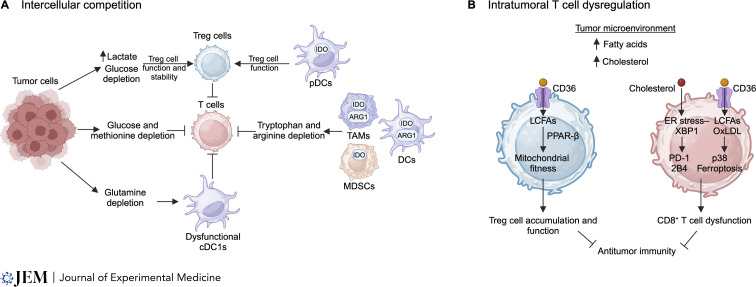
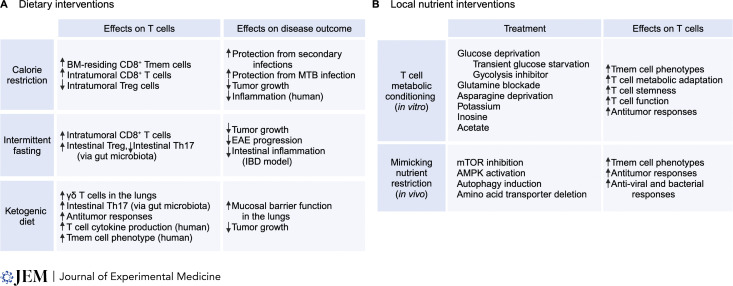
T cells are integral in mediating adaptive immunity to infection, autoimmunity, and cancer. Upon immune challenge, T cells exit from a quiescent state, followed by clonal expansion and effector differentiation. These processes are shaped by three established immune signals, namely antigen stimulation (Signal 1), costimulation (Signal 2), and cytokines (Signal 3). Emerging findings reveal that nutrients, including glucose, amino acids, and lipids, are crucial regulators of T cell responses and interplay with Signals 1-3, highlighting nutrients as Signal 4 to license T cell immunity. Here, we first summarize the functional importance of Signal 4 and the underlying mechanisms of nutrient transport, sensing, and signaling in orchestrating T cell activation and quiescence exit. We also discuss the roles of nutrients in programming T cell differentiation and functional fitness and how nutrients can be targeted to improve disease therapy. Understanding how T cells respond to Signal 4 nutrients in microenvironments will provide insights into context-dependent functions of adaptive immunity and therapeutic interventions.


Conflict of interest statement

Disclosures: H. Chi reported personal fees from Kumquat Biosciences, Inc., Chugai Pharmaceuticals, and ONO Pharmaceutical Co. outside the submitted work; in addition, H. Chi has patents/patent applications in the field of immunotherapy pending. No other disclosures were reported.

Figures

Figure 1.
Figure 1.
Signal 4 nutrients in directing T cell activation. (A) Overview of Signals 1 (TCR binding to antigen presented on MHC molecules), 2 (co-stimulation by CD28), 3 (cytokine signals), and 4 (nutrients) that drive T cell immunity. Signal 4 is mediated through a three-tiered process composed of nutrient transport, sensing, and signal transduction. Signals 1–3 can augment Signal 4 by promoting the expression of nutrient transporters, while Signal 4 also interplays with Signals 1–3, for example, by shaping signaling and metabolic events. Integration of Signals 1–4 results in metabolic reprogramming, associated with increased mTORC1 signaling, c-MYC activity, and activation of biosynthesis pathways and cellular bioenergetics, altogether driving T cell activation. (B) Glucose and amino acid uptake into T cells, mediated by membrane transporters, promotes mTORC1 activation and metabolic reprogramming. Sestrins, CASTOR1, and SAMTOR represent cytosolic sensors of amino acids. Leucine and arginine respectively bind to and sequester Sestrins and CASTOR1 from GATOR2, relieving their suppressive effects on GATOR2, thereby allowing GATOR2 to promote mTORC1 activation (via inhibiting GATOR1). SAMTOR senses the methionine metabolite S-adenosylmethionine (SAM). SAM binding to SAMTOR disrupts SAMTOR–GATOR1 complex formation, thereby inhibiting the ability of GATOR1 to negatively regulate mTORC1 activation. SLC38A9 senses arginine in the lysosome, and both SLC38A9 and v-ATPase signal the increase in intralysosomal amino acid concentrations to promote mTORC1 activation, which may involve controlling the efflux of amino acids from the lysosome. Arginine also promotes mTORC1 signaling by regulating TSC–RHEB signaling. Glutamine signals through ADP ribosylation factor 1 (ARF-1) to promote mTORC1. Asparagine is sensed by LCK to promote TCR-mediated PI3K–Akt signaling. The SWI/SNF complex (including SMARCB1) inhibits gene expression of Castor1 and thereby enhances mTORC1 activity. CCDC101-associated SAGA complex inhibits the expression of glucose and amino acid transporters genes (Slc2a1, Slc43a1, and Slc16a10) and maintains T cell quiescence. Positive regulators of mTORC1 are denoted in ovals and negative regulators of mTORC1 are denoted in rectangles. Blue arrows indicate nutrient sensing that remains to be validated in primary T cells. (C) Fatty acid (FA) and cholesterol sensing and signaling can promote T cell growth, proliferation, and differentiation. SCFAs signal through GPCRs, or intracellular SCFAs can act as HDAC inhibitors. LCFAs can be transported into cells by CD36 and sensed intracellularly by PPARs. Cholesterol and cholesterol sulfate regulate TCR nanoclustering to either promote or impair TCR signaling, respectively. Intracellular cholesterol and cholesterol derivatives are recognized and can signal through SCAP–SREBP to influence lipid synthesis and mevalonate metabolism. Cholesterol derivatives are recognized and can signal through LXR to regulate T cell differentiation. (D) Mechanisms to sense low intracellular nutrient and metabolite abundance are also present in T cells. Glucose or glutamine deprivation activates AMPK in T cells, and AMPK mediates increased glutaminolysis and reduced mTORC1 signaling during glucose deprivation. AMPK is activated when the levels of AMP or ADP are relatively higher than ATP, or by extracellular ATP indirectly (not depicted here). Low amino acid levels impair mTORC1 signaling and increase the number of uncharged tRNAs. General control nonderepressible 2 (GCN2) binds to uncharged tRNAs and inhibits eukaryotic translation initiator factor 2 α (EIF2α)–dependent protein translation. Low cholesterol levels activate SCAP–SREBP signaling, which promotes fatty acid synthesis and the mevalonate pathway by transcriptional induction of lipid biosynthetic enzyme expression.
Figure 2.
Figure 2.
Nutrients modulate T cell differentiation and function. (A) Glucose metabolism (via glycolysis) promotes the differentiation of the indicated CD4+ T cell subsets and the generation of CD4+ and CD8+ effector T cells (Teff) and Tem CD8+ T cells. Glycolysis limits FOXP3 expression or stability but is upregulated in activated, proliferating Treg cells. (B) The contributions of intracellular amino acids (glutamine, leucine, isoleucine, arginine, serine, and methionine) to CD4+ T cell differentiation and Teff and memory (Tmem) CD8+ T cell responses are indicated. (C) SCFAs, including acetate, butyrate, and propionate, are derived from the fermentation of dietary fiber by intestinal microbiota. SCFAs alter the differentiation of the indicated CD4+ and CD8+ T cell subsets, which can occur via signaling through GPCRs or inhibiting HDACs. Diet-derived LCFAs regulate the indicated T cell populations. LCFAs promote Trm cell formation through fatty acid binding proteins (FABPs). Further, dietary TVA and linoleic acid, which are both LCFAs, enhance CD8+ T cell function and antitumor immunity. (D) Cholesterol promotes CD8+ T cell exhaustion and inhibits Tc9 cell generation in the TME. Intestinal bile acid derivatives (3-oxoLCA, isoalloLCA, and isoDCA) exert differential effects on the generation of Th17 and pTreg cells, as indicated. In particular, bile acid metabolites, including 3-oxoLCA, can promote pTreg cell accumulation in the colon through the vitamin D receptor (VDR). Constitutive androstane receptor (CAR) limits inflammation by detoxifying bile acids and promoting IL-10–producing CD4+ T cells in the intestine. Farnesoid X receptor (FXR) in DCs is suppressed by isoDCA, thereby promoting pTreg cell differentiation.
Figure 3.
Figure 3.
Nutrient deprivation and lipid accumulation limit T cell function. (A) Intercellular competition for nutrients can limit T cell function. Tumor cells compete with immune cells for glucose, glutamine, and methionine in the TME, leading to nutrient deprivation that directly inhibits T cells, or indirectly inhibits T cells by negatively affecting the functionality of cDC1s. In contrast, metabolic adaptation of Treg cells allow the cells to maintain their suppressive capacity in conditions of low glucose and high lactate in the TME. IDO-expressing pDCs help maintain Treg suppressive function. Further, IDO and ARG1-expressing DCs and TAMs, and IDO-expressing MDSCs, catabolize tryptophan and arginine, leading to localized depletion. Consequently, T cell function is impaired. (B) Lipids, including fatty acids and cholesterol, accumulate in the TME. CD8+ T cells in the TME increase the uptake of oxidized low-density lipoprotein (OxLDL) by CD36, leading to greater lipid peroxidation, p38 kinase activation and ferroptosis. Further, increased intracellular cholesterol in CD8+ T cells promotes ER stress–XBP1 signaling and coinhibitory receptor expression, including PD-1 and 2B4. Together, increased cholesterol and fatty acids induce CD8+ T cell dysfunction in the TME. However, increased CD36 expression on intratumoral Treg cells correlates with increased lipid uptake and mitochondrial fitness and persistence via PPAR-β signaling. Treg cell accumulation in the TME may further impair T cell function and antitumor immunity.
Figure 4.
Figure 4.
Nutritional intervention for disease therapy. (A) The effects of calorie restriction, intermittent fasting, or the ketogenic diet on T cell immunity and disease outcomes in mice and humans. (B) The effects of in vitro metabolic conditioning, including glucose deprivation, glutamine blockade, asparagine deprivation, or supplementation with potassium, inosine, and acetate, on CD8+ T cell fate and function in vivo (top row). The effects of in vivo treatments that mimic calorie restriction, including mTOR inhibition, AMPK activation, induction of autophagy, and deletion of amino acid transporters, on T cell fate and function. Bone marrow (BM), Mycobacterium tuberculosis (MTB), experimental autoimmune encephalomyelitis (EAE), inflammatory bowel disease (IBD).

Similar articles

Cited by

References

    1. Abu-Remaileh, M., Wyant G.A., Kim C., Laqtom N.N., Abbasi M., Chan S.H., Freinkman E., and Sabatini D.M.. 2017. Lysosomal metabolomics reveals V-ATPase- and mTOR-dependent regulation of amino acid efflux from lysosomes. Science. 358:807–813. 10.1126/science.aan6298 - DOI - PMC - PubMed
    1. Ahmed, T., Das S.K., Golden J.K., Saltzman E., Roberts S.B., and Meydani S.N.. 2009. Calorie restriction enhances T-cell-mediated immune response in adult overweight men and women. J. Gerontol. A. Biol. Sci. Med. Sci. 64:1107–1113. 10.1093/gerona/glp101 - DOI - PMC - PubMed
    1. Alizadeh, D., Wong R.A., Yang X., Wang D., Pecoraro J.R., Kuo C.F., Aguilar B., Qi Y., Ann D.K., Starr R., et al. . 2019. IL15 enhances CAR-T cell antitumor activity by reducing mTORC1 activity and preserving their stem cell memory phenotype. Cancer Immunol. Res. 7:759–772. 10.1158/2326-6066.CIR-18-0466 - DOI - PMC - PubMed
    1. Ananieva, E.A., Patel C.H., Drake C.H., Powell J.D., and Hutson S.M.. 2014. Cytosolic branched chain aminotransferase (BCATc) regulates mTORC1 signaling and glycolytic metabolism in CD4+ T cells. J. Biol. Chem. 289:18793–18804. 10.1074/jbc.M114.554113 - DOI - PMC - PubMed
    1. Ang, Q.Y., Alexander M., Newman J.C., Tian Y., Cai J., Upadhyay V., Turnbaugh J.A., Verdin E., Hall K.D., Leibel R.L., et al. . 2020. Ketogenic diets alter the gut microbiome resulting in decreased intestinal Th17 cells. Cell. 181:1263–1275.e16. 10.1016/j.cell.2020.04.027 - DOI - PMC - PubMed