. 2024 Feb 5;7(2):e240407.
doi: 10.1001/jamanetworkopen.2024.0407.

Tumor-Stroma Proportion to Predict Chemoresistance in Patients With Ovarian Cancer

Affiliations

Tumor-Stroma Proportion to Predict Chemoresistance in Patients With Ovarian Cancer

Emil Lou et al. JAMA Netw Open. .

Abstract

Importance: Platinum-based chemotherapy is the backbone of standard-of-care treatment for patients with advanced-stage, high-grade serous carcinoma (HGSC), the most common form of ovarian cancer; however, one-third of patients have or acquire chemoresistance toward platinum-based therapies.

Objective: To demonstrate the utility of tumor-stroma proportion (TSP) as a predictive biomarker of chemoresistance of HGSC, progression-free survival (PFS), and overall survival (OS).

Design, setting, and participants: This prognostic study leveraged tumors from patients with HGSC in The Cancer Genome Atlas (TCGA) cohort (1993-2013) and an independent cohort of resected clinical specimens from patients with HGSC (2004-2014) available in diagnostic and tissue microarray formats from the University of Tübingen in Germany. Data analysis was conducted from January 2021 to January 2024.

Exposure: Diagnosis of HGSC.

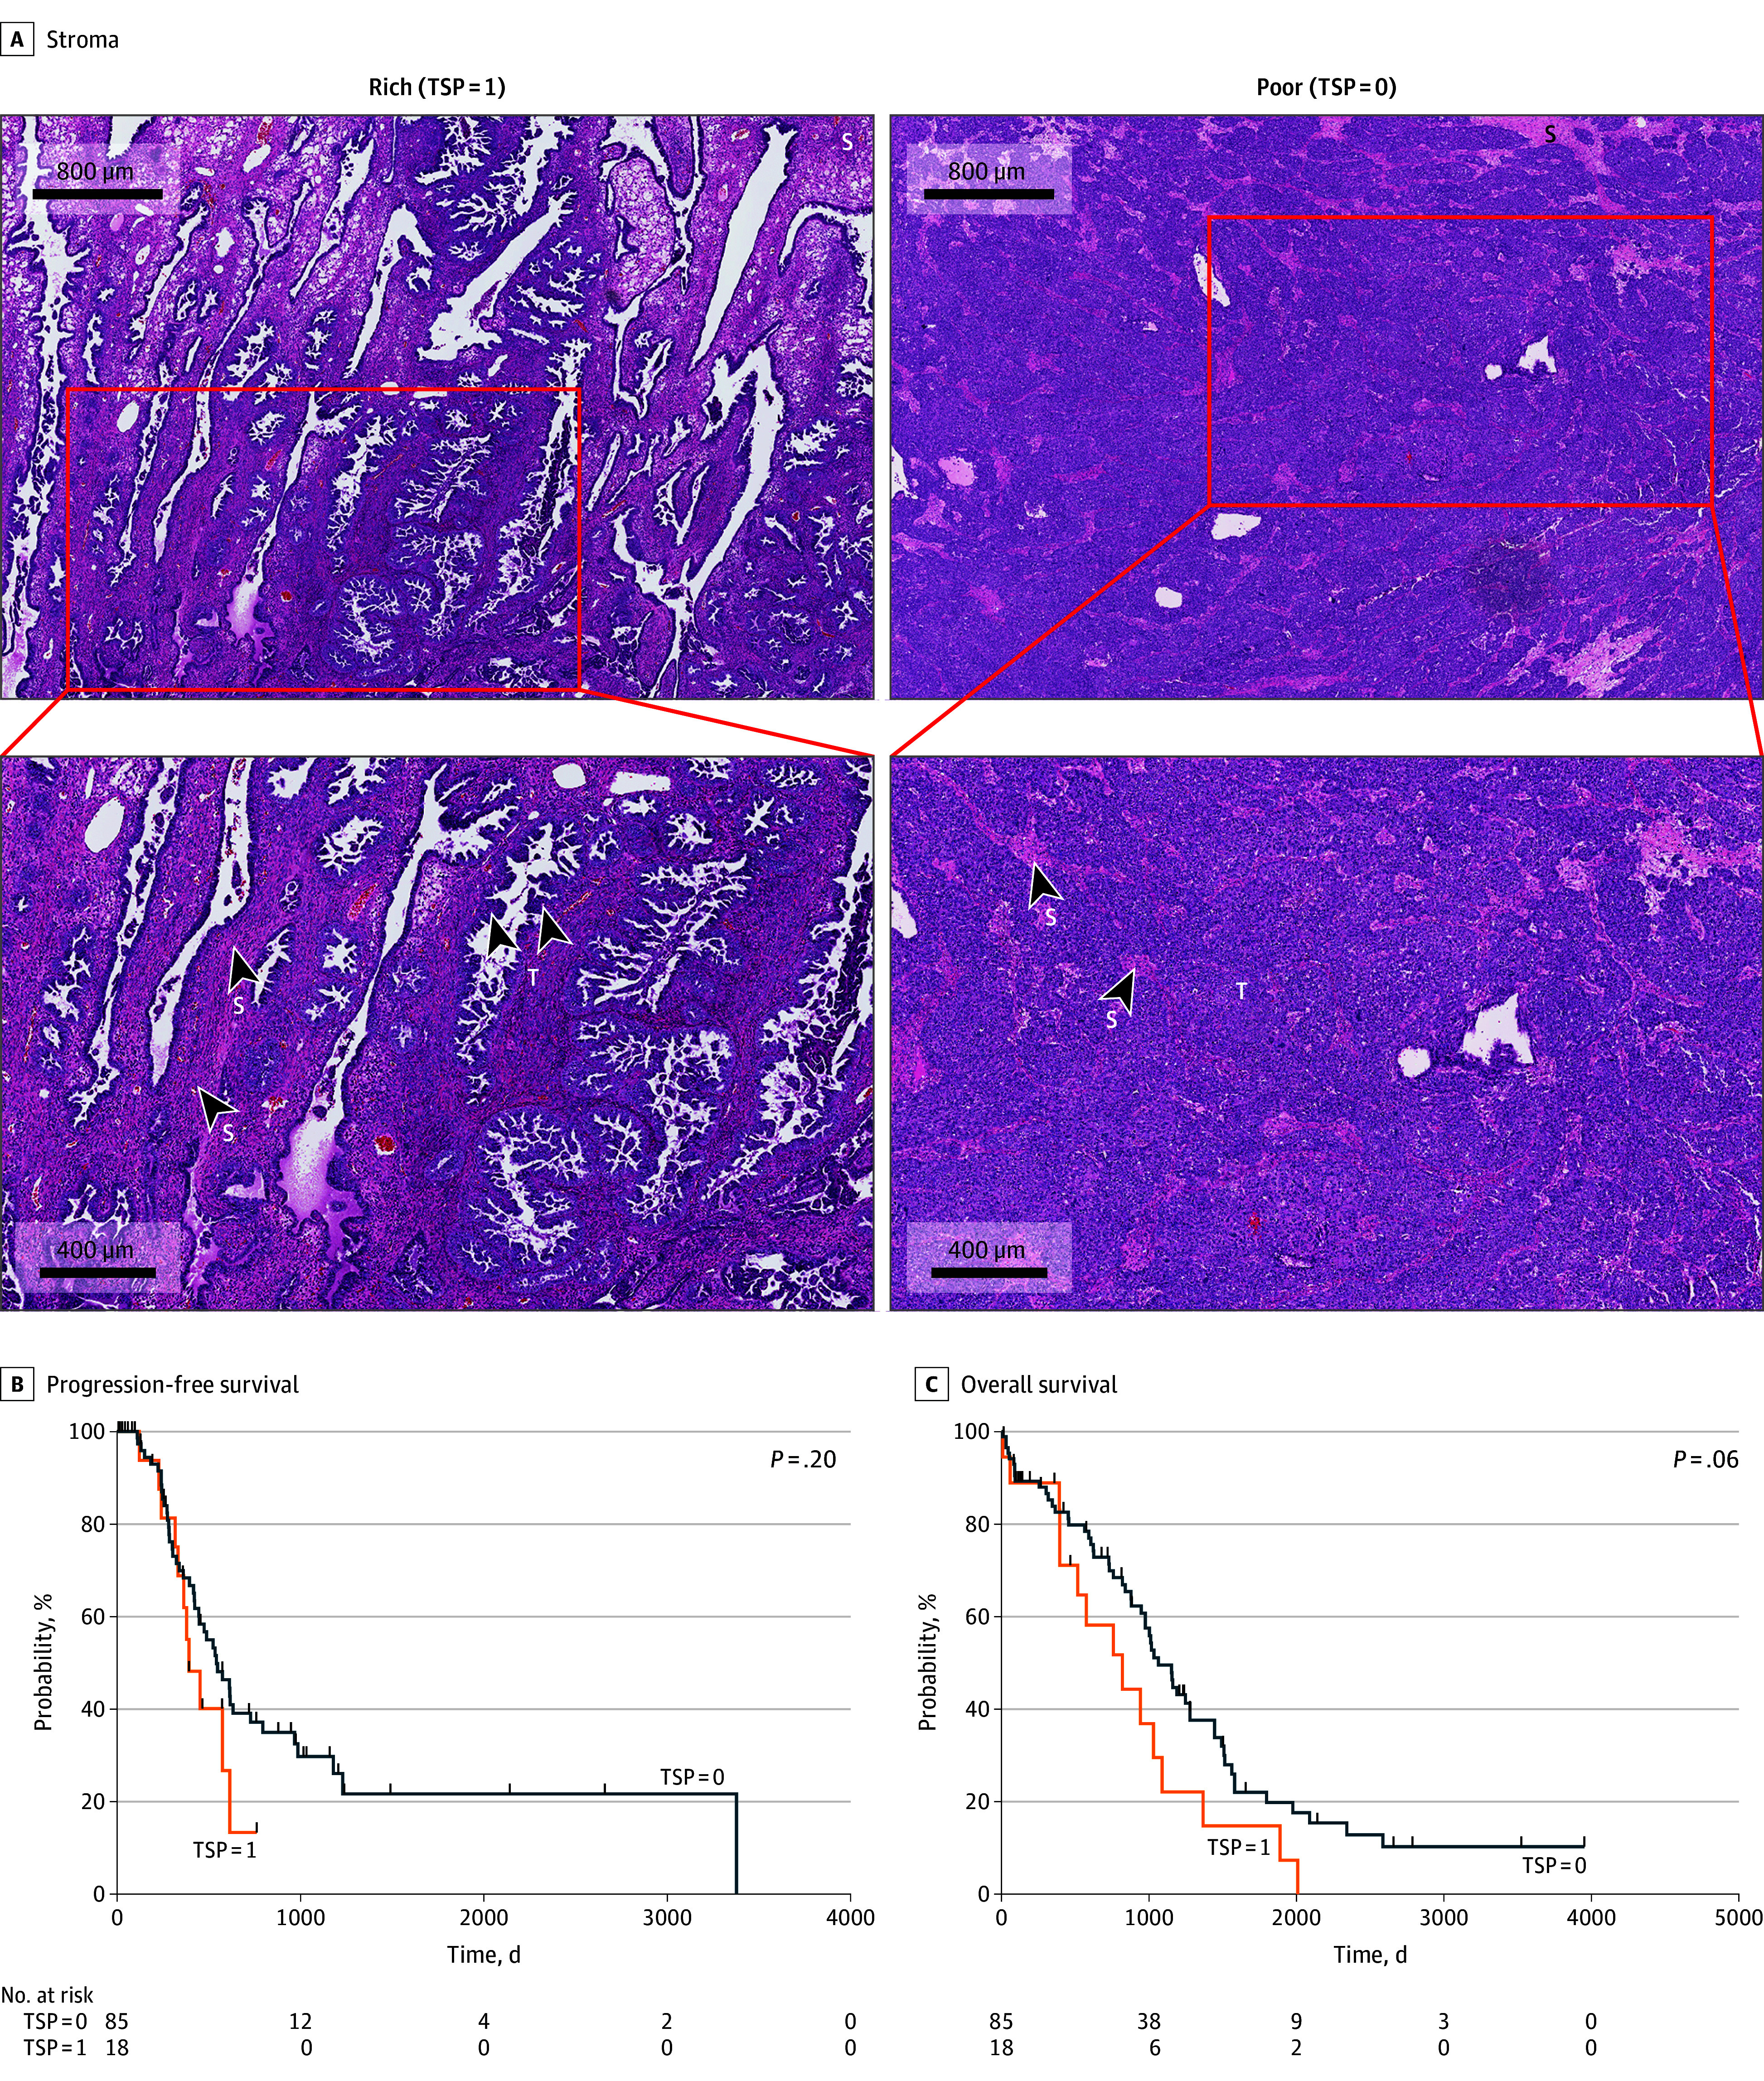
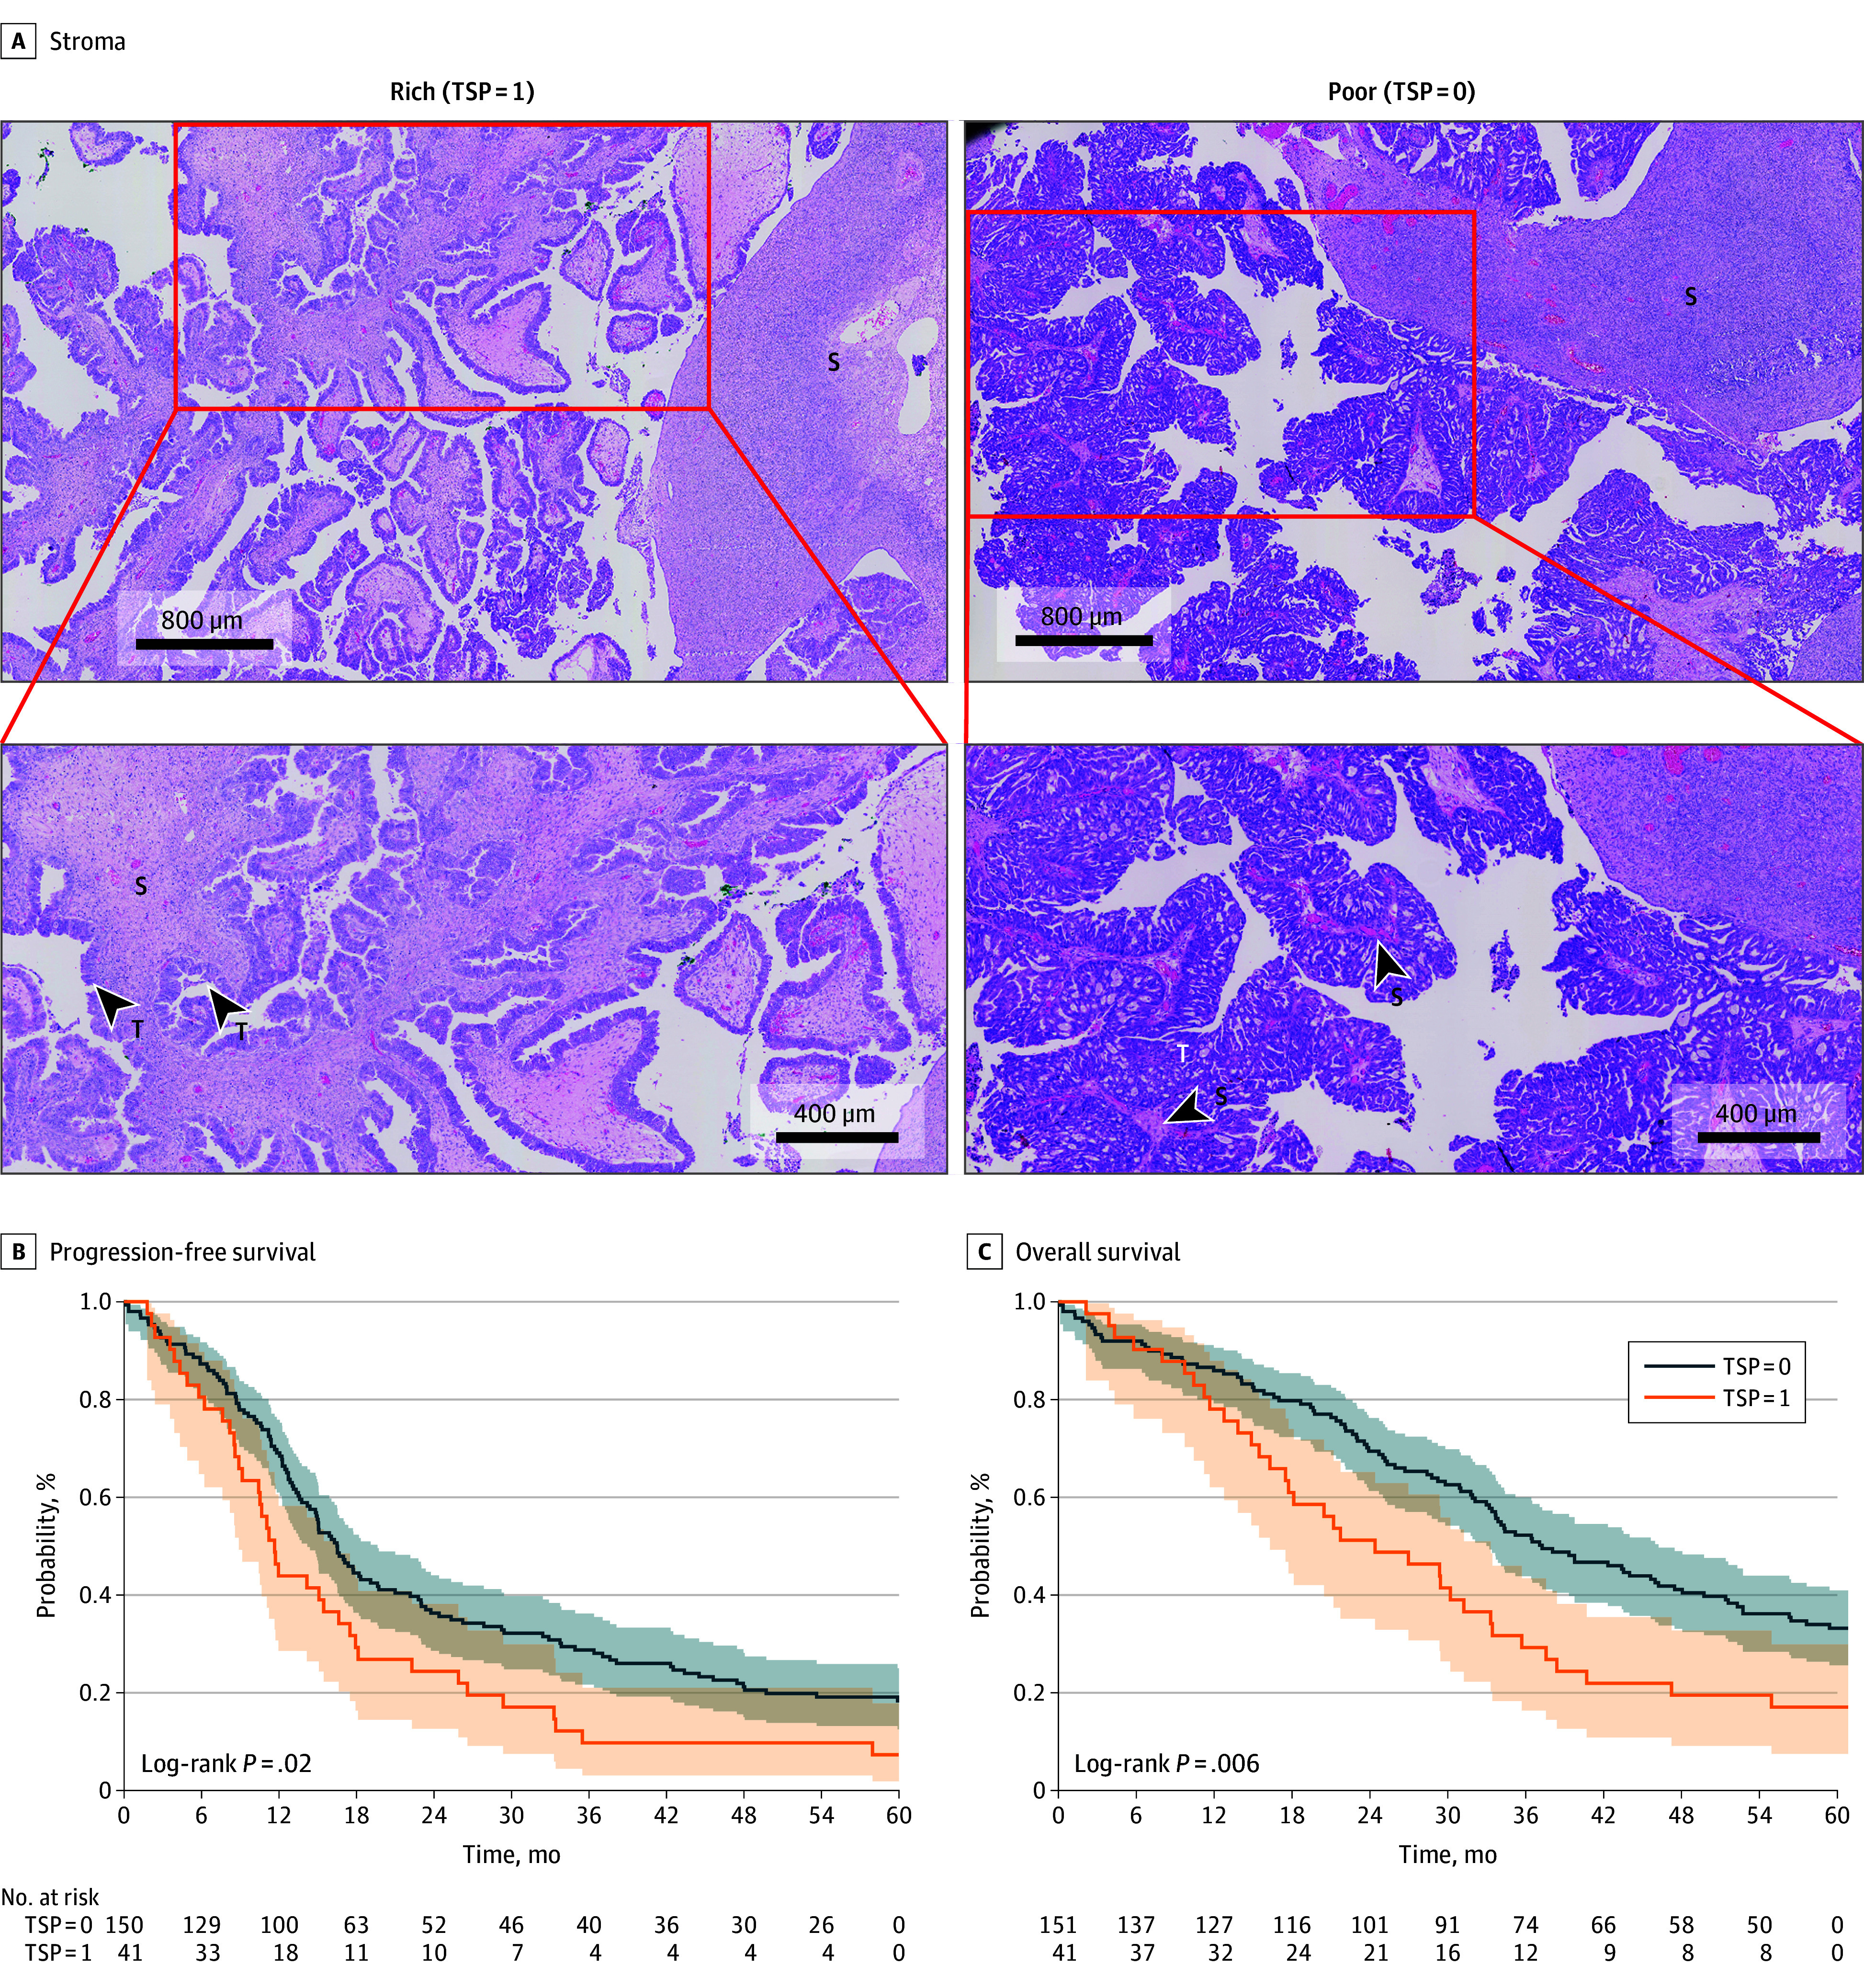
Main outcomes and measures: Principal outcome measures were the ability of TSP to predict platinum chemoresistance, PFS, and OS. Using hematoxylin and eosin-stained slides from the Tübingen cohort (used for routine diagnostic assessment from surgical specimens) as well as tissue microarrays, representative sections of tumors for scoring of TSP were identified using previously evaluated cutoffs of 50% stroma or greater (high TSP) and less than 50% stroma (low TSP). Digitized slides from the TCGA Cohort were analyzed and scored in a similar fashion. Kaplan-Meier time-to-event functions were fit to estimate PFS and OS.

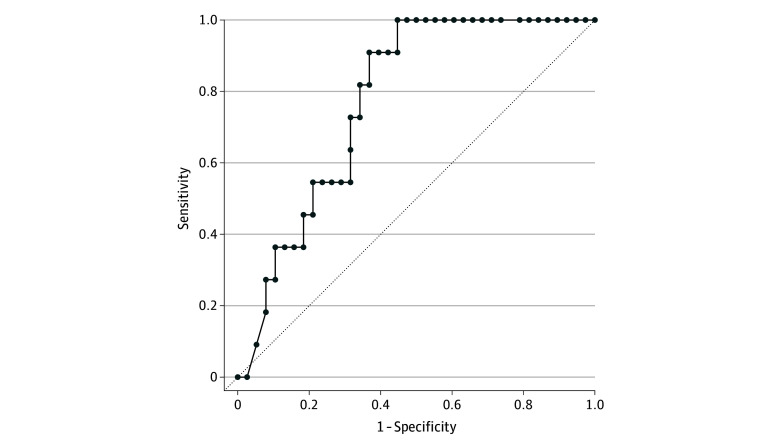
Results: The study included 103 patients (mean [SD] age, 61.6 [11.1] years) from the TCGA cohort and 192 patients (mean [SD] age at diagnosis, 63.7 [11.1] years) from the Tübingen cohort. In the TCGA cohort, there was no significant association of TSP levels with chemoresistance, PFS, or OS. However, in the Tübingen cohort, high TSP was associated with significantly shorter PFS (HR, 1.586; 95% CI, 1.093-2.302; P = .02) and OS (hazard ratio [HR], 1.867; 1.249-2.789; P = .002). Patients with chemoresistant tumors were twice as likely to have high TSP as compared to patients with chemosensitive tumors (HR, 2.861; 95% CI, 1.256-6.515; P = .01). In tissue microarrays from 185 patients from the Tübingen cohort, high TSP was again associated with significantly shorter PFS (HR, 1.675; 95% CI, 1.012-2.772 P = .04) and OS (HR, 2.491; 95% CI, 1.585-3.912; P < .001).

Conclusions and relevance: In this prognostic study, TSP was a consistent and reproducible marker of clinical outcome measures of HGSC, including PFS, OS, and platinum chemoresistance. Accurate and cost-effective predictive biomarkers of platinum chemotherapy resistance are needed to identify patients most likely to benefit from standard treatments, and TSP can easily be implemented and integrated into prospective clinical trial design and adapted to identify patients who are least likely to benefit long-term from conventional platinum-based cytotoxic chemotherapy treatment at the time of initial diagnosis.


Conflict of interest statement

Conflict of Interest Disclosures: Dr Lou reported receiving grants from the American Association for Cancer Research (grant No. 1-60-62-LOU), and the University of Minnesota Clinical Center for the Study of Pancreatic Disease, which is part of The Chronic Pancreatitis Diabetes Pancreatic Cancer research consortium funded by the National Institute of Diabetes and Digestive and Kidney Diseases (grant No. 5U01DK126300-03); honorarium from GlaxoSmithKline, Novocure, Antidote Education, Daiichi-Sankyo, and Boston Scientific; equipment for laboratory research from Novocure; personal fees from Elsevier Publishing and John Hopkins Press; serving as a consultant for Nomocan Pharmaceuticals (no financial compensation); serving as a scientific advisory board member for Minnetronix (no financial compensation); serving as the institutional principal investigator for clinical trials sponsored by Celgene, Novocure, Intima Bioscience, and the National Cancer Institute; and having a University of Minnesota membership in the Caris Life Sciences Precision Oncology Alliance outside the submitted work. Dr Svedbom reported receiving personal fees from Abbvie, Janssen, Bristol Myers Squibb, Union Chimique Belge, Novartis, ICON, and Eli Lilly outside the submitted work. Dr Kommoss reported receiving personal fees from Merck Sharp and Dohme, Eisai, AstraZeneca, Roche, and GSK; and grants from GSK, outside the submitted work. No other disclosures were reported.

Figures

Figure 1.
Figure 1.. Association of Tumor-Stroma Proportion (TSP) and Clinical Outcomes in Patients With Ovarian Cancer in the The Cancer Genome Atlas (TCGA) Cohort
The figure shows representative images (A) of stroma-rich (high TSP [TSP = 1]) and stroma-poor (low TSP [TSP = 0]) specimens in the TCGA cohort. S indicates the stromal component within the tumor; T, cancerous cells within the specimen. The Kaplan-Meier curves show progression-free survival (B) in patients with low TSP vs high TSP (HR, 1.661; 95% CI, 0.766-3.603) and overall survival (C) in patients with low TSP vs high TSP (HR 1.906; 95% CI, 0.962-3.776 95%).
Figure 2.
Figure 2.. Association of Tumor-Stroma Proportion (TSP) and Clinical Outcomes in Patients With Ovarian Cancer in the Tübingen Cohort
The figure shows representative images (A) of stroma-rich (high TSP [TSP = 1]) specimens and stroma-poor (low TSP [TSP = 0]) specimens in the Tübingen cohort. S indicates the stromal component within the tumor; T, cancerous cells within the specimen. The Kaplan-Meier curves show progression-free survival (B) in patients with low TSP vs high TSP (HR, 1.573; 95% CI, 1.090-2.270; P = .02) and overall survival (C) in patients with low TSP vs high TSP (HR, 1.726; 95% CI, 1.166-2.557; P = .006). The shading represents the 95% CIs.
Figure 3.
Figure 3.. Stroma-Rich Tumors as Predictors of Platinum Resistance in the Tübingen Cohort
Receiver operating characteristic (ROC) curve of stroma-rich tumors (TSP = 1) and risk factors (metastasis, residual disease, and lymph node spread) indicating the ability of TSP = 1 to differentiate chemoresistant and chemosensitive patients. The diagonal line indicates no predictive value. The area under the ROC curve is 0.7644 (95% CI, 0.639-0.889).

Similar articles

Cited by

References

    1. Drakes ML, Mehrotra S, Aldulescu M, et al. . Stratification of ovarian tumor pathology by expression of programmed cell death-1 (PD-1) and PD-ligand- 1 (PD-L1) in ovarian cancer. J Ovarian Res. 2018;11(1):43. doi:10.1186/s13048-018-0414-z - DOI - PMC - PubMed
    1. Drakes ML, Stiff PJ. Regulation of ovarian cancer prognosis by immune cells in the tumor microenvironment. Cancers (Basel). 2018;10(9):302. doi:10.3390/cancers10090302 - DOI - PMC - PubMed
    1. Kenny PA, Lee GY, Bissell MJ. Targeting the tumor microenvironment. Front Biosci. 2007;12:3468-3474. doi:10.2741/2327 - DOI - PMC - PubMed
    1. Zhang Q, Ding J, Wang Y, He L, Xue F. Tumor microenvironment manipulates chemoresistance in ovarian cancer (Review). Oncol Rep. 2022;47(5):102. doi:10.3892/or.2022.8313 - DOI - PubMed
    1. Whiteside TL. The tumor microenvironment and its role in promoting tumor growth. Oncogene. 2008;27(45):5904-5912. doi:10.1038/onc.2008.271 - DOI - PMC - PubMed

Publication types