. 2024 Feb 22;115(1):e2024007.
doi: 10.23749/mdl.v115i1.14690.

Determinants of COVID-19 Infection Among Employees of an Italian Financial Institution

Affiliations

Determinants of COVID-19 Infection Among Employees of an Italian Financial Institution

Roberta De Vito et al. Med Lav. .

Abstract

Background: Understanding the trend of the severe acute respiratory syndrome Coronavirus 2 (SARS-CoV-2) is becoming crucial. Previous studies focused on predicting COVID-19 trends, but few papers have considered models for disease estimation and progression based on large real-world data.

Methods: We used de-identified data from 60,938 employees of a major financial institution in Italy with daily COVID-19 status information between 31 March 2020 and 31 August 2021. We consider six statuses: (i) concluded case, (ii) confirmed case, (iii) close contact, (iv) possible-probable contact, (v) possible contact, and (vi) no-COVID-19 or infection. We conducted a logistic regression to assess the odds ratio (OR) of transition to confirmed COVID-19 case at each time point. We also fitted a general model for disease progression via the multi-state transition probability model at each time point, with lags of 7 and 15 days.

Results: Employment in a branch versus in a central office was the strongest predictor of case or contact status, while no association was detected with gender or age. The geographic prevalence of possible-probable contacts and close contacts was predictive of the subsequent risk of confirmed cases. The status with the highest probability of becoming a confirmed case was concluded case (12%) in April 2020, possible-probable contact (16%) in November 2020, and close contact (4%) in August 2021. The model based on transition probabilities predicted well the rate of confirmed cases observed 7 or 15 days later.

Conclusion: Data from industry-based surveillance systems may effectively predict the risk of subsequent infection.


Conflict of interest statement

The authors declare no conflict of interest.

Figures

Supplementary Figure 1.
Comparison of the 7 days rolling mean infection rate of new confirmed cases between Italian population and bank (internal) population standardized over Italian population.
Supplementary Figure 2.
Z-scores of the correlation between prevalence of possible contact, possible-probable contact, and close contact between 31 March 2020 and 31 August 2021 and prevalence of confirmed cases on 31 August 2021. Unit of observation: province.
Supplementary Figure 3.
Geographic analysis of determinants of prevalence of infections and contacts. The dashed grey lines represent the three lock-down strategies adopted in Italy.
Supplementary Figure 4.a)
Probability of being confirmed for males and female for all the statuses, lag of 7 days, observation period 03/2020 – 09/2021. Supplementary Figure 4.b) Probability of being confirmed for males and female for all the statuses excluding the confirmed status itself, lag of 7 days, observation period 03/2020 – 09/2021.
Supplementary Figure 5.
Distribution of the confirmed cases (red line) and the estimated confirmed cases with prediction of 15 days (blue line), for a lag of 15 days. The grey intervals represent the confidence intervals for our estimates. The vertical dashed grey line represents the two lock-down strategies adopted in Italy.
Supplementary Figure 6.
Probability of transition from to confirmed case with 7-day lag, by month. All statuses (A), and excluding confirmed cases (B).
Supplementary Figure 7.
Probability of transition from to confirmed case with 7-day lag, by month and type of employment. All statuses (A), and excluding confirmed cases (B).
Figure 1.
Figure 1.
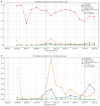
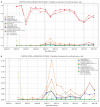
Odds ratio of confirmed case (A) close contact (B) and possible-probable contact (C) in branch workers vs central office workers, by date. Vertical lines indicate dates of lock-down strategies in Italy.
Figure 1.
Figure 1.
Odds ratio of confirmed case (A) close contact (B) and possible-probable contact (C) in branch workers vs central office workers, by date. Vertical lines indicate dates of lock-down strategies in Italy.
Figure 2.
Figure 2.
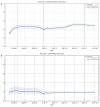
Number of confirmed cases (red line, 15 day intervals) and predicted number with 7-day lag.

References

    1. Boccia S, Ricciardi W, Ioannidis JPA. What Other Countries Can Learn from Italy during the COVID-19 Pandemic. JAMA Intern Med. 2021;180(7):927–928. Doi: 10.1001/jamainternmed.2020.1447. - PubMed
    1. Worldometer – COVID-19 CORONAVIRUS PANDEMIC. Available online: https://www.worldometers.info/coronavirus/
    1. Dowd JB, Andriano L, Brazel DM, et al. Demographic science aids in understanding the spread and fatality rates of COVID-19. Proc Natl Acad Sci USA. 2020;117(18):9696–9698. Doi: 10.1073/pnas.2004911117/-/DCSupplemental. - PMC - PubMed
    1. Aabed K, Lashin MMA. An analytical study of the factors that influence COVID-19 spread. Saudi J Biol Sci. 2021;28(2):1177–1195. Doi: 10.1016/j.sjbs.2020.11.067. - PMC - PubMed
    1. Lowen AC, Steel J. Roles of Humidity and Temperature in Shaping Influenza Seasonality. J Virol. 2014;88(14):7692–5. Doi: 10.1128/jvi.03544-13. - PMC - PubMed