. 2024 May 1;33(5):681-693.
doi: 10.1158/1055-9965.EPI-23-1293.

Serum Lipidome Profiling Reveals a Distinct Signature of Ovarian Cancer in Korean Women

Affiliations

Serum Lipidome Profiling Reveals a Distinct Signature of Ovarian Cancer in Korean Women

Samyukta Sah et al. Cancer Epidemiol Biomarkers Prev. .

Abstract

Background: Distinguishing ovarian cancer from other gynecological malignancies is crucial for patient survival yet hindered by non-specific symptoms and limited understanding of ovarian cancer pathogenesis. Accumulating evidence suggests a link between ovarian cancer and deregulated lipid metabolism. Most studies have small sample sizes, especially for early-stage cases, and lack racial/ethnic diversity, necessitating more inclusive research for improved ovarian cancer diagnosis and prevention.

Methods: Here, we profiled the serum lipidome of 208 ovarian cancer, including 93 early-stage patients with ovarian cancer and 117 nonovarian cancer (other gynecological malignancies) patients of Korean descent. Serum samples were analyzed with a high-coverage liquid chromatography high-resolution mass spectrometry platform, and lipidome alterations were investigated via statistical and machine learning (ML) approaches.

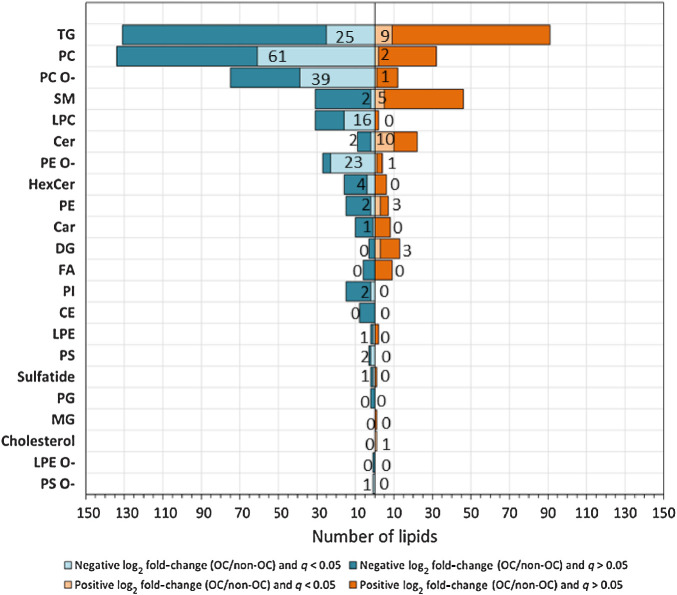
Results: We found that lipidome alterations unique to ovarian cancer were present in Korean women as early as when the cancer is localized, and those changes increase in magnitude as the diseases progresses. Analysis of relative lipid abundances revealed specific patterns for various lipid classes, with most classes showing decreased abundance in ovarian cancer in comparison with other gynecological diseases. ML methods selected a panel of 17 lipids that discriminated ovarian cancer from nonovarian cancer cases with an AUC value of 0.85 for an independent test set.

Conclusions: This study provides a systemic analysis of lipidome alterations in human ovarian cancer, specifically in Korean women.

Impact: Here, we show the potential of circulating lipids in distinguishing ovarian cancer from nonovarian cancer conditions.


Figures

Figure 1. Study design overview, UHPLC-MS workflow, and machine learning pipeline. A, Serum samples from patients with ovarian cancer (n = 208) and nonovarian cancer (n = 117) obtained from Gangnam Severance and Dongsan Hospitals were studied. B, Serum sample preparation workflow before UHPLC-MS analysis. C, UHPLC-MS data collection in both positive and negative ion modes. Data were processed with Compound Discoverer v.3.3 (Thermo Fisher Scientific) and features annotated using in-house MS-MS libraries. D, Machine learning workflow for selecting the most relevant lipids to differentiate ovarian and nonovarian cancer conditions. For the lipid class analysis of ovarian cancer versus other gynecological malignancies, selection of the best differential lipids was performed using random forests feature selection. Lipids with a Gini index greater than the mean of all Gini index values were selected. For the biomarker panel selection, selection of a 10-lipid panel for differentiating ovarian and nonovarian cancer serum samples was performed using random forests algorithm. Lipids with a Gini index of >0.01 were selected as the best differential features in the training set. Five different machine learning models—random forests, logistic regression, k-Nearest Neighbor (KNN), support vector machines (SVM) and voting classifier, which is an ensemble of the four listed classifiers—were used for classification. SMOTE, Synthetic Minority Oversampling Technique. (Created with BioRender.com.)
Figure 1.
Study design overview, UHPLC-MS workflow, and machine learning pipeline. A, Serum samples from patients with ovarian cancer (n = 208) and nonovarian cancer (n = 117) obtained from Gangnam Severance and Dongsan Hospitals were studied. B, Serum sample preparation workflow before UHPLC-MS analysis. C, UHPLC-MS data collection in both positive and negative ion modes. Data were processed with Compound Discoverer v.3.3 (Thermo Fisher Scientific) and features annotated using in-house MS-MS libraries. D, Machine learning workflow for selecting the most relevant lipids to differentiate ovarian and nonovarian cancer conditions. For the lipid class analysis of ovarian cancer versus other gynecological malignancies, selection of the best differential lipids was performed using random forests feature selection. Lipids with a Gini index greater than the mean of all Gini index values were selected. For the biomarker panel selection, selection of a 10-lipid panel for differentiating ovarian and nonovarian cancer serum samples was performed using random forests algorithm. Lipids with a Gini index of >0.01 were selected as the best differential features in the training set. Five different machine learning models—random forests, logistic regression, k-Nearest Neighbor (KNN), support vector machines (SVM) and voting classifier, which is an ensemble of the four listed classifiers—were used for classification. SMOTE, Synthetic Minority Oversampling Technique. (Created with BioRender.com.)
Figure 2. Annotated lipids, grouped by lipid class, showing number of lipids with positive and negative fold changes between ovarian and nonovarian cancer groups. Fold changes were calculated as the base 2 logarithm of the average lipid abundance ratios for ovarian cancer versus nonovarian cancer. A positive fold-change value indicates higher levels in ovarian cancer samples. Negative values indicate lower levels in ovarian cancer samples. The number of lipids with negative fold-change values and positive fold-change values for each lipid class are shown as blue and orange bars, respectively. The number of statistically significant lipids (FDR corrected P <0.05) with negative and positive fold-change values are labeled as light blue and orange bars, respectively. TG, Triacylglycerols; PC, Phosphatidylcholines; PC O-, Ether phosphatidylcholines; SM, Sphingomyelins; LPC, Lysophosphatidylcholines; Cer, Ceramides; PE O-, Ether phosphatidylethanolamines; Car, Carnitines; HexCer, Hexosylceramides; PE, Phosphatidylethanolamines; DG, Diacylglycerols; FA, Fatty acids; PI, Phosphatidylinositols; CE, Cholesterol esters; LPE, Lysophosphatidylethanolamines; PS, Phosphatidylserines; PG, Phosphatidylglycerols; MG, Monoradylglycerols; LPE O-, Ether Lysophosphatidylethanolamines; PS O-, Ether phosphatidylserines.
Figure 2.
Annotated lipids, grouped by lipid class, showing number of lipids with positive and negative fold changes between ovarian and nonovarian cancer groups. Fold changes were calculated as the base 2 logarithm of the average lipid abundance ratios for ovarian cancer versus nonovarian cancer. A positive fold-change value indicates higher levels in ovarian cancer samples. Negative values indicate lower levels in ovarian cancer samples. The number of lipids with negative fold-change values and positive fold-change values for each lipid class are shown as blue and orange bars, respectively. The number of statistically significant lipids (FDR corrected P <0.05) with negative and positive fold-change values are labeled as light blue and orange bars, respectively. TG, Triacylglycerols; PC, Phosphatidylcholines; PC O-, Ether phosphatidylcholines; SM, Sphingomyelins; LPC, Lysophosphatidylcholines; Cer, Ceramides; PE O-, Ether phosphatidylethanolamines; Car, Carnitines; HexCer, Hexosylceramides; PE, Phosphatidylethanolamines; DG, Diacylglycerols; FA, Fatty acids; PI, Phosphatidylinositols; CE, Cholesterol esters; LPE, Lysophosphatidylethanolamines; PS, Phosphatidylserines; PG, Phosphatidylglycerols; MG, Monoradylglycerols; LPE O-, Ether Lysophosphatidylethanolamines; PS O-, Ether phosphatidylserines.
Figure 3. Serum lipidome analysis of ovarian and nonovarian cancer samples using only the abundances of select lipids. Lipids were selected with the following feature selection workflow: One of the two highly correlated lipids was filtered out using a Pearson correlation coefficient cutoff value of 0.85. Next, lipids with P values lower than 0.05 were selected, followed by random forest feature selection in which lipids with a Gini index greater than the mean of all Gini indices were selected. A, PCA score plot showing clustering of ovarian and nonovarian cancer samples using the selected lipids. B, o-PLS-DA score plot for the same dataset. Ovarian cancer samples are depicted as green squares and nonovarian cancer samples are shown with gray diamonds. C, Fold changes for the selected lipids. Fold changes were calculated as the base 2 logarithm of the average lipid abundance ratios for ovarian cancer versus nonovarian cancer. A positive fold-change value indicates higher levels in ovarian cancer samples. Negative values indicate lower levels in ovarian cancer samples. TG, Triacylglycerols; PC, Phosphatidylcholines; PC O-, Ether phosphatidylcholines; SM, Sphingomyelins; LPC, Lysophosphatidylcholines; Cer, Ceramides; PE O-, Ether phosphatidylethanolamines; Car, Carnitines; HexCer, Hexosylceramides; PE, Phosphatidylethanolamines; DG, Diacylglycerols; FA, Fatty acids; PI, Phosphatidylinositols; CE, Cholesterol esters; LPE, Lysophosphatidylethanolamines; PS, Phosphatidylserines; PG, Phosphatidylglycerols; MG, Monoradylglycerols; LPE O-, Ether Lysophosphatidylethanolamines; PS O-, Ether phosphatidylserines.
Figure 3.
Serum lipidome analysis of ovarian and nonovarian cancer samples using only the abundances of select lipids. Lipids were selected with the following feature selection workflow: One of the two highly correlated lipids was filtered out using a Pearson correlation coefficient cutoff value of 0.85. Next, lipids with P values lower than 0.05 were selected, followed by random forest feature selection in which lipids with a Gini index greater than the mean of all Gini indices were selected. A, PCA score plot showing clustering of ovarian and nonovarian cancer samples using the selected lipids. B, o-PLS-DA score plot for the same dataset. Ovarian cancer samples are depicted as green squares and nonovarian cancer samples are shown with gray diamonds. C, Fold changes for the selected lipids. Fold changes were calculated as the base 2 logarithm of the average lipid abundance ratios for ovarian cancer versus nonovarian cancer. A positive fold-change value indicates higher levels in ovarian cancer samples. Negative values indicate lower levels in ovarian cancer samples. TG, Triacylglycerols; PC, Phosphatidylcholines; PC O-, Ether phosphatidylcholines; SM, Sphingomyelins; LPC, Lysophosphatidylcholines; Cer, Ceramides; PE O-, Ether phosphatidylethanolamines; Car, Carnitines; HexCer, Hexosylceramides; PE, Phosphatidylethanolamines; DG, Diacylglycerols; FA, Fatty acids; PI, Phosphatidylinositols; CE, Cholesterol esters; LPE, Lysophosphatidylethanolamines; PS, Phosphatidylserines; PG, Phosphatidylglycerols; MG, Monoradylglycerols; LPE O-, Ether Lysophosphatidylethanolamines; PS O-, Ether phosphatidylserines.
Figure 4. Serum lipidome differences in early-stage (I and II) or advanced-stage (III and IV) patients with ovarian versus nonovarian cancers using only select lipids. Most relevant lipid species for differentiating early-stage ovarian cancer from nonovarian cancer, and advanced-stage ovarian cancer from nonovarian cancer were selected using random forests feature selection. Volcano plots showing lipidome differences with 120 best discriminating lipids selected for early-stage ovarian cancer versus nonovarian cancer (A) and 102 best discriminating lipids selected for advanced stage ovarian cancer versus nonovarian cancer samples (B). Lipid species are color-coded by lipid class, as indicated on the plots. Fold changes were calculated as the base 2 logarithm of the average lipid abundance ratios for ovarian cancer versus nonovarian cancer. A positive fold-change value indicates higher levels in ovarian cancer samples. Negative values indicate lower levels in ovarian cancer samples. P values were calculated using the Welch's t test. Bar graphs showing number of lipids selected, grouped by lipid class, for early-stage ovarian cancer versus nonovarian cancer (C) and advanced-stage ovarian cancer versus nonovarian cancer (D). TG, Triacylglycerols; PC, Phosphatidylcholines; PC O-, Ether phosphatidylcholines; SM, Sphingomyelins; LPC, Lysophosphatidylcholines; Cer, Ceramides; PE O-, Ether phosphatidylethanolamines; Car, Carnitines; HexCer, Hexosylceramides; PE, Phosphatidylethanolamines; DG, Diacylglycerols; FA, Fatty acids; PI, Phosphatidylinositols; CE, Cholesterol esters; LPE, Lysophosphatidylethanolamines; PS, Phosphatidylserines; PG, Phosphatidylglycerols; MG, Monoradylglycerols; LPE O-, Ether Lysophosphatidylethanolamines; PS O-, Ether phosphatidylserines; CHL, cholesterol.
Figure 4.
Serum lipidome differences in early-stage (I and II) or advanced-stage (III and IV) patients with ovarian versus nonovarian cancers using only select lipids. Most relevant lipid species for differentiating early-stage ovarian cancer from nonovarian cancer, and advanced-stage ovarian cancer from nonovarian cancer were selected using random forests feature selection. Volcano plots showing lipidome differences with 120 best discriminating lipids selected for early-stage ovarian cancer versus nonovarian cancer (A) and 102 best discriminating lipids selected for advanced stage ovarian cancer versus nonovarian cancer samples (B). Lipid species are color-coded by lipid class, as indicated on the plots. Fold changes were calculated as the base 2 logarithm of the average lipid abundance ratios for ovarian cancer versus nonovarian cancer. A positive fold-change value indicates higher levels in ovarian cancer samples. Negative values indicate lower levels in ovarian cancer samples. P values were calculated using the Welch's t test. Bar graphs showing number of lipids selected, grouped by lipid class, for early-stage ovarian cancer versus nonovarian cancer (C) and advanced-stage ovarian cancer versus nonovarian cancer (D). TG, Triacylglycerols; PC, Phosphatidylcholines; PC O-, Ether phosphatidylcholines; SM, Sphingomyelins; LPC, Lysophosphatidylcholines; Cer, Ceramides; PE O-, Ether phosphatidylethanolamines; Car, Carnitines; HexCer, Hexosylceramides; PE, Phosphatidylethanolamines; DG, Diacylglycerols; FA, Fatty acids; PI, Phosphatidylinositols; CE, Cholesterol esters; LPE, Lysophosphatidylethanolamines; PS, Phosphatidylserines; PG, Phosphatidylglycerols; MG, Monoradylglycerols; LPE O-, Ether Lysophosphatidylethanolamines; PS O-, Ether phosphatidylserines; CHL, cholesterol.

Similar articles

Cited by

References

    1. Kim J, Park EY, Kim O, Schilder JM, Coffey DM, Cho CH, et al. . Cell origins of high-grade serous ovarian cancer. Cancers 2018;10:433. - PMC - PubMed
    1. Atallah GA, Abd Aziz NH, Teik CK, Shafiee MN, Kampan NC. New predictive biomarkers for ovarian cancer. Diagnostics 2021;11:465. - PMC - PubMed
    1. Montagnana M, Benati M, Danese E. Circulating biomarkers in epithelial ovarian cancer diagnosis: from present to future perspective. Ann Transl Med 2017;5:276. - PMC - PubMed
    1. Mercado C, Zingmond D, Karlan BY, Sekaris E, Gross J, Maggard-Gibbons M, et al. . Quality of care in advanced ovarian cancer: the importance of provider specialty. Gynecol Oncol 2010;117:18–22. - PubMed
    1. Kobayashi E, Ueda Y, Matsuzaki S, Yokoyama T, Kimura T, Yoshino K, et al. . Biomarkers for screening, diagnosis, and monitoring of ovarian cancer. Cancer Epidemiol Biomarkers Prev 2012;21:1902–12. - PubMed

Publication types