. 2024 Mar 19;98(3):e0148523.
doi: 10.1128/jvi.01485-23. Epub 2024 Feb 27.

Filamin B restricts vaccinia virus spread and is targeted by vaccinia virus protein C4

Affiliations

Filamin B restricts vaccinia virus spread and is targeted by vaccinia virus protein C4

Iliana Georgana et al. J Virol. .

Abstract

Vaccinia virus (VACV) is a large DNA virus that encodes scores of proteins that modulate the host immune response. VACV protein C4 is one such immunomodulator known to inhibit the activation of both the NF-κB signaling cascade and the DNA-PK-mediated DNA sensing pathway. Here, we show that the N-terminal region of C4, which neither inhibits NF-κB nor mediates interaction with DNA-PK, still contributes to virus virulence. Furthermore, this domain interacts directly and with high affinity to the C-terminal domain of filamin B (FLNB). FLNB is a large actin-binding protein that stabilizes the F-actin network and is implicated in other cellular processes. Deletion of FLNB from cells results in larger VACV plaques and increased infectious viral yield, indicating that FLNB restricts VACV spread. These data demonstrate that C4 has a new function that contributes to virulence and engages the cytoskeleton. Furthermore, we show that the cytoskeleton performs further previously uncharacterized functions during VACV infection.

Importance: Vaccinia virus (VACV), the vaccine against smallpox and monkeypox, encodes many proteins to counteract the host immune response. Investigating these proteins provides insights into viral immune evasion mechanisms and thereby indicates how to engineer safer and more immunogenic VACV-based vaccines. Here, we report that the N-terminal domain of VACV protein C4 interacts directly with the cytoskeletal protein filamin B (FLNB), and this domain of C4 contributes to virus virulence. Furthermore, VACV replicates and spreads better in cells lacking FLNB, thus demonstrating that FLNB has antiviral activity. VACV utilizes the cytoskeleton for movement within and between cells; however, previous studies show no involvement of C4 in VACV replication or spread. Thus, C4 associates with FLNB for a different reason, suggesting that the cytoskeleton has further uncharacterized roles during virus infection.

Keywords: DNA sensing; NF-κB; cytoskeleton; filamin B; protein C4; vaccinia virus; virus restriction factor; virus virulence; virus-host interactions.


Conflict of interest statement

The authors declare no conflict of interest.

Figures
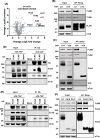
Fig 1
Fig 1
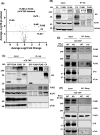
C4 interacts with FLNs via the C4 N-terminal domain. (A) HEK293T cells were transfected in triplicate with TAP-tagged C4 or EV for 16 h and then infected with vΔC16/ΔC4 at a multiplicity of infection (MOI) of 5 for 7 h. Cells were lysed and subjected to AP via the strep tag. The AP samples were then analyzed by TMT proteomics. Log2 ratios of the mean of three TAP-C4 pull-downs (x-axis) are plotted versus −Log10 of the P-values (y-axis) derived from a Student’s t-test. The threshold of P-value = 0.05 is indicated with the blue dashed line. C4 is shown with a black dot, FLNA/B/C are indicated in red dots, and the known C4-interacting partners Ku70/80 are shown on purple dots. Low significance hits PRDX1 and ANKHD1 are indicated as gray dots. (B) HEK293T cells were transfected for 24 h with plasmids encoding TAP-tagged C4 or C16. Cells were lysed and tagged proteins were purified as above, separated by NuPAGE and analyzed by immunoblotting with the indicated antibodies. (C) HeLa cells were infected with vC4-TAP or vC6-TAP at an MOI of 10 for 6 h. Cells were then lysed and subjected to AP. Proteins were separated by NuPAGE and analyzed by immunoblotting. (D and E) HEK293T cells were transfected for 24 h with plasmids encoding HA-tagged FLNA, FLNB, or β-spectrin. Then, the cells were infected with (D) vC4-TAP or (E) vC6-TAP at an MOI of 2 for 16 h. Cells were then lysed, and HA-tagged proteins were immunoprecipitated (IP) and proteins were immunoblotted with the indicated antibodies. (F) HEK293T cells were transfected for 24 h with plasmids encoding TAP-tagged C4, C4 residues 1–156 (C4-N) or C4 residues 157–316 (C4-C). Cells were lysed and tagged proteins were purified and analyzed as in panel B. Data shown are representative of three independent experiments. The positions of molecular mass markers in kDa are indicated on the left of each immunoblot.
Fig 2
Fig 2
C4 associates with FLNB independent of FLNA. (A) HEK293T cells were transfected in triplicate with HA-tagged FLNA, FLNB, or GFP for 16 h and then cells were infected with vC4-TAP at an MOI of 10 for 7 h. Cells were lysed and subjected to HA IP. Clean* Log2 ratios of the mean of three HA-FLNB pulldowns against HA-FLNA pulldown (x-axis) are plotted versus −Log10 of the P-values (y-axis) derived from a Student’s t-test. The threshold of P-value = 0.05 is indicated with the blue dashed line. FLNA and FLNB baits are shown with black dots, C4 is indicated in red, and C4’s partners Ku70/80 are in purple. FLNC is in gray and was below the level of significance. *Clean: FLNA and FLNB pulldowns were first compared against the GFP pulldown to exclude non-specific hits. (B) HEK293T cells were transfected with HA-tagged C4, FLNB, or FLNA, and 22 h later cells were lysed and subjected to HA IP. Proteins were analyzed by immunoblotting. (C) HEK293T cells were transfected with HA-tagged GFP, FLNA, FLNB, or C4 and 7 h later cells were infected with vC4-TAP at an MOI of 5 for 16 h. Cells were then lysed, subjected to HA IP, and samples were analyzed by immunoblotting. (D and E) Parental (wild-type, WT) HeLa cells were transfected with the PX459 vector containing guide RNA against FLNA to generate FLNA−/− (KO) cells. WT or FLNA−/− HeLa cells were infected with either vC4-TAP (D) or vC6-TAP (E) at an MOI of 3 for 24 h. Cells were lysed and subjected to AP with anti-streptavidin beads. Proteins were separated by NuPAGE and analyzed by immunoblotting with the indicated antibodies. Data shown are representative of two independent experiments. The positions of molecular mass markers in kDa are indicated on the left of each immunoblot.
Fig 3
Fig 3
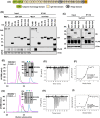
C4 interacts with FLNB via the C-terminal region and this interaction is direct. (A) Schematic representation of the FLNB domain structure. (B) HEK293T cells were transfected with plasmids encoding HA-tagged full-length FLNB or FLNB truncations for 16 h and then either infected with vC4-TAP at an MOI of 10 or mock-infected for a further 6 h. Cells were lysed and then subjected to HA IP. Proteins were separated by NuPAGE and immunoblotted with the indicated antibodies. (C) HEK293T cells were transfected with HA-tagged GFP, or the indicated FLNB truncations, together with TAP-tagged C4 for 24 h. Cells were lysed and subjected to immunoblotting with antibodies against the indicated tags or α-tubulin. (D) Analytical size-exclusion chromatography (SEC) for FLNB repeat 22–24 (R22–R24) and C4 residues 1–149 (C4-N). The elution profiles are shown for R22–R24 (green trace), C4-N (blue trace), or R22–R24 and C4-N mixture (at 1:1 molar ratio, pink trace) from a Superdex 200 Increase 10/300 GL column. Inset image shows the Coomassie-stained SDS-polyacrylamide gel analyses of elution peaks 1–3 in the overlaid chromatograms. The positions of R22-R24 and C4-N are shown. (E) Representative isothermal titration calorimetry (ITC) titration curves showing the interaction between C4-N and FLNB R22-24 and baseline-corrected differential power (DP) versus time. (F) Binding curve showing integrated changes in enthalpy against molar ratio. (G) SEC analysis for FLNB R23-R24 and C4-N. The elution profiles are shown of R23-R24 (green trace), C4-N (blue trace), or R22-R24 and C4-N mixture (at 1:1 molar ratio, pink trace) from a Superdex 200 Increase 10/300 GL column. The inset image shows the Coomassie-stained SDS-polyacrylamide gel. (H) Representative of ITC titration curves showing interaction between C4-N and FLNB R23-24, and baseline-corrected differential power (DP) versus time. (I) Binding curve showing integrated changes in enthalpy against molar ratio. KD, corresponding dissociation constant; N, number of binding sites; ΔH, enthalpy change; ΔG, change in Gibbs free energy. Data shown are representative of three independent experiments, or (E) of an experiment performed in triplicate. The positions of molecular mass markers in kDa are indicated on the left of each immunoblot (B and C) or Coomassie-stained SDS-polyacrylamide gel (D and G).
Fig 4
Fig 4
FLNB dimerization is not required for its interaction with C4. (A) A structural model of FLNB R24 predicted by RaptorX (green) aligned to chain A (orange) of the FLNA dimer structure (PDB code 3CNK). Two key hydrophobic residues, M2589 and L2591, at the dimer interface of FLNA (orange) and their equivalent residues, M2544 and L2546, in FLNB (green) are shown as sticks. Below is a close-up view of the dimer interface showing the hydrophobic residues from FLNB and FLNA, chain A (FLNA) packing against a complementary pocket on the surface of FLNA, chain B (FLNA). The surface of FLNA is colored by surface potentials: red and blue denote positive and negative charges, respectively, while white areas denote non-charged surfaces. (B) Analytical size-exclusion chromatography analysis for an FLNB dimerization-deficient mutant R22–R24 (mR22–R24) and C4-N. The inset image shows the Coomassie-stained SDS-polyacrylamide gel of elution peaks in the overlaid chromatograms. mR22–R24 and C4-N positions are indicated. Data shown are representative of three independent experiments. In panel B, the positions of molecular mass markers in kDa are indicated on the left.
Fig 5
Fig 5
The C4 N terminus contributes to virulence. (A) BALB/c mice (n = 5) were infected i.n. with 1 × 10⁵ p.f.u./mouse of the indicated viruses and their weights were measured daily. Data are expressed as a percentage of the mean weight of the same group of animals on day 0 ± SEM. Data shown are representative of two independent experiments. (B) HEK293T cells were co-transfected in triplicate with a firefly luciferase reporter plasmid under the control of an NF-κB-dependent promoter, a Renilla luciferase transfection control plasmid (7 ng/well), and 60 ng/well of TAP-tagged C4, C4 aa 1–156 (C4-N), or C4 aa 167–316 (C4-C), or EV as a control for 24 h. Cells were then stimulated with TNFα for 8 h or mock-stimulated. Cells were harvested in passive lysis buffer, and firefly luciferase activity was measured and normalized to the Renilla luciferase activity. Then, each sample was compared to the average value of EV control to obtain the fold increase. An immunoblot with antibodies against FLAG-tagged C4 proteins and α-tubulin is shown below. The positions of molecular mass markers in kDa are shown on the left of the immunoblots. Data shown are representative of at least three independent experiments. Statistical significance was measured by a Student’s t-test. *P ≤ 0.05. Error bars represent the standard error of the mean.
Fig 6
Fig 6
C4 does not affect MAPK signaling. (A) HEK293T cells or (B) HeLa cells were co-transfected in quadruplicate with a reporter plasmid encoding firefly luciferase under the control of the AP-1 promoter (AP-1-Luc), a Renilla luciferase transfection control plasmid (10 ng/well), and 100 ng/well of B14-FLAG or C4-TAP for 24 h. Cells were then stimulated with phorbol 12-myristate 13-acetate (PMA) or left unstimulated for 24 h. Cells were harvested in passive lysis buffer, and firefly luciferase activity was measured and normalized to the Renilla luciferase activity. Each sample was compared to the average value of EV control to obtain the fold increase. An immunoblot against FLAG and α-tubulin is shown below, and the positions of molecular mass markers are shown in kDa on the left. (C) HeLa cells were co-transfected in sextuplicate with AP-1-Luc and TK-Renilla reporters as in panel A, and 24 h later cells were mock-infected or infected with the indicated viruses at an MOI of 10 for 16 h. Data shown are representative of two independent experiments. Statistical significance was measured by a Student’s t-test. ns, non-significant, ***P ≤ 0.001, and ****P ≤ 0.0001. Error bars represent the standard error of the mean.
Fig 7
Fig 7
Enhanced VACV plaque size and virus titers in human FLNB−/− cell lines. (A) Parental HeLa cells were transfected with either an empty PX459 vector (EV) or the PX459 containing guide RNA against FLNB to generate the FLNB−/− cells. Single-cell clones of EV and FLNB−/− cells were then selected. Cell monolayers of HeLa Par cells, two EV, and two FLNB−/− clones were infected with VACV A5-GFP to give well-separated plaques. After 2 days, images of GFP-expressing plaques were recorded and quantified by ImageJ software (n = 20 per condition). Lower panel: immunoblot analyzing the levels of FLNB and α-tubulin. The positions of molecular mass markers in kDa are shown on the left. (B) Distances between adjacent nuclei of FLNB WT and FLNB−/− HeLa cells grown in cell monolayers (n = 19). (C) Monolayers of HeLa WT or FLNA−/− cells were infected with VACV A5-GFP to give distinct plaques. After 2 days, images of plaques were recorded as in panel A, and plaque area was determined by ImageJ software (n = 27 per condition). (D) WT and FLNB−/− HeLa cells were infected with vC4-TAP at an MOI of 5. Infected cells and supernatants were collected at 24 hpi, combined, and the infectious virus titers were determined by plaque assay on BS-C-1 cells. (E) WT and FLNB−/− HeLa cells were infected with vC4-TAP at an MOI of 0.01 for the indicated times. Virus titers were determined as in panel D. Data shown are representative of at least two independent experiments. Statistical significance was measured by a Student’s t-test. ns, non-significant, **P ≤ 0.01, ***P ≤ 0.001, and ****P ≤ 0.0001. Error bars represent the standard error of the mean.
Fig 8
Fig 8
VACV infection of FLNB−/− MEFs, but not FLNA−/− MEFs, resulted in increased virus titers and plaque size. (A) WT or FLNB−/− MEFs and (B) WT or FLNA−/− MEFs were infected with vC4-TAP at an MOI of 0.01, and cell-associated virus was collected at the indicated times and titrated by plaque assay on BSC-1 cells. (C) Cells from panel A and (D) cells from panel B were infected with VACV A5-GFP for 2 days until well-separated plaques had formed. Images of GFP-expressing plaques were recorded and quantified by ImageJ software (minimum n = 35 plaques per condition). Data shown are representative of at least two independent experiments. Statistical significance was measured by a Student’s t-test. ns, non-significant, **P ≤ 0.01, ***P ≤ 0.001, and ****P ≤ 0.0001. Error bars represent the standard error of the mean.

References

    1. Moss B, Smith GL. 2021. Poxviridae: the viruses and their replication, p 573–613. In Howley PM, Knipe DM (ed), Fields virology: DNA viruses, 7th ed, Vol. 2. Wolters Kluwer Inc.
    1. Fenner F, Henderson DA, Arita I, Jezek Z, Ladnyi ID. 1988. Smallpox and its eradication. World Health Organization, Geneva.
    1. Mackett M, Smith GL, Moss B. 1982. Vaccinia virus: a selectable eukaryotic cloning and expression vector. Proc Natl Acad Sci U S A 79:7415–7419. doi: 10.1073/pnas.79.23.7415 - DOI - PMC - PubMed
    1. Panicali D, Paoletti E. 1982. Construction of poxviruses as cloning vectors: insertion of the thymidine kinase gene from herpes simplex virus into the DNA of infectious vaccinia virus. Proc Natl Acad Sci U S A 79:4927–4931. doi: 10.1073/pnas.79.16.4927 - DOI - PMC - PubMed
    1. Panicali D, Davis SW, Weinberg RL, Paoletti E. 1983. Construction of live vaccines by using genetically engineered poxviruses: biological activity of recombinant vaccinia virus expressing influenza virus hemagglutinin. Proc Natl Acad Sci U S A 80:5364–5368. doi: 10.1073/pnas.80.17.5364 - DOI - PMC - PubMed