. 2024 Mar 26;43(3):113826.
doi: 10.1016/j.celrep.2024.113826. Epub 2024 Feb 26.

The genomic and evolutionary landscapes of anaplastic thyroid carcinoma

Peter Y F Zeng  1 Stephenie D Prokopec  2 Stephen Y Lai  3 Nicole Pinto  4 Michelle A Chan-Seng-Yue  5 Roderick Clifton-Bligh  6 Michelle D Williams  7 Christopher J Howlett  8 Paul Plantinga  8 Matthew J Cecchini  9 Alfred K Lam  9 Iram Siddiqui  10 Jianxin Wang  5 Ren X Sun  5 John D Watson  2 Reju Korah  11 Tobias Carling  11 Nishant Agrawal  12 Nicole Cipriani  13 Douglas Ball  14 Barry Nelkin  15 Lisa M Rooper  16 Justin A Bishop  17 Cathie Garnis  18 Ken Berean  18 Norman G Nicolson  11 Paul Weinberger  19 Ying C Henderson  3 Christopher M Lalansingh  5 Mao Tian  20 Takafumi N Yamaguchi  2 Julie Livingstone  2 Adriana Salcedo  21 Krupal Patel  22 Frederick Vizeacoumar  23 Alessandro Datti  24 Liu Xi  25 Yuri E Nikiforov  26 Robert Smallridge  27 John A Copland  28 Laura A Marlow  28 Martin D Hyrcza  29 Leigh Delbridge  30 Stan Sidhu  30 Mark Sywak  30 Bruce Robinson  31 Kevin Fung  32 Farhad Ghasemi  4 Keith Kwan  8 S Danielle MacNeil  32 Adrian Mendez  32 David A Palma  33 Mohammed I Khan  4 Mushfiq Shaikh  4 Kara M Ruicci  4 Bret Wehrli  8 Eric Winquist  33 John Yoo  32 Joe S Mymryk  34 James W Rocco  35 David Wheeler  25 Steve Scherer  25 Thomas J Giordano  36 John W Barrett  4 William C Faquin  37 Anthony J Gill  38 Gary Clayman  39 Paul C Boutros  40 Anthony C Nichols  41
Affiliations

The genomic and evolutionary landscapes of anaplastic thyroid carcinoma

Peter Y F Zeng et al. Cell Rep. .

Abstract

Anaplastic thyroid carcinoma is arguably the most lethal human malignancy. It often co-occurs with differentiated thyroid cancers, yet the molecular origins of its aggressivity are unknown. We sequenced tumor DNA from 329 regions of thyroid cancer, including 213 from patients with primary anaplastic thyroid carcinomas. We also whole genome sequenced 9 patients using multi-region sequencing of both differentiated and anaplastic thyroid cancer components. Using these data, we demonstrate thatanaplastic thyroid carcinomas have a higher burden of mutations than other thyroid cancers, with distinct mutational signatures and molecular subtypes. Further, different cancer driver genes are mutated in anaplastic and differentiated thyroid carcinomas, even those arising in a single patient. Finally, we unambiguously demonstrate that anaplastic thyroid carcinomas share a genomic origin with co-occurring differentiated carcinomas and emerge from a common malignant field through acquisition of characteristic clonal driver mutations.

Keywords: CP: Cancer; CP: Genomics; anaplastic thyroid cancer; cancer progression; genomics; tumour evolution; tumour heterogeneity.


Conflict of interest statement

Declaration of interests All authors declare that they have no competing interests.

Figures
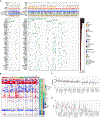
Figure 1.
Figure 1.. Somatic mutational landscape of anaplastic thyroid cancer
(A) Anaplastic thyroid cancers (ATCs) vary significantly in mutation density (single-nucleotide variants [SNVs] per million base pairs of DNA covered). Genes were selected based on SeqSig analysis p values (FDR < 0.05). (B) Copy-number aberrations (CNAs) across ATC; consensus clustering was used to identify the optimal method and designation for sample groupings. Each row represents the CNA profile for a single undifferentiated tumor along the genome (chromosome 1 on the left to chromosome Y on the right), ordered by percentage genome altered (PGA) within each subtype. (C and D) Metrics of mutation density for ATC, co-occurring DTC, and papillary thyroid cancer (PTC) were compared with 32 additional tumor types available in the PCAWG (Pan-Cancer Analysis of Whole Genomes) dataset: (C) SNVs/Mb and (D) total PGA. Light purple indicates the PCAWG thyroid carcinoma cohort (primarily PTC) and similar GATCI PTC cohort; co-occurring DTC samples are shown in medium purple, while ATCs are in dark purple; for SNVs/Mb, x’s indicate samples without a matched normal; these typically have higher than average rates. PGA for the GATCI PTC samples is similar to that of the PCAWG thyroid carcinoma cohort. Blue points for SNVs/Mb indicate results from WGS cohort. Red line indicates the median value. ATC shows higher PGA than either co-occurring DTC or PTC and a lower rate of point mutations than co-occurring DTC.
Figure 2.
Figure 2.. Genomic features of ATC and their associations with clinical features
(A) Non-negative matrix factorization (NMF) identified five trinucleotide signatures within ATC, four of which matched known COSMIC signatures and one that was a novel signature. Within each signature, the percentage of mutations within the cohort presenting each base change is shown (broken down by trinucleotide context). (B) For each patient, the proportion of SNVs that contribute to each signature. There were no associations between these signatures and the covariates shown (Spearman’s correlation p < 0.1). (C and D) Average CNA profiles (C) and distribution of PGA (D) for samples from each ATC subtype, co-occurring DTC, and PTC, showing a significant difference between groups (one-way ANOVA, p < 0.01). (E) GISTIC was used to identify recurrent CNAs within ATC. (F) Pearson’s χ2, Spearman’s correlation, Mann-Whitney U, or Kruskal-Wallis test was used to assess overlap across genomic features in ATC (SeqSig driver genes by SNV or CNAs, SNVs/Mb, PGA, trinucleotide signatures, CNA metrics); shading indicates FDR-adjusted p value. (G–I) Comparison of thyroid differentiation score (G), BRAF-RAS scores (H), and estimated immune cell subsets (I) between the RNA-seq samples from ATC (n = 24) and cell lines (n = 13) from the current study and normal thyroid (n = 58), primary PTC (n = 502), and metastatic PTC (n = 8) from TCGA. Error bar represents 1 SD. The p values are from FDR-adjusted Mann-Whitney U test. All samples are biological replicates.
Figure 3.
Figure 3.. Genomic hallmarks of anaplastic thyroid cancer implicate diverse pathways
Single-nucleotide variants and copy-number alterations of co-occurring differentiated thyroid cancer and anaplastic thyroid cancers reveal recurrent alterations in gene sets such as tumor suppressors, MAPK-RAS, thyroid, epigenetic, WNT, SWI/SNF, and finally other identified GATCI genes (SeqSig FDR < 0.05). Red dashed box indicates samples with no known SNV alteration in the gene sets above.
Figure 4.
Figure 4.. ATC and co-occurring DTC share clonal origins, but with distinct driver events
(A) GISTIC was used to identify recurrent CNAs within PTC; this identified multiple amplifications of chromosome 17 as being significant and recurrent compared with ATC. (B) GISTIC was used to identify recurrent CNAs within co-occurring DTC. Copy-number losses of CDKN2A were more frequent in ATC than co-occurring well/poorly differentiated samples (DTC). (C) Twenty-one patients had CNA profiles generated through copy-number arrays for multiple tumor regions. Each plot shows the genomic CNA profiles for a single patient, with different tumor regions as rows. Covariates on the right indicate ATC subtype (where available), tumor type (ATC, co-occurring DTC, or metastasis), patient sex, patient age at diagnosis, and BRAF V600E status. (D) Thirty patients had WES or WGS in multiple regions. Each subplot shows the mutational profile of the SeqSig genes (FDR < 0.05) in the paired samples. (E) Gene-wise mutation frequencies were contrasted between datasets (GATCI-ATC, GATCI-DTC, GATCI-PTC, and TCGA-PTC) to identify candidate drivers of tumor progression. Genes with a statistically significant difference (proportion-test) between ATC and TCGA-PTC were selected and further filtered to show only known driver genes (defined using COSMIC or Candidate Cancer Gene Database). FDR-adjusted p values from proportion-tests across the three tumor types (PTC [combined], co-occurring DTC, ATC) are shown. Results for pairwise comparisons are available in Table S11. (F) Landscape of CNAs determined by WGS for patients with both ATC and paired co-occurring DTC, along with matched normal tissue. CNAs are color-coded as to their origin (trunk, branch, or unclear). All samples are biological replicates.
Figure 5.
Figure 5.. ATC and DTC evolve in a mutagenic field
(A) Key for interpreting plots. (B–J) Subclonal reconstruction of the nine patients profiled using WGS. Left: changes in percentage genome altered (PGA) are shown by blue lines and correspond to the left axis, while accumulation of SNVs is shown by gold lines and corresponds to the right axis. Right: representation of the total cancer cell fraction (CCF) for each distinct subclone for either the ATC (top) or the co-occurring DTC (bottom) component. Interestingly, ATCWGS33 (D) showed outgrowth of two distinct co-mixed lineages from a mutagenic field. (K) Proposed model of thyroid cancer progression.

References

    1. Bruinsma SM, Roobol MJ, Carroll PR, Klotz L, Pickles T, Moore CM, Gnanapragasam VJ, Villers A, Rannikko A, Valdagni R, et al. (2017). Expert consensus document: Semantics in active surveillance for men with localized prostate cancer - results of a modified Delphi consensus procedure. Nat. Rev. Urol. 14, 312–322. 10.1038/nrurol.2017.26. - DOI - PubMed
    1. Shaha AR, and Tuttle RM (2018). Editorial: Risk of disease progression during active surveillance of papillary thyroid cancer. Surgery 163, 53–54. 10.1016/j.surg.2017.08.020. - DOI - PubMed
    1. Garrido-Laguna I, and Hidalgo M. (2015). Pancreatic cancer: from state-of-the-art treatments to promising novel therapies. Nat. Rev. Clin. Oncol. 12, 319–334. 10.1038/nrclinonc.2015.53. - DOI - PubMed
    1. Gross AM, Orosco RK, Shen JP, Egloff AM, Carter H, Hofree M, Choueiri M, Coffey CS, Lippman SM, Hayes DN, et al. (2014). Multi-tiered genomic analysis of head and neck cancer ties TP53 mutation to 3p loss. Nat. Genet. 46, 939–943. 10.1038/ng.3051. - DOI - PMC - PubMed
    1. Bayani J, Yao CQ, Quintayo MA, Yan F, Haider S, D’Costa A, Brookes CL, van de Velde CJH, Hasenburg A, Kieback DG, et al. (2017). Molecular stratification of early breast cancer identifies drug targets to drive stratified medicine. NPJ Breast Cancer 3, 3. 10.1038/s41523-016-0003-5. - DOI - PMC - PubMed

Publication types