. 2024 Jan 8;18(1):wrae030.
doi: 10.1093/ismejo/wrae030.

Gut microbiota contribute to variations in honey bee foraging intensity

Affiliations

Gut microbiota contribute to variations in honey bee foraging intensity

Cassondra L Vernier et al. ISME J. .

Abstract

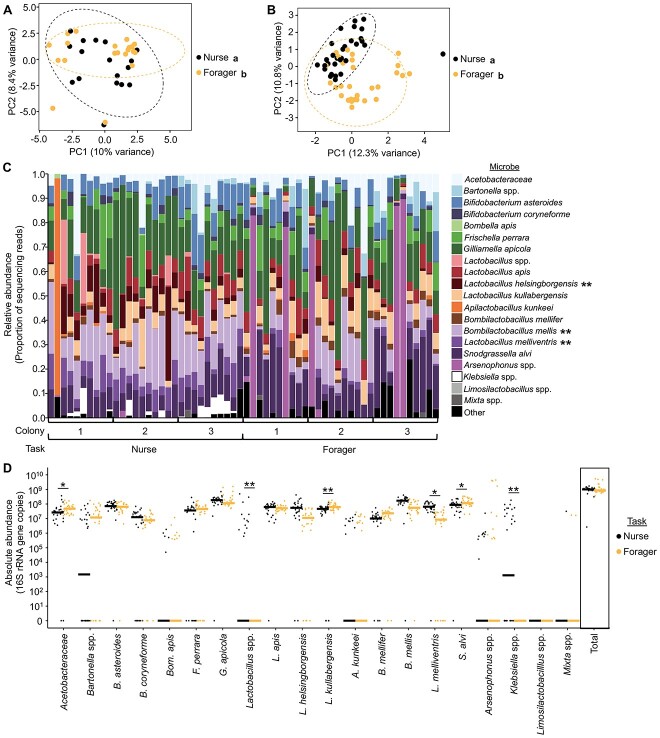
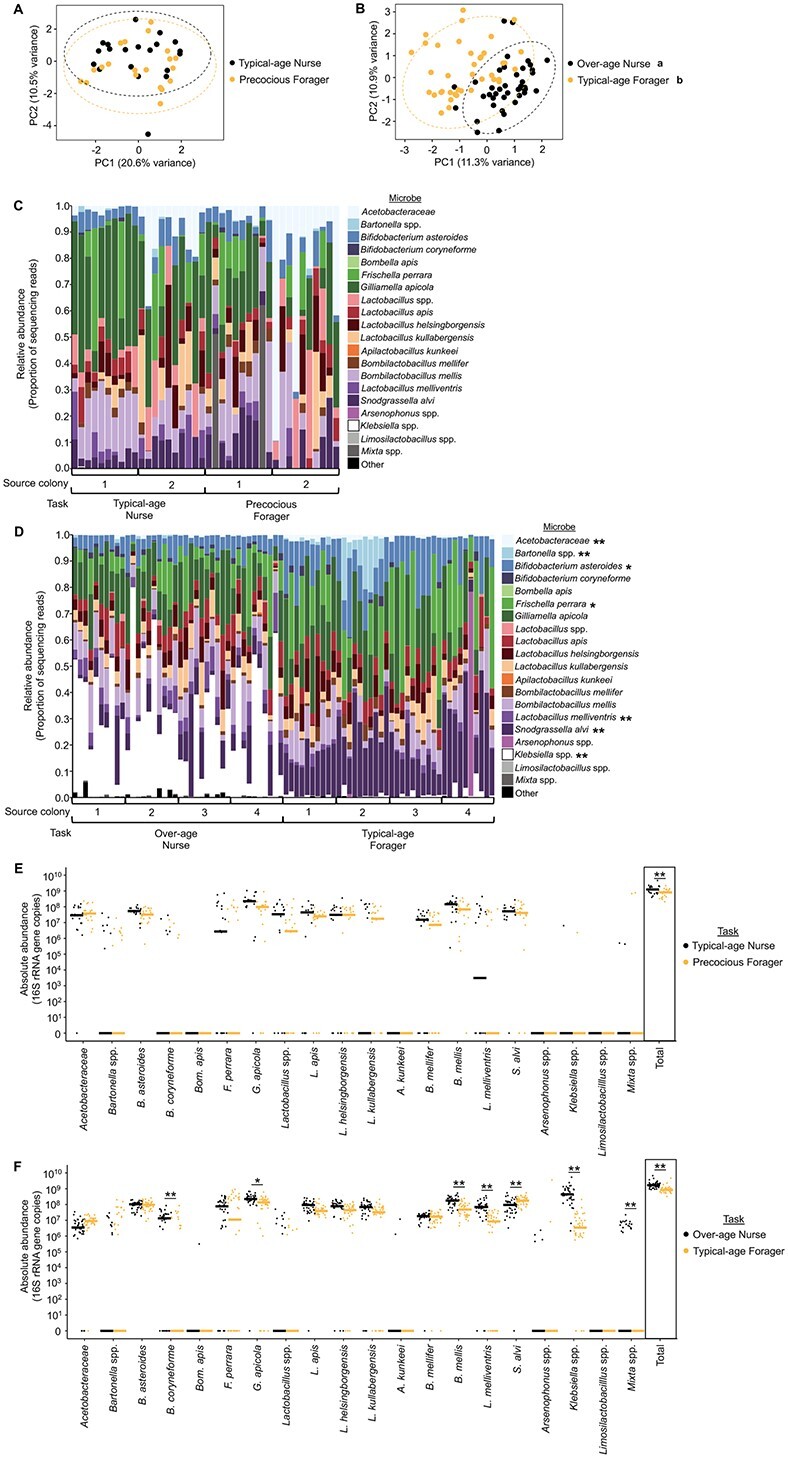
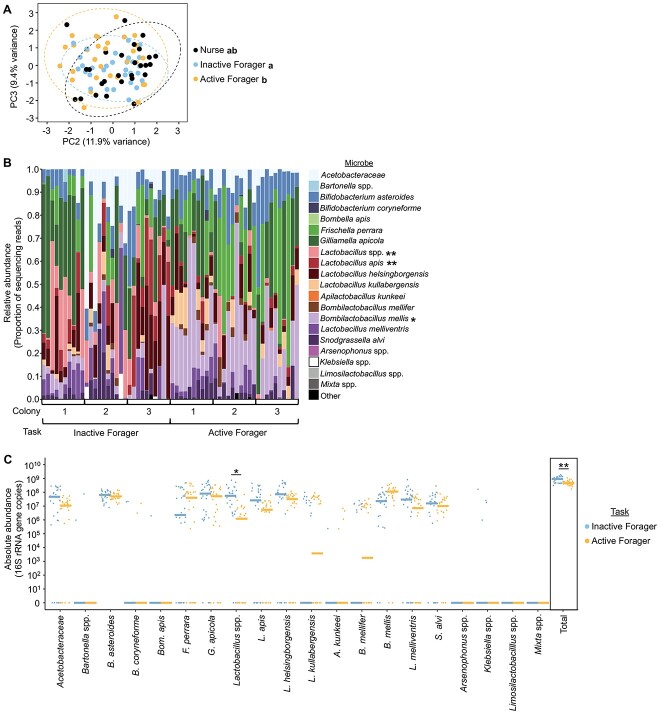
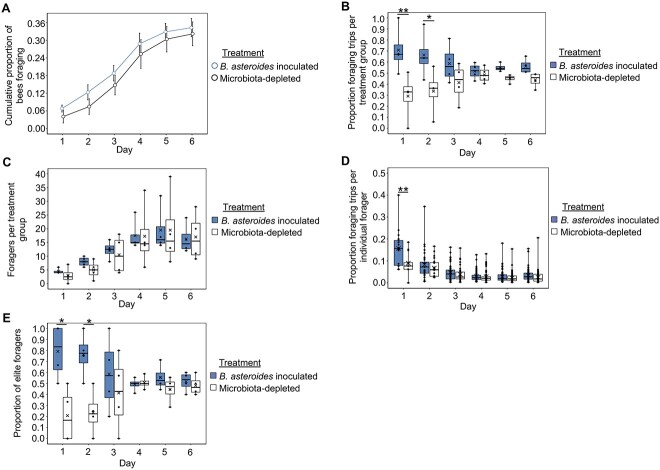
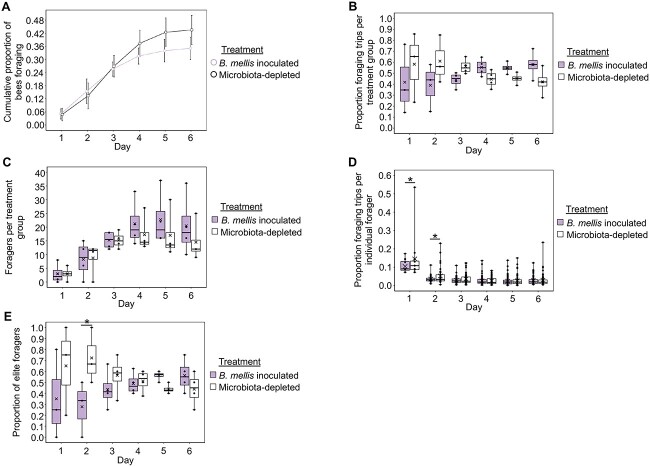
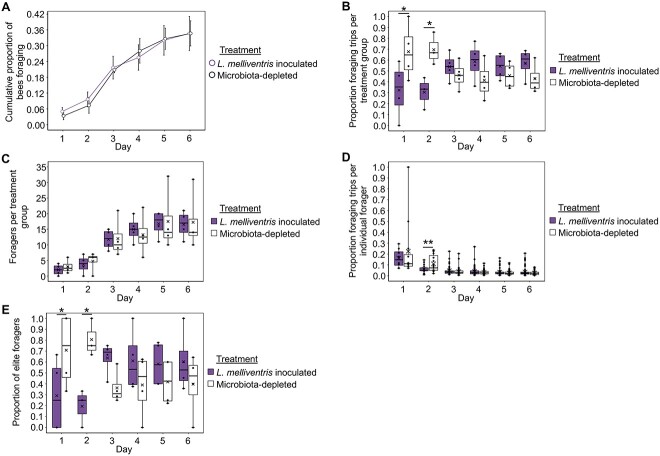
Gut microbiomes are increasingly recognized for mediating diverse biological aspects of their hosts, including complex behavioral phenotypes. Although many studies have reported that experimental disruptions to the gut microbial community result in atypical host behavior, studies that address how gut microbes contribute to adaptive behavioral trait variation are rare. Eusocial insects represent a powerful model to test this, because of their simple gut microbiota and complex division of labor characterized by colony-level variation in behavioral phenotypes. Although previous studies report correlational differences in gut microbial community associated with division of labor, here, we provide evidence that gut microbes play a causal role in defining differences in foraging behavior between European honey bees (Apis mellifera). We found that gut microbial community structure differed between hive-based nurse bees and bees that leave the hive to forage for floral resources. These differences were associated with variation in the abundance of individual microbes, including Bifidobacterium asteroides, Bombilactobacillus mellis, and Lactobacillus melliventris. Manipulations of colony demography and individual foraging experience suggested that differences in gut microbial community composition were associated with task experience. Moreover, single-microbe inoculations with B. asteroides, B. mellis, and L. melliventris caused effects on foraging intensity. These results demonstrate that gut microbes contribute to division of labor in a social insect, and support a role of gut microbes in modulating host behavioral trait variation.

Keywords: behavior; division of labor; foraging; honey bee; microbiome.


Conflict of interest statement

None declared.

Figures

Figure 1
Figure 1
Nurses and foragers from typical honey bee colonies differ in gut microbial community. (A, B) Nurses and foragers differed in overall gut microbial community structure. (A) Reanalyzed data from Kapheim et al. [40]. Two-way permutation MANOVA using Aitchison distance, task: F1,38 = 1.5, R2 = 0.04, P = .016; colony: F4,38 = 1.7, R2 = 0.17, P = .001, task*colony: F2,38 = 1.2, R2 = 0.06, P = .100. N = 1–12 bees/colony, 5 colonies. (B) New data. Two-way permutation MANOVA using Aitchison distance, task: F1,59 = 4.3, R2 = 0.07, P = .001; Colony: F2,59 = 2.3, R2 = 0.07, P = .001, task*colony: F2,59 = 1.2, R2 = 0.04, P = .144. N = 10 bees/colony, 3 colonies. Depicted as PCA plots. Lowercase letters in legends denote statistically significant groups. (C) Nurses and foragers differed in relative abundance of 4 individual microbial species (new data only). Depicted as stacked bar plots, with each bar representing a single bee’s gut microbial community. Asterisks in legend: *, P ≤ .05, **, P ≤ .01, ANCOM-BC between nurses and foragers. See Supplementary Table 1 for all P values. (D) Nurses and foragers differed in absolute abundance of 4 individual microbial species but not in the total normalized number of 16S rRNA gene copies (new data only). 10× number of 16S rRNA gene copies, calculated by multiplying the relative abundance each microbe in each sample (determined through 16S rRNA gene amplicon sequencing) by the normalized number of 16S rRNA gene copies in the sample (determined through qPCR). Depicted as dot plots with all data points plotted, line represents median, N = 10 bees/colony, 3 colonies. *, P ≤ .05, **, P ≤ .01, permutation ANOVA test between nurses and foragers. See Supplementary Table 1 for all P values.
Figure 2
Figure 2
Age-matched nurses and foragers differ in gut microbial community. (A, B) Age-matched typical-age nurses and precocious foragers from an SCC did not differ in gut microbial community structure at about 1 week of age (A), but age-matched over-age nurses and typical-age foragers significantly differed in gut microbial community structure at 3 weeks of age (B). 1 week: two-way permutation MANOVA using Aitchison distance, task: F1,39 = 0.9, R2 = 0.02, P = .519; source colony: F1,39 = 2.6, R2 = 0.06, P = .004, task*colony: F1,39 = 1.2, R2 = 0.03, P = .296. N = 10 bees/source colony, 2 source colonies. 3 weeks: two-way permutation MANOVA using Aitchison distance, task: F1,79 = 6.5, R2 = 0.07, P = .001; source colony: F3,79 = 1.8, R2 = 0.06, P = .001, task*colony: F3,79 = 1.2, R2 = 0.04, P = .084. N = 10 bees/source colony, 4 source colonies. Depicted as PCA plots. Lowercase letters in legends denote statistically significant groups. (C, D) Age-matched typical-age nurses and precocious foragers from an SCC did not differ in relative abundance of individual microbial species (C), whereas age-matched over-age nurses and typical-age foragers differed in relative abundance of 5 individual microbial species at 3 weeks of age (D). Depicted as stacked bar plots, with each bar representing a single bee’s gut microbial community. Asterisks in legend: *, P ≤ .05, **, P ≤ .01, ANCOM-BC between nurses and foragers. See Supplementary Table 2 for all P values. (E, F) Age-matched typical-age nurses and precocious foragers from an SCC did not differ in absolute abundance of individual microbial species but did differ in the total normalized number of 16S rRNA gene copies (E), whereas age-matched over-age nurses and typical-age foragers differed in absolute abundance of 6 microbial species and the total number of 16S rRNA gene copies at 3 weeks of age (F). 10× number of 16S rRNA gene copies, calculated by multiplying the relative abundance each microbe in each sample (determined through 16S rRNA gene amplicon sequencing) by the normalized number of 16S rRNA gene copies in the sample (determined through qPCR). Depicted as dot plots with all data points plotted, line represents median, N = 10 bees/source colony, 2 source colonies (1 week) or 4 source colonies (3 weeks). *, P ≤ .05, **, P ≤ .01, permutation ANOVA test between nurses and foragers. See Supplementary Table 2 for all P values.
Figure 3
Figure 3
Age-matched inactive and active foragers differ in gut microbial community structure, but not the abundance of individual microbes. (A) Age-matched nurses and inactive foragers were similar in gut microbial community structure, whereas age-matched active and inactive foragers differed in gut microbial community structure. Two-way permutation MANOVA using Aitchison distance, task: F2,86 = 1.8, R2 = 0.04, P = .011; colony: F2,86 = 6.0, R2 = 0.12, P = .001, task*colony: F4,86 = 0.8, R2 = 0.03, P = .883. N = 10 bees/colony, 3 colonies. Depicted as PCA plot. Lowercase letters in legends denote statistically significant groups as determined by pairwise permutation MANOVA. (B) Age-matched inactive and active foragers did not differ in the relative abundance of individual microbial species (B). Depicted as stacked bar plots, with each bar representing a single bee’s gut microbial community. Asterisks in legend: *, P ≤ .05, **, P ≤ .01, ANCOM-BC between inactive and active foragers. See Supplementary Table 4 for all P values. (C) Age-matched inactive and active foragers did not differ in absolute abundance of individual microbial species but did differ in the total normalized number of 16S rRNA gene copies. 10× number of 16S rRNA gene copies, calculated by multiplying the relative abundance each microbe in each sample (determined through 16S rRNA gene amplicon sequencing) by the normalized number of 16S rRNA gene copies in the sample (determined through qPCR). Depicted as dot plots with all data points plotted, line represents median, N = 10 bees/colony, 3 colonies. *, P ≤ .05, **, P ≤ .01, permutation ANOVA test between inactive and active foragers. See Supplementary Table 4 for all P values.
Figure 4
Figure 4
Bees inoculated with B. asteroides do not differ from microbiota-depleted bees in behavioral maturation (age at onset of foraging), but do differ in foraging intensity. (A) B. asteroides inoculated bees did not differ from microbiota-depleted bees in age at onset of foraging. Cox proportional hazards, z = −0.331, P = .741. (B) B. asteroides inoculated foragers, as a group, performed the majority of foraging trips for the colony on the 1st and 2nd days of behavioral tracking. Linear mixed effects model, treatment: F1,33 = 21.2, P < .001, day: F5,33 = 0, P = 1, treatment*day: F5,33 = 2.0, P = .107. See Supplementary Table 5 for pairwise comparisons. (C) B. asteroides inoculated bees represented a similar number of foragers as microbiota-depleted bees on all days of behavioral tracking. Linear mixed effects model, treatment: F1,33 = 0.4, P = .527, day: F5,33 = 12.1, P < .001, treatment*day: F5,33 = 0.1, P = .982. See Supplementary Table 5 for pairwise comparisons. (D) Individual B. asteroides inoculated foragers performed a majority of foraging trips for the colony the 1st day of behavioral tracking. Generalized linear mixed effects model with log-normal distribution, treatment: χ2 = 4.985, P = .026, day: χ2 = 382.933, P < .001, treatment*day: χ2 = 26.315, P < .001. See Supplementary Table 5 for pairwise comparisons. (E) B. asteroides inoculated bees represented a higher proportion of elite foragers than microbiota-depleted bees on the 1st and 2nd days of behavioral tracking. Linear mixed effects model, treatment: F1,33 = 15.8, P < .001, day: F5,33 = 0, P = 1, treatment*day: F5,33 = 3.2, P = .020. See Supplementary Table 5 for pairwise comparisons. (A) Depicted as survival plot. All other data depicted as box plots with data points plotted, thick horizonal line represents median, x represents mean, whiskers represent the minimum and maximum values, N = 4 colonies. Asterisks used to denote comparisons between treatment groups on each day only: *, P ≤ .05, **, P ≤ .001.
Figure 5
Figure 5
Bees inoculated with B. mellis do not differ from microbiota-depleted bees in behavioral maturation (age at onset of foraging), but do differ in foraging intensity. (A) B. mellis inoculated bees did not differ from microbiota-depleted bees in age at onset of foraging. Cox proportional hazards, z = 1.525, P = .127. (B) B. mellis inoculated foragers, as a group, performed a similar proportion of foraging trips for the colony as microbiota-depleted bees all days of behavioral tracking, with a marginal effect of performing a minority of foraging trips for the colony on the 2nd day of behavioral tracking. Linear mixed effects model, treatment: F1,29.091 = 0.04, P = .851, day: F5,29.719 = 0, P = 1, treatment*day: F5,29.091 = 2.0, P = .111. See Supplementary Table 5 for pairwise comparisons. (C) B. mellis inoculated bees represented a similar number of foragers as microbiota-depleted bees on all days of behavioral tracking. Linear mixed effects model, treatment: F1,33 = 3.2, P = .084, day: F5,33 = 14.9, P < .001, treatment*day: F5,33 = 0.8, P = .582. See Supplementary Table 5 for pairwise comparisons. (D) Individual B. mellis inoculated foragers performed a minority of foraging trips for the colony on the 1st and 2nd days of behavioral tracking. Generalized linear mixed effects model with log-normal distribution, treatment: χ2 = 3.626, P = .057, day: χ2 = 255.497, P < .001, treatment*day: χ2 = 6.552, P = .256, see Supplementary Table 5 for pairwise comparisons. No statistical outliers were detected in these data. (E) B. mellis inoculated bees represented a lower proportion of elite foragers than microbiota-depleted bees on the 2nd day of behavioral tracking. Linear mixed effects model, treatment: F1,29.091 = 1.9, P = .179, day: F5,29.719 = 0, P = 1, treatment*day: F5,29.091 = 2.2, P = .083. See Supplementary Table 5 for pairwise comparisons. (A) Depicted as survival plot. All other data depicted as box plots with data points plotted, thick horizonal line represents median, x represents mean, whiskers represent the minimum and maximum values, N = 4 colonies. Asterisks used to denote comparisons between treatment groups on each day only: *, P ≤ .05, **, P ≤ .001.
Figure 6
Figure 6
Bees inoculated with L. melliventris do not differ from microbiota-depleted bees in behavioral maturation (age at onset of foraging), but do differ in foraging intensity. (A) L. melliventris inoculated bees did not differ from microbiota-depleted bees in age at onset of foraging. Cox proportional hazards, z = −0.435, P = .664. (B) L. melliventris inoculated foragers, as a group, performed the minority of foraging trips for the colony on the 1st and 2nd days of behavioral tracking. Linear mixed effects model, treatment: F1,31.021 = 0.4, P = .558, day: F5,31.443 = 0, P = 1, treatment*day: F5,31.021 = 4.2, P = .005. See Supplementary Table 5 for pairwise comparisons. (C) L. melliventris inoculated bees represented a similar number of foragers as microbiota-depleted bees on all days of behavioral tracking. Linear mixed effects model, treatment: F1,33 = 0.08, P = .781, day: F5,33 = 18.9, P < .001, treatment*day: F5,33 = 0.1, P = .984. See Supplementary Table 5 for pairwise comparisons. (D) Individual L. melliventris inoculated foragers performed a minority of foraging trips for the colony the 2nd day of behavioral tracking. Generalized linear mixed effects model with log-normal distribution, treatment: χ2 = 0.141, P = .707, day: χ2 = 334.831, P < .001, treatment*day: χ2 = 18.336, P = .003, see Supplementary Table 5 for pairwise comparisons. No statistical outliers were detected in these data. (E) L. melliventris inoculated bees represented a lower proportion of elite foragers than microbiota-depleted bees on the 1st and 2nd days of behavioral tracking. Linear mixed effects model, treatment: F1,31.021 = 0.0006, P = .981, day: F5,31.443 = 0, P = 1, treatment*day: F5,31.021 = 4.0, P = .007. See Supplementary Table 5 for pairwise comparisons. (A) Depicted as survival plot. All other data depicted as box plots with data points plotted, thick horizonal line represents median, x represents mean, whiskers represent the minimum and maximum values, N = 4 colonies. Asterisks used to denote comparisons between treatment groups on each day only: *, P ≤ .05, **, P ≤ .001.

Similar articles

Cited by

References

    1. Zilber-Rosenberg I, Rosenberg E. Role of microorganisms in the evolution of animals and plants: the hologenome theory of evolution. FEMS Microbiol Rev 2008;32:723–35. 10.1111/j.1574-6976.2008.00123.x. - DOI - PubMed
    1. Flint HJ, Karen P, Louis Pet al. . The role of the gut microbiota in nutrition and health. Nat Rev Gastroenterol Hepatol 2012;9:577–89. 10.1038/nrgastro.2012.156. - DOI - PubMed
    1. Ezenwa VO, Gerardo NM, Inouye DWet al. . Animal behavior and the microbiome. Science 1979;338:198–9. 10.1126/science.1227412. - DOI - PubMed
    1. Sherwin E, Bordenstein SR, Quinn JLet al. . Microbiota and the social brain. Science 1979;366:587. 10.1126/science.aar2016. - DOI - PubMed
    1. Hooper LV, Littman DR, Macpherson AJ. Interactions between the microbiota and the immune system. Science 1979;336:1268–73. 10.1126/science.1223490. - DOI - PMC - PubMed