. 2024 Mar 5;121(10):e2217877121.
doi: 10.1073/pnas.2217877121. Epub 2024 Feb 27.

Claudin-2 upregulation enhances intestinal permeability, immune activation, dysbiosis, and mortality in sepsis

Affiliations

Claudin-2 upregulation enhances intestinal permeability, immune activation, dysbiosis, and mortality in sepsis

Takehiko Oami et al. Proc Natl Acad Sci U S A. .

Abstract

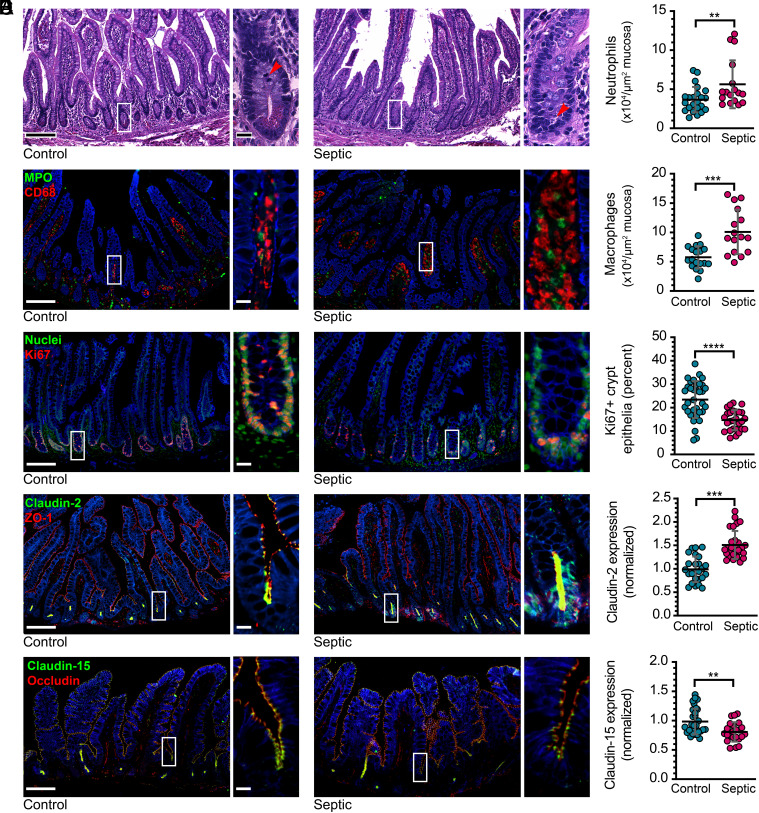
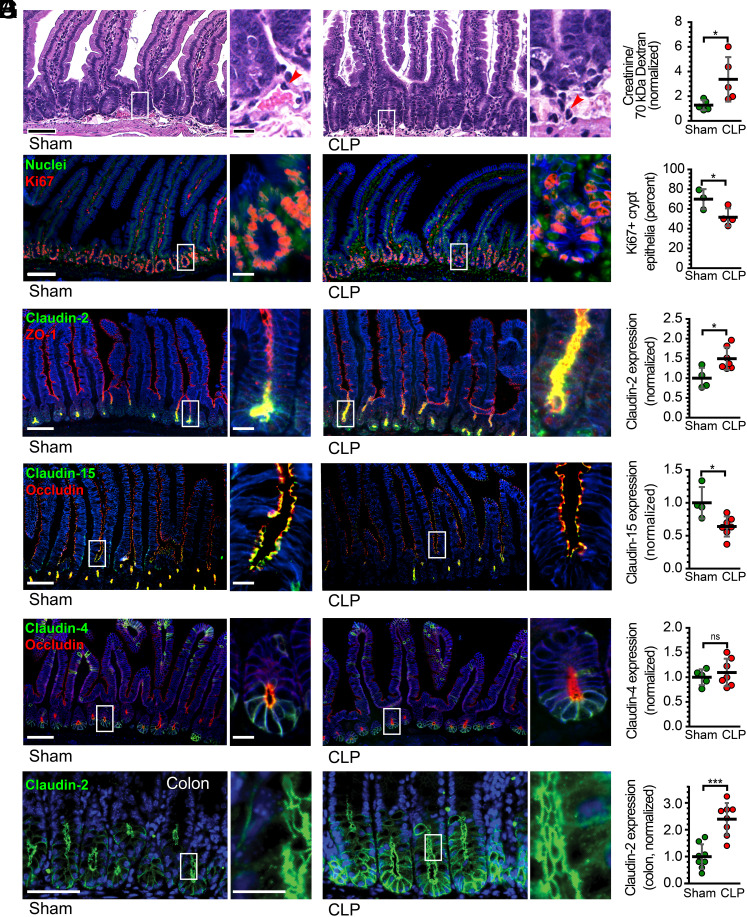
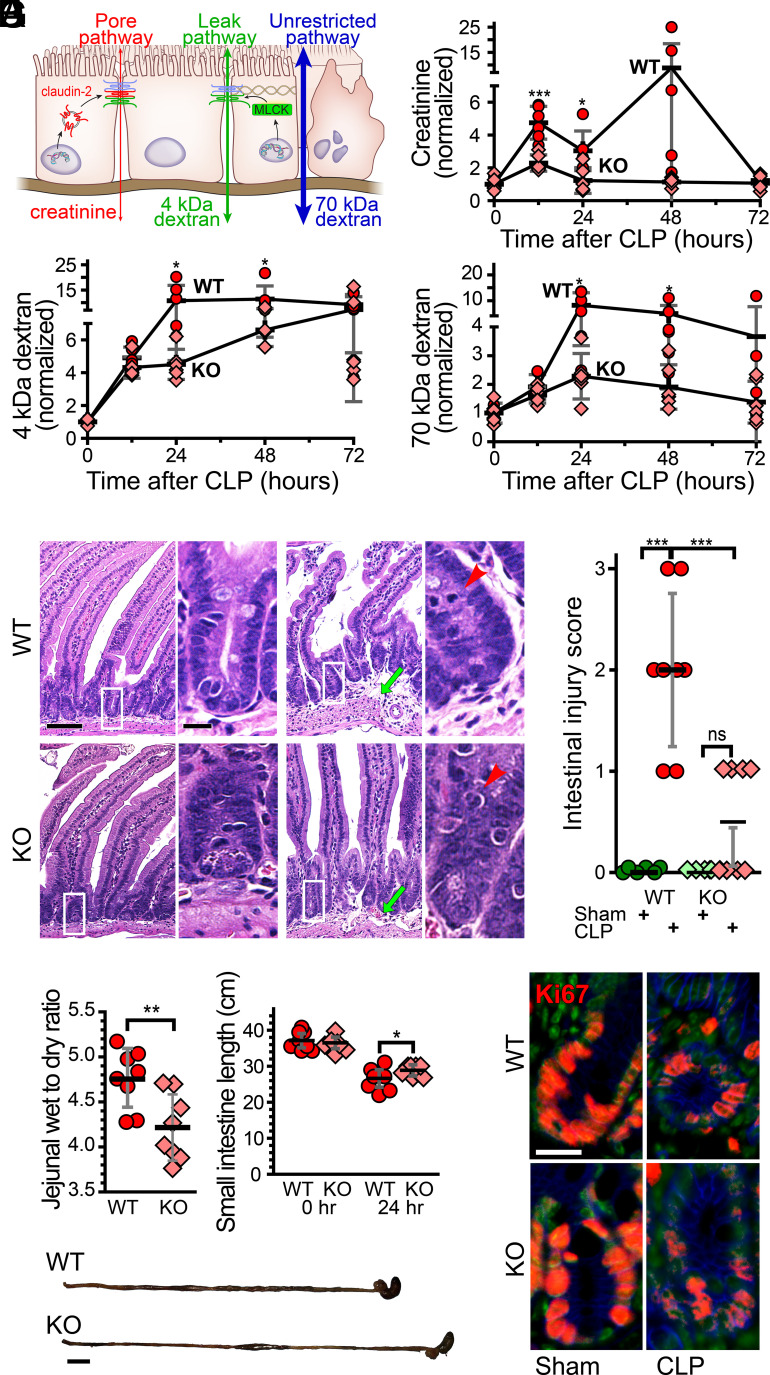
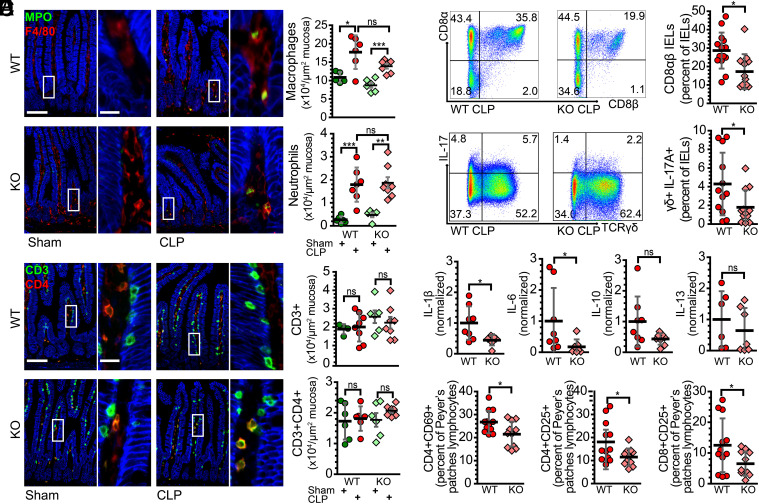
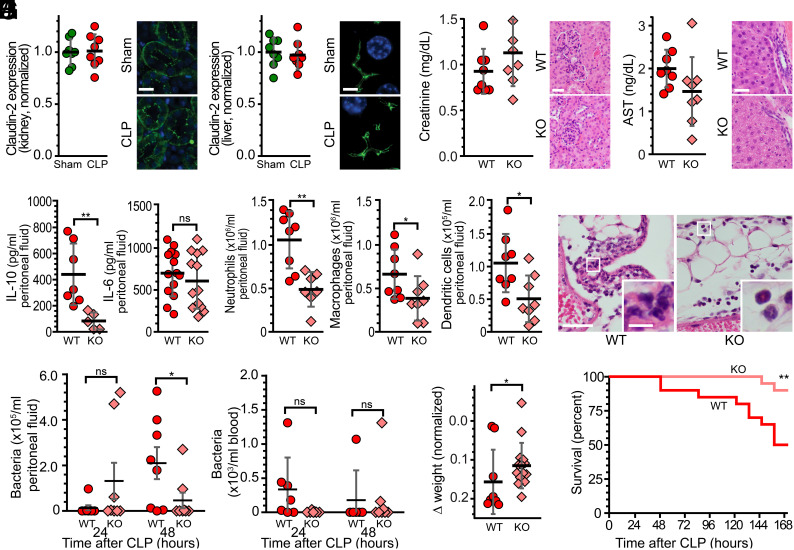
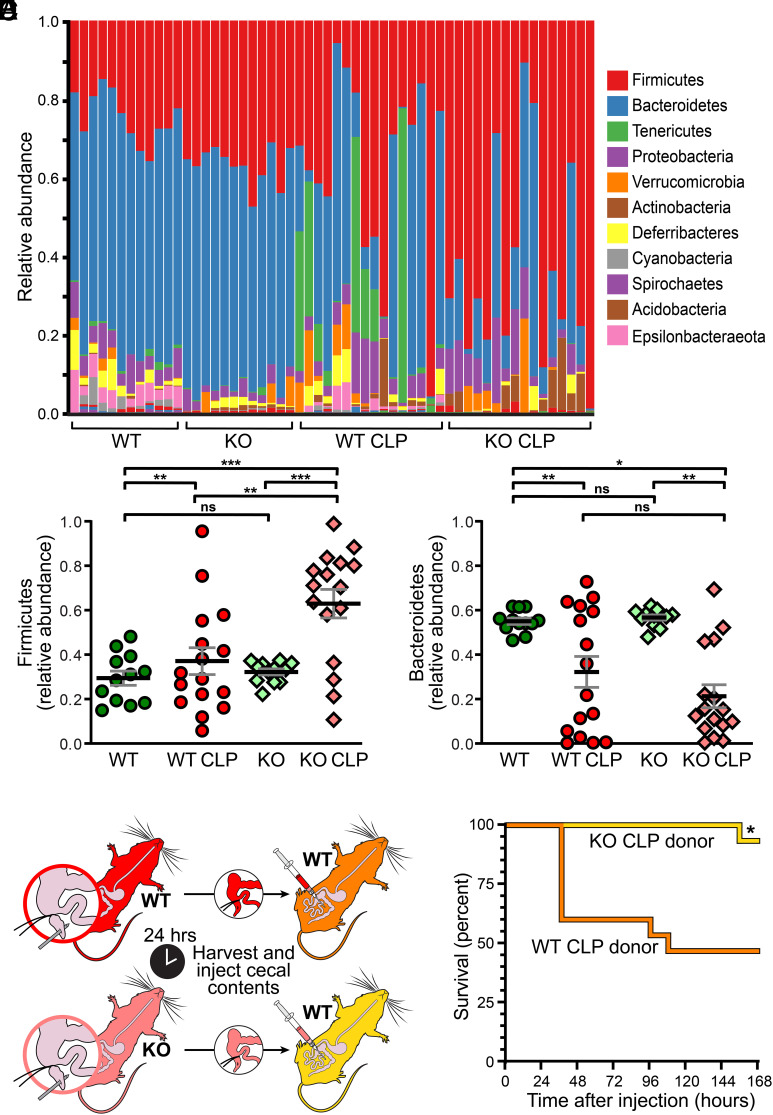
Intestinal epithelial expression of the tight junction protein claudin-2, which forms paracellular cation and water channels, is precisely regulated during development and in disease. Here, we show that small intestinal epithelial claudin-2 expression is selectively upregulated in septic patients. Similar changes occurred in septic mice, where claudin-2 upregulation coincided with increased flux across the paracellular pore pathway. In order to define the significance of these changes, sepsis was induced in claudin-2 knockout (KO) and wild-type (WT) mice. Sepsis-induced increases in pore pathway permeability were prevented by claudin-2 KO. Moreover, claudin-2 deletion reduced interleukin-17 production and T cell activation and limited intestinal damage. These effects were associated with reduced numbers of neutrophils, macrophages, dendritic cells, and bacteria within the peritoneal fluid of septic claudin-2 KO mice. Most strikingly, claudin-2 deletion dramatically enhanced survival in sepsis. Finally, the microbial changes induced by sepsis were less pathogenic in claudin-2 KO mice as survival of healthy WT mice injected with cecal slurry collected from WT mice 24 h after sepsis was far worse than that of healthy WT mice injected with cecal slurry collected from claudin-2 KO mice 24 h after sepsis. Claudin-2 upregulation and increased pore pathway permeability are, therefore, key intermediates that contribute to development of dysbiosis, intestinal damage, inflammation, ineffective pathogen control, and increased mortality in sepsis. The striking impact of claudin-2 deletion on progression of the lethal cascade activated during sepsis suggests that claudin-2 may be an attractive therapeutic target in septic patients.

Keywords: barrier; gut; intestine; sepsis; tight junction.


Conflict of interest statement

Competing interests statement:The authors declare no competing interest.

Figures

Fig. 1.
Fig. 1.
Tight junction protein expression is modified in septic patients. (A) Representative histopathology of ileal tissue from a control subject (Left) and a septic patient (Right). Note the mitosis in the control and apoptotic body in the septic conditions (arrows). (B) Representative immunofluorescent staining of myeloperoxidase-positive neutrophils (green) and CD68-positive macrophages (red). The graphs show numbers of neutrophils and macrophages within mucosa of control subjects (cyan) and septic patients (magenta). (C) Ki67 (red) staining shows proliferating cells. Nuclear stain (Hoechst 33258, green) is shown for reference. (D) Claudin-2 (green) expression is increased in sepsis. ZO-1 (red) is unchanged and shown for reference. (E) Claudin-15 (green) expression is reduced in sepsis. Occludin (red) is unhanged and shown for reference. n = 57 healthy controls (23 for macrophages) and 27 septic patients. Each point represents a unique subject/patient. *P < 0.05; **P < 0.01; ***P < 0.001. NaK ATPase (blue) is shown for reference in panels (BE). Scale bars, 100 μm and 20 μm (Insets).
Fig. 2.
Fig. 2.
Tight junction protein expression changes after CLP recapitulate human sepsis. (A) Representative histopathology of jejunal tissue from a sham control (Left) and CLP (Right) mouse. (B) Pore pathway permeability, measured as the ratio of creatinine to 70-kDa dextran recovery, at 12 h after sham or CLP. Sham controls (green) and CLP (red) mice are shown. (C) Ki67 (red) staining of jejunal tissue shows proliferating cells. Nuclear stain (Hoechst 33258, green) is shown for reference. (D) Claudin-2 (green) expression is increased in jejunal enterocytes after CLP. ZO-1 (red) is unhanged and shown for reference. (E) Claudin-15 (green) expression is reduced in jejunal enterocytes after CLP. Occludin (red) is unhanged and shown for reference. (F) Neither claudin-4 (green) nor occludin (red) expression are changed after CLP. (G) Colonic claudin-2 expression is upregulated after CLP. n = 3 to 8 for each condition. Each point represents a unique mouse. *P < 0.05; **P < 0.01; ***P < 0.001. NaK ATPase (blue) is shown for reference in panels (CG). Scale bars, 100 μm and 20 μm (Insets).
Fig. 3.
Fig. 3.
CLP causes claudin-2-dependent increases in pore pathway permeability and limits epithelial damage (unrestricted pathway) flux. (A) Paracellular flux across tight junctions is mediated by two distinct routes, pore and leak pathways, which can be measured by creatinine (6 Å diameter) and 4-kDA dextran (28 Å diameter) flux, respectively. Permeability of the nonselective unrestricted pathway is assessed using 70-kDa dextran (120 Å diameter). (B) Creatinine flux (pore pathway permeability) increases 12 h after CLP in WT (red), but not claudin-2 KO (pink), mice. (C) 4-kDa dextran flux (leak pathway permeability) is greater in both WT and claudin-2 KO mice at 12 h after CLP. 4-kDa dextran permeability increases further at 24 h. (D) Permeability of the epithelial damage-dependent unrestricted pathway increases in WT, but not claudin-2 KO, mice within 24 h after CLP. (E) Representative jejunal histopathology of WT or claudin-2 KO mice 12 h after sham or CLP. The degree of submucosal edema (green arrows) and intraepithelial neutrophil infiltration (red arrows) in WT mice is greater than in claudin-2 KO mice. Scale bar, 50 µm. (F) Jejunal edema and inflammation, measured as wet to dry ratio, is significantly higher in WT, relative to claudin-2 KO, mice at 24 h after CLP. This correlates with a greater degree of small intestinal shortening after CLP in WT, relative to claudin-2 KO, mice. Scale bar, 1 cm. (G) CLP causes similar decreases in numbers of Ki67+ proliferating cells (red) within WT and claudin-2 KO mice at 12 h. Nuclei (Hoechst 33258, green) and NaK ATPase (blue) are shown for reference. n = 6 to 8 for each genotype at each time point. Scale bar, 20 µm. *P < 0.05; **P < 0.01; ***P < 0.001.
Fig. 4.
Fig. 4.
Claudin-2 expression augments mucosal immune activation. (A) Representative immunofluorescent staining of myeloperoxidase-positive neutrophils (green) and F4/80-positive macrophages (red). The graphs show numbers of neutrophils and macrophages within mucosa of sham WT (green) and claudin-2 KO (light green) and CLP WT (red) and claudin-2 KO (pink) mice. (B) Mucosal CD3+CD4- (green) and CD3+CD4+ (yellow) T cell infiltration is similar across all conditions. (C) Flow cytometric plot and graph of CD8αβ IEL numbers 24 h after CLP. (D) Flow cytometric plot and graph of IL-17 producing TCRγδ IELs after CLP. (E) Cytokine mRNA expression shows that claudin-2 KO mice have reduced IL-1β and IL-6 transcription, relative to WT, at 24 h after CLP. (F) Within Peyer's patches, the fractions of CD4+CD69+, CD4+CD25+, and CD8+CD25+ lymphocytes among all CD3+ cells were significantly greater in WT, relative to claudin-2 KO, mice. n = 5 to 12 for each condition. *P < 0.05; **P < 0.01; ***P < 0.001. NaK ATPase (blue) is shown for reference (A and B). Scale bars, 100 μm, 20 μm (Insets).
Fig. 5.
Fig. 5.
Intestinal epithelial claudin-2 expression exacerbates peritonitis and increases mortality after CLP. (A) Renal tubular claudin-2 expression is not affected by CLP. n = 8 sham and 8 CLP mice. Scale bar, 20 µm. (B) Hepatocellular claudin-2 expression is not affected by CLP. n = 8 sham and 8 CLP mice. Scale bar, 5 µm. (C) Serum creatinine and renal histology of WT and claudin-2 KO mice at 24 h after CLP. Scale bar, 50 μm. (D) Serum AST and liver histology of WT and claudin-2 KO mice at 24 h after CLP. Alanine aminotransferase (ALT) was below detection limits in all mice. (Scale bar, 20 μm.) (E) The peritoneal fluid of WT mice (red) contains significantly more IL-10 than that of claudin-2 KO mice (pink) at 24 h after CLP. (F) Numbers of neutrophils, macrophages, and dendritic cells were significantly greater in peritoneal fluid of WT (n = 8), relative to claudin-2 KO (n = 8), mice at 24 h after CLP. (G) Representative histology showing greater neutrophilic infiltration of subserosal adipose tissue and more extensive peritonitis in WT, relative to claudin-2 KO, mice. Scale bars, 100 μm, 20 μm (Insets). (H) Bacteremia was not different between groups. (I) CLP-induced weight loss did not occur in claudin-2 KO mice. (J) Claudin-2 KO mice displayed 90% survival at 168 h (7 d) after CLP relative to only 50% survival of WT mice. n = 20/both WT and KO in the survival curve. *P < 0.05; **P < 0.01; ***P < 0.001.
Fig. 6.
Fig. 6.
Claudin-2 KO enhances survival by modifying sepsis-associated dysbiosis. (A) Microbial taxonomies of WT and claudin-2 KO mice before (n = 12/genotype) and 24 h after (n = 16/genotype) CLP. Each bar represents an individual mouse. (B) Relative Firmicute spp. abundances within the microbiota of WT and claudin-2 KO mice before (n = 12/genotype) and 24 h after (n = 16/genotype) CLP. (C) Relative Bacteroidetes spp. abundances within the microbiota of WT and claudin-2 KO mice before (n = 12/genotype) and 24 h after (n = 16/genotype) CLP. (D) Design of cecal slurry experiment. (E) Mortality was significantly lower when healthy WT mice received cecal slurry from septic claudin-2 KO than when healthy WT mice received cecal slurry from septic WT mice (n = 15 recipients received cecal slurry from septic mice of each genotype).

Similar articles

Cited by

References

    1. Rudd K. E., et al. , Global, regional, and national sepsis incidence and mortality, 1990–2017: Analysis for the Global Burden of Disease Study. Lancet 395, 200–211 (2020). - PMC - PubMed
    1. Buchman T. G., et al. , Sepsis among medicare beneficiaries: 1. The burdens of sepsis, 2012–2018. Crit. Care Med. 48, 276–288 (2020). - PMC - PubMed
    1. Evans L., et al. , Surviving sepsis campaign: International guidelines for management of sepsis and septic shock 2021. Crit. Care Med. 49, e1063–e1143 (2021). - PubMed
    1. Levy M. M., et al. , Mortality changes associated with mandated public reporting for sepsis. The results of the New York State initiative. Am. J. Respir. Crit. Care Med. 198, 1406–1412 (2018). - PMC - PubMed
    1. Santacruz C. A., Pereira A. J., Celis E., Vincent J. L., Which multicenter randomized controlled trials in critical care medicine have shown reduced mortality? A systematic review. Crit. Care Med. 47, 1680–1691 (2019). - PubMed

LinkOut - more resources