. 2024 Mar 5;121(10):e2312150121.
doi: 10.1073/pnas.2312150121. Epub 2024 Feb 27.

Single-cell profiling of African swine fever virus disease in the pig spleen reveals viral and host dynamics

Affiliations

Single-cell profiling of African swine fever virus disease in the pig spleen reveals viral and host dynamics

Zixiang Zhu et al. Proc Natl Acad Sci U S A. .

Abstract

African swine fever, one of the major viral diseases of swine, poses an imminent threat to the global pig industry. The high-efficient replication of the causative agent African swine fever virus (ASFV) in various organs in pigs greatly contributes to the disease. However, how ASFV manipulates the cell population to drive high-efficient replication of the virus in vivo remains unclear. Here, we found that the spleen reveals the most severe pathological manifestation with the highest viral loads among various organs in pigs during ASFV infection. By using single-cell-RNA-sequencing technology and multiple methods, we determined that macrophages and monocytes are the major cell types infected by ASFV in the spleen, showing high viral-load heterogeneity. A rare subpopulation of immature monocytes represents the major population infected at late infection stage. ASFV causes massive death of macrophages, but shifts its infection into these monocytes which significantly arise after the infection. The apoptosis, interferon response, and antigen-presentation capacity are inhibited in these monocytes which benefits prolonged infection of ASFV in vivo. Until now, the role of immature monocytes as an important target by ASFV has been overlooked due to that they do not express classical monocyte marker CD14. The present study indicates that the shift of viral infection from macrophages to the immature monocytes is critical for maintaining prolonged ASFV infection in vivo. This study sheds light on ASFV tropism, replication, and infection dynamics, and elicited immune response, which may instruct future research on antiviral strategies.

Keywords: African swine fever virus; cellular tropism; host antiviral response; monocytes; single-cell RNA sequencing.


Conflict of interest statement

Competing interests statement:The authors declare no competing interest.

Figures
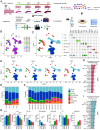
Fig. 1.
Fig. 1.
Study design and differences in cell composition in the spleen throughout ASFV infection. (A) Schematic illustration of the experimental workflow. The scRNA-seq and bulk RNA-seq was applied to obtain comprehensive visualization of transcriptional profiles in the spleen throughout ASFV infection and the output data were used for integrative analyses and verified by multiple experiments. (B) Overview of the cell clusters in the integrated single-cell transcriptomes. Clusters were labeled by FindClusters with resolution 0.8. Each dot represents a single cell. (C) Cellular populations identified. Each dot corresponds to a single cell, colored according to cell type. The Right panel of violin plots represents the expression distribution of selected canonical cell markers in the seven clusters. The columns represent selected marker genes and the rows represent clusters with the same color as in the Left panel. (D) UMAP projection of the samples from day 0, 3, 5, or 7. Each dot represents a single cell, colored according to cell type. (E) Average proportion of each cell type derived from the samples collected on days 0, 3, 5, and 7, respectively. (F) The cell compositions at a single sample level. (G) Condition preference of each cell type. y axis, average percentage of samples across four conditions (days 0, 3, 5, and 7). The time points are shown in different colors. Each bar plot represents one cell type. Error bars represent ±SD for the samples collected at the indicated time point. (H and I) The top 20 viral genes in infected cells, ranked by the expressed frequency on day 5 (H) and day 7 (I).
Fig. 2.
Fig. 2.
Characterization of the generic host response to ASFV infection. (A) Single-cell heterogeneity of intracellular viral loads within the spleens of ASFV-infected pigs. Shown are the percentages of low (light blue), medium (steel blue), and high (dark blue) viral-load states (y axis) within the population of cells containing viral fragments, as identified for each of the seven cell types (x axis). (B) Monocytes and macrophages comprise the main infected cell population in the spleen. (C) The density plot of viral UMIs in the infected macrophages and monocytes on day 5 and day 7. (D) Comparison of log2fold-change (log2FC) of 10,071 intersected genes between scRNA-seq and bulk RNA-seq for 5 dpc vs. 0 dpc. (E) Comparison of log2FC of 10 selected genes determined by scRNA-seq and qPCR analysis in monocytes/macrophages. (F and G) Expression of IFNs, IFN receptors and ISGs, and infection status in macrophages and monocytes during ASFV infection respectively. (H) Boxplot of ISG score in macrophages/monocytes at baseline, uninfected bystanders or infected cells during the infection (5 and 7 dpc). (I) Association between ISG score and the number of viral UMI. (J) Heatmap of IFNs, IFN receptors, and ISGs between 0 and 5 dpc in bulk RNA-seq data. (K) Viral DNA, MX2, or MX1 expression in uninfected bystanders or infected monocytes/macrophages of spleen from ASFV-infected pigs at 5 or 7 dpc determined by qPCR.
Fig. 3.
Fig. 3.
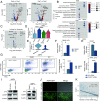
Characterization of macrophage responses in the spleens of ASFV-infected pigs. (A) Volcano plots of DEGs of 5 dpc vs. 0 dpc, or 7 dpc vs. 0 dpc for macrophages. (B) Dot map of the KEGG pathway and GO terms for DEGs between 5 dpc or 7 dpc and 0 dpc in macrophages. (C) Volcano plot of DEGs between infected and bystander macrophages during the infection. (D) DUSP1 expression in macrophages across ASFV infection in vivo. (E) DUSP1 expression in uninfected bystanders or infected macrophages during the infection. (F) qPCR analysis of ASFV B646L expression in DMSO- or BCI-treated PAMs after ASFV infection ex vivo. (G) Evaluation of ASFV replication in DMSO- or BCI-treated PAMs after ASFV infection ex vivo by the FACS method. The Right panel represents the percentage of infected PAMs treated by DMSO or BCI. (H) Evaluation of ASFV replication in NC siRNA or DUSP1 siRNA-transfected PAMs after ASFV infection ex vivo by the qPCR method. Upper: DUSP1 mRNA expression level; Lower: ASFV B646L mRNA expression level. (I) Western blotting analysis of ASFV B646L expression levels in NC siRNA or DUSP1 siRNA-transfected PAMs (Left), and DMSO- or BCI-treated PAMs (Right) after ASFV infection ex vivo, respectively. (J) The replication of ASFV-GFP in NC siRNA or DUSP1 siRNA-transfected PAMs. (K) Association between DUPS1 expression and the number of viral UMIs according to scRNA-seq data analysis.
Fig. 4.
Fig. 4.
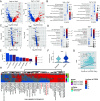
Characterization of monocyte responses in the spleens of ASFV-infected pigs. (A) Volcano plots of DEGs of 5 dpc vs. 0 dpc, or 7 dpc vs. 0 dpc for monocytes. (B) Dot map of KEGG pathway and GO terms for DEGs between 5 dpc or 7 dpc and 0 dpc in monocytes. (C) Volcano map highlighting the most differentially expressed genes between infected and bystander monocytes. (D) Dot map of KEGG pathways and GO terms for DEGs between infected and bystander monocytes. (E) The top-ranked upregulated host genes in the infected monocytes. (F) The mRNA expression levels of the VAPB gene in uninfected bystanders and infected monocytes. (G) Association between VAPB expression and the number of viral UMIs. (H) Heatmap of GSVA t values for hallmark pathways between each infection stage and baseline (Day 0) in monocytes and macrophages.
Fig. 5.
Fig. 5.
Immature monocytes are more permissive to ASFV infection than conventional monocytes. (A) Percentage of different subsets of monocytes in all infected monocytes during the infection (5 and 7 dpc). (B) Smoothed expression of CD14 and CD16 for monocytes during ASFV infection. Boxes: CD14+CD16, CD14CD16+, DN, and DP subsets described in the text; numbers: percentage of cells in each subset at different time points after infection. (C) The infection rates of each subset of monocytes at 5 or 7 dpc determined by the scRNA-seq data. (D) Monocytes marker genes CD14, CD16 and LYZ expression in uninfected bystanders or infected monocytes during the infection. (E) The infection rates of each subset of monocytes at 5 or 7 dpc determined by FACS analysis.

References

    1. Gogin A., Gerasimov V., Malogolovkin A., Kolbasov D., African swine fever in the North Caucasus region and the Russian Federation in years 2007–2012. Virus Res. 173, 198–203 (2013). - PubMed
    1. Kim H. J., et al. , Outbreak of African swine fever in South Korea, 2019. Transbound Emerg. Dis. 67, 473–475 (2020). - PubMed
    1. Wen X., et al. , Genome sequences derived from pig and dried blood pig feed samples provide important insights into the transmission of African swine fever virus in China in 2018. Emerging Microbes Infect. 8, 303–306 (2019). - PMC - PubMed
    1. Blome S., Gabriel C., Beer M., Pathogenesis of African swine fever in domestic pigs and European wild boar. Virus Res. 173, 122–130 (2013). - PubMed
    1. Dixon L., Sun H., Roberts H., African swine fever. Antiviral Res. 165, 34–41 (2019). - PubMed

LinkOut - more resources