. 2024 Jul;22(7):1989-2006.
doi: 10.1111/pbi.14319. Epub 2024 Feb 27.

The TaSnRK1-TabHLH489 module integrates brassinosteroid and sugar signalling to regulate the grain length in bread wheat

Affiliations

The TaSnRK1-TabHLH489 module integrates brassinosteroid and sugar signalling to regulate the grain length in bread wheat

Jinyang Lyu et al. Plant Biotechnol J. 2024 Jul.

Abstract

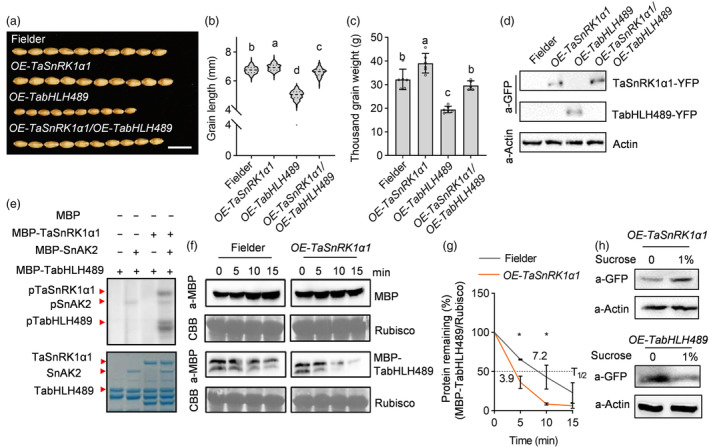
Regulation of grain size is a crucial strategy for improving the crop yield and is also a fundamental aspect of developmental biology. However, the underlying molecular mechanisms governing grain development in wheat remain largely unknown. In this study, we identified a wheat atypical basic helix-loop-helix (bHLH) transcription factor, TabHLH489, which is tightly associated with grain length through genome-wide association study and map-based cloning. Knockout of TabHLH489 and its homologous genes resulted in increased grain length and weight, whereas the overexpression led to decreased grain length and weight. TaSnRK1α1, the α-catalytic subunit of plant energy sensor SnRK1, interacted with and phosphorylated TabHLH489 to induce its degradation, thereby promoting wheat grain development. Sugar treatment induced TaSnRK1α1 protein accumulation while reducing TabHLH489 protein levels. Moreover, brassinosteroid (BR) promotes grain development by decreasing TabHLH489 expression through the transcription factor BRASSINAZOLE RESISTANT1 (BZR1). Importantly, natural variations in the promoter region of TabHLH489 affect the TaBZR1 binding ability, thereby influencing TabHLH489 expression. Taken together, our findings reveal that the TaSnRK1α1-TabHLH489 regulatory module integrates BR and sugar signalling to regulate grain length, presenting potential targets for enhancing grain size in wheat.

Keywords: SnRK1; TabHLH489; brassinosteroid; sugar; wheat grain length.


Conflict of interest statement

The authors declare that there are no competing interests.

Figures

Figure 1
Figure 1
Map‐based cloning of grain length regulating gene TabHLH489. (a, b) Manhattan plot (a) and LD heatmap (b) showing the significant peak for wheat grain length on chromosome 2D. The horizontal dashed black line indicates the significance threshold P value (P = 1.0E−04) for marker‐trait associations. The 10‐Mb region surrounding peak marker of qGL2D was indicated by dashed red vertical lines and a LD heatmap for pairwise R 2 value of markers in this region was shown with white to black represents R 2 = 0–1. The leading SNP and gene TabHLH489 were indicated by red and blue asterisks, respectively. (c) The distribution of grain length between haplotypes defined by the leading SNP on chromosome 2D. Significance was determined by Student's t‐test (n = 364). (d) The candidate gene for grain length was fine‐mapped to a 346.2 Kb region between markers CAPS91 and IN95. Boxs in white and black indicate SX and CS genotype of regions, respectively. ‘r’ indicates number of recombinants. Markers' information was listed in Table S2. (e) Progeny testing of homozygous recombinants (BC3F4) was used to narrow down the candidate region. The grains (n > 100) came from six individual plants on average. Different letters above bars indicate statistically significant differences between samples (one‐way ANOVA, P < 0.05, n ≥ 6). (f) Predicted candidate genes in the narrowed region according to the International Wheat Genome Sequencing Consortium wheat genome (IWGSC, RefSeq V1.1). (g) Association analysis of TraesCS2D02G499200 expression level and grain length in 10‐DPA seeds of 102 representative wheat varieties. Different lowercase letters indicate statistically significant differences between samples (one‐way ANOVA, P < 0.05).
Figure 2
Figure 2
TabHLH489 negatively regulates wheat grain development. (a–c) Wheat grain morphology of CS, SX and NIL qGL2D . The grains (n > 100) came from six individual plants on average. Scale bar = 1 cm. (d) Quantitative RT‐PCR analysis of the expression level of TabHLH489 in 5‐DPA seeds of CS and NIL qGL2D . Error bars indicate ±SD from three biological repeats. TaADPRF was used as an internal control. (e, f) Plant architecture of Fielder, OE‐TabHLH489 and TabHLH489 knockout plants at the heading stage. Error bars indicate ±SD (n ≥ 6). Scale bar = 10 cm. (g–j) Wheat grain morphology of Fielder, OE‐TabHLH489 and TabHLH489 knockout plants. The grains (n > 300) came from six individual plants on average. Scale bar = 1 cm. Different letters above bars indicate statistically significant differences between samples (one‐way ANOVA, P < 0.05). ‘***’ indicates statistically significant differences between samples (Student's t‐test, P < 0.001).
Figure 3
Figure 3
TabHLH489 inhibits wheat pericarp cell elongation. (a) Differentially expressed genes (DEGs) in seeds of Fielder and OE‐TabHLH489 at 5‐DPA stage. (b) GO analysis of DEGs regulated by TabHLH489. (c) Heatmap analysis of cell wall development related genes Xyloglucan endotransglucosylase/hydrolases (XTHs) and Expansins (EXPs) regulated by TabHLH489 in 5‐DPA seeds. (d) Quantitative RT‐PCR analysis the expression of TaEXPA2 and TaEXPA4 in 5‐DPA seeds of Fielder, OE‐TabHLH489 and tabhlh489‐aabbdd mutant. Error bars indicate ±SD (n = 3). TaADPRF was used as an internal control. (e, f) The grain pericarp cell length of 15‐DPA seeds from Fielder, OE‐TabHLH489 and TabHLH489 knockout plants. The cells (n > 100) came from six individual plants on average. Scale bar = 50 μm. Different letters above bars indicates statistically significant differences between samples (two‐way ANOVA [d], one‐way ANOVA [f], P < 0.05).
Figure 4
Figure 4
TaSnRK1α1 interacts with TabHLH489 and promotes wheat grain development. (a) TaSnRK1α1 interacts with TabHLH489 in yeast. (b) TaSnRK1α1 directly interacts with TabHLH489 in vitro. Glutathione agarose beads loaded with GST‐TaSnRK1α1 were incubated with equal amounts of MBP or MBP‐TabHLH489. Proteins bound to GST‐TaSnRK1α1 were detected by immunoblot analysis with an anti‐MBP antibody. The red asterisk indicates the MBP‐TabHLH489 protein band. (c) Confocal images of ratiometric bimolecular fluorescence complementation assays showed that TaSnRK1α1 interacts with TabHLH489 in protoplast. nYFP‐H3 indicates nYFP‐Histone3. Scale bar = 20 μm. (d) TaSnRK1α1 interacts with TabHLH489 in plants. Immunoprecipitation was performed using the tobacco leaves transient expressing p35S:TaSnRK1α1‐Myc only or co‐expressing p35S:TaSnRK1α1‐Myc and p35S:TabHLH489‐YFP. The co‐immunoprecipitation experiments were performed using GFP‐Trap agarose beads and the immunoblots were probed with anti‐Myc or anti‐GFP antibodies. (e–g) Wheat grain morphology of Fielder and TaSnRK1α1 overexpression lines. The grains (n > 300) came from six individual plants on average. Scale bar = 1 cm. (h, i) The grain pericarp cell length of Fielder and OE‐TaSnRK1α1 plants. The cells (n > 100) came from six individual plants on average. Scale bar = 50 μm. (j) Quantitative RT‐PCR analysis of the expression of TaEXPA2 and TaEXPA4 in 5‐DPA seeds of Fielder and OE‐TaSnRK1α1 plants. Error bars indicate ±SD (n = 3). TaADPRF was used as an internal control. Different letters above bars indicate statistically significant differences between samples (one‐way ANOVA, P < 0.05). ‘***’ indicates statistically significant differences between samples (Student's t‐test, P < 0.001).
Figure 5
Figure 5
TaSnRK1α1 phosphorylates and destabilizes TabHLH489. (a–c) Wheat grain morphology of Fielder, OE‐TaSnRK1α1, OE‐TabHLH489 and the progenies derived from a cross between OE‐TaSnRK1α1 and OE‐TabHLH489 plants. The grains (n > 100) came from more than five individual plants on average. Scale bar = 1 cm. (d) Immunoblot assay of the protein levels of TabHLH489 and TaSnRK1α1 in Fielder, OE‐TabHLH489, OE‐TaSnRK1α1 and OE‐TaSnRK1α1/OE‐TabHLH489 plants. TaActin was used as the loading control. (e) TaSnRK1α1 phosphorylates TabHLH489 in vitro. Upper image was the gel containing proteins labelled with ATP‐γ‐32p, while the following image was the gel staining with coomassie brilliant blue. (f, g) Degradation of MBP and MBP‐TabHLH489 in cell‐free system from Fielder and OE‐TaSnRK1α1 extracts. Recombinant purified MBP and MBP‐TabHLH489 were added to the protein extracts and incubated at 22 °C for different times. Protein abundance was evaluated using an anti‐MBP antibody. The band intensity was quantified by ImageJ. (h) Sucrose promoted TaSnRK1α1 accumulation but induced TabHLH489 degradation. Total proteins were extracted from 7‐day‐old seedlings of OE‐TaSnRK1α1 and OE‐TabHLH489 plants after a 6‐h treatment with 1% sucrose under light conditions. Different letters above bars indicate statistically significant differences between samples (one‐way ANOVA, P < 0.05). ‘*’ indicate statistically significant differences between samples (Student's t‐test, P < 0.05).
Figure 6
Figure 6
TabHLH489 reduces the BR sensitivity of wheat. (a, b) The flag leaf angles of Fielder, OE‐TabHLH489 and TabHLH489 knockout mutants. Error bars indicate ±SE, scale bar = 5 cm. (c, d) The leaf angles of Fielder, OE‐TabHLH489 and tabhlh489‐aabbdd mutant in the presence of different concentrations of eBL. Error bars indicate ±SE, scale bar = 5 cm. (e) Quantitative RT‐PCR analysis of the expression level of TaCPD and TaD2 in 7‐day‐old Fielder, OE‐TabHLH489 plants with or without 100 nM eBL foliar‐sprayed treatment for 3 h. Error bars indicate ±SD from three biological repeats. TaADPRF was used as an internal control. Different lowercase letters indicate statistically significant differences between samples (one‐way ANOVA, P < 0.05). ‘*’ indicate statistically significant differences between samples (Student's t‐test, P < 0.05).
Figure 7
Figure 7
BR induces wheat grain length by repressing TabHLH489 expression. (a, b) Plant architecture of Fielder, tabri1‐AAbbdd, OE‐TaSK2, task2‐aabbdd and OE‐TaBZR1 at the heading stage. Error bars indicate ±SD (n ≥ 6). Scale bar = 10 cm. (c, d) The flag leaf angles of Fielder, tabri1‐AAbbdd, OE‐TaSK2, task2‐aabbdd and OE‐TaBZR1. Error bars indicate ±SE, Scale bar = 5 cm. (e–g) Wheat grain morphology of Fielder, tabri1‐AAbbdd, OE‐TaSK2, task2‐aabbdd and OE‐TaBZR1. The grains (n > 100) came from six individual plants on average. Scale bar = 1 cm. (h, i) The grain pericarp cell length of 15‐DPA seeds from Fielder, tabri1‐AAbbdd, OE‐TaSK2, task2‐aabbdd and OE‐TaBZR1. The cells (n > 100) came from six individual plants on average. Scale bar = 50 μm. (j) Quantitative RT‐PCR analysis of TabHLH489 expression in 5‐DPA seeds of Fielder, tabri1‐AAbbdd, OE‐TaSK2, task2‐aabbdd and OE‐TaBZR1 plants. Error bars indicate ±SD (n = 3). TaADPRF was used as an internal control. Different lowercase letters indicate statistically significant differences between samples (one‐way ANOVA, P < 0.05). ‘*’ indicate statistically significant differences between samples (Student's t‐test, P < 0.05).
Figure 8
Figure 8
Natural variation in the promoter of TabHLH489 confer grain length variation. (a) A schematic diagram showing the natural variation, putative BRRE motifs (Blue triangles) and open chromatin regions (Red peaks) in the promoter of TabHLH489. TabHLH489 and TabHLH489‐S indicate genes from wheat CS and SX, respectively. ‘[0–30]’ indicates the range of ATAC peaks (Reads Per Kilobase per Million mapped reads, RPKM). Grey boxes indicate the promoter region. Black boxes with arrows indicate the coding sequence. (b) TaBZR1 directly binds to the promoter of TabHLH489. The enrichment value was calculated as the ratio between Fielder and OE‐TaBZR1. Promoter of TaADPRF was used as reference control. Error bars indicate ±SD (n = 3). (c, d) DNA‐protein pull down assay showed the different binding ability of TaBZR1 to P6 fragment from CS and SX. Error bars indicate ±SD (n = 3). (e) The mutation in P6‐SX (pTabHLH489‐S‐mut, containing TCCAaaATCA) declines the TaBZR1's inhibition of pTabHLH489‐S. Wheat protoplasts were transformed with dual luciferase reporter constructs containing pTabHLH489:LUC, pTabHLH489‐S:LUC, pTabHLH489‐S‐mut:LUC and/or constructs overexpressing the effector TaBZR1‐GFP. LUC (Firefly luciferase) activity was normalized to REN (Renilla luciferase) and the LUC/REN ratios of control samples were normalized to one. Error bars indicate ±SD (n = 3). (f) Expression difference of the haplotype TabHLH489‐S (Hap‐S) or TabHLH489 (Hap‐C) in total 102 representative varieties. (g) Grain length variance of 102 representative varieties containing Hap‐S or Hap‐C. ‘*’, ‘**’ and ‘***’ indicate statistically significant differences between samples (Student's t‐test, P < 0.05, P < 0.01 and P < 0.001, respectively).
Figure 9
Figure 9
Breeding selection of TabHLH489 and a working model of BR‐TabHLH489 regulating grain length. (a, b) The frequency of two haplotypes in different category (a) and breeding periods (b) in wheat mini core collections (n = 287). (c) Distribution of Hap‐S and Hap‐C in the major Chinese agro‐ecological zones. The size of pie charts in the geographical map showing the number of cultivars, with percentage of two haplotypes in different colours. (d) Correlation of grain length with the frequency of Hap‐S in 10 ecological zones. (e) A working model of TabHLH489 and TaSnRK1α1 integrating BR and sugar signals to regulate wheat grain length. TabHLH489 acts as a negative regulator of wheat grain length by suppressing the expression of cell‐elongation genes TaEXP2 and TaEXP4. TaSnRK1α1 interacts with and phosphorylates TabHLH489 to promote its degradation, thereby facilitating grain development. Sugar induces the accumulation of TaSnRK1α1 but promotes TabHLH489 degradation. BR promotes wheat grain development by reducing TabHLH489 expression through transcription factor TaBZR1. Natural variations in the promoter of TabHLH489 in CS and SX results in the different expression of TabHLH489 in CS and SX by affecting the binding ability of TaBZR1. Therefore, the TaSnRK1α1‐TabHLH489 regulatory module integrates BR and sugar signalling to regulate wheat grain size. Black bars indicate transcriptional repression. Red arrows and bars indicate posttranslational activating and inhibitory effects on protein. Green dashed lines indicate TabHLH489 produced by gene expression. Blue dashed lines show indirect mechanisms.

Similar articles

Cited by

References

    1. Bai, M.Y. , Fan, M. , Oh, E. and Wang, Z.Y. (2012) A triple helix‐loop‐helix/basic helix‐loop‐helix cascade controls cell elongation downstream of multiple hormonal and environmental signaling pathways in Arabidopsis . Plant Cell, 24, 4917–4929. - PMC - PubMed
    1. Bai, M.Y. , Zhang, L.Y. , Gampala, S.S. , Zhu, S.W. , Song, W.Y. , Chong, K. and Wang, Z.Y. (2007) Functions of OsBZR1 and 14‐3‐3 proteins in brassinosteroid signaling in rice. Proc. Natl. Acad. Sci. USA, 104, 13839–13844. - PMC - PubMed
    1. Barrett, J.C. , Fry, B. , Maller, J. and Daly, M.J. (2005) Haploview: analysis and visualization of LD and haplotype maps. Bioinformatics, 21, 263–265. - PubMed
    1. Che, R. , Tong, H. , Shi, B. , Liu, Y. , Fang, S. , Liu, D. , Xiao, Y. et al. (2015) Control of grain size and rice yield by GL2‐mediated brassinosteroid responses. Nat. Plants, 2, 15195. - PubMed
    1. Cheng, X. , Xin, M. , Xu, R. , Chen, Z. , Cai, W. , Chai, L. , Xu, H. et al. (2020) A single amino acid substitution in STKc_GSK3 kinase conferring semispherical grains and its implications for the origin of Triticum sphaerococcum . Plant Cell, 32, 923–934. - PMC - PubMed

MeSH terms