. 2024 Feb 27;19(2):e0299307.
doi: 10.1371/journal.pone.0299307. eCollection 2024.

Effect of 3-D depth structure, element size, and area containing elements on total-element overestimation phenomenon

Affiliations

Effect of 3-D depth structure, element size, and area containing elements on total-element overestimation phenomenon

Yusuke Matsuda et al. PLoS One. .

Abstract

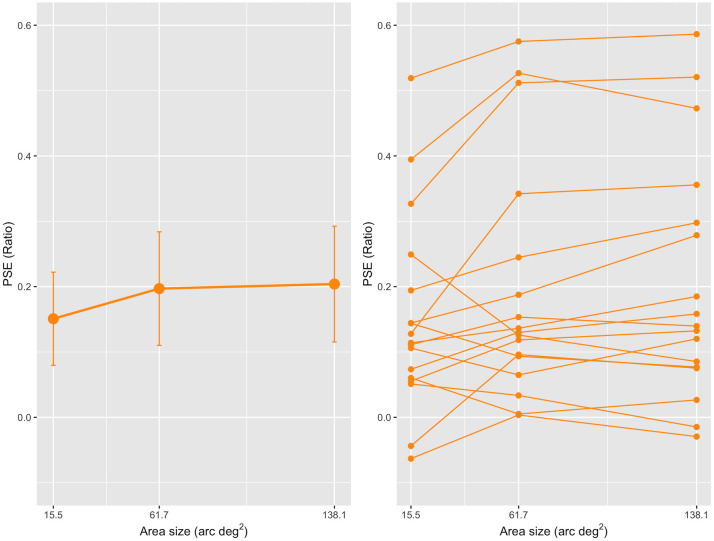
The number of elements distributed in a three-dimensional stimulus is overestimated compared to a two-dimensional stimulus when both stimuli have the same number of elements. We examined the effect of the properties of a three-dimensional stimulus (the number of overlapping stereo surfaces, size of the elements, and size of the area containing elements, on the overestimation phenomenon in four experiments. The two stimuli were presented side-by-side with the same diameters. Observers judged which of the three-dimensional standard and two-dimensional comparison had more elements. The results showed that (a) the overestimation phenomenon occurred for the three-dimensional standard stimuli, (b) the size of the areas affected the amount of overestimation, while the number of overlapping stereo surfaces and size of elements did not, and (c) the amount of overestimation increased when the stimuli included more than 100 elements. Implications of these findings were discussed in the framework of back-surface bias, occlusion, and disparity-processing interference models.


Conflict of interest statement

The authors have declared that no competing interests exist.

Figures

Fig 1
Fig 1. Schematic illustrations of the stimulus and experimental setup.
(A) A schematic top view of the experimental setup. The setup consisted of two displays to stimulate the two eyes independently. (B) A front view of the stimulus that consisted of a 2-D comparison stimulus and a 3-D standard stimulus. While the 3-D standard is illustrated as if it consisted of a front surface with black elements and a back surface with white elements for descriptive purposes, the elements used in both surfaces were black as in the 2-D comparison.
Fig 2
Fig 2. Example of the psychometric function for one observer.
The red circles indicate the ratios of one observer’s responses that judged the number of 2-D (comparison) stimulus elements to be larger than that of 3-D (standard) stimulus elements in each element ratio condition. The ratios were those obtained in Experiment 1. The selected ratios of comparison (y-axis) were plotted against the ERs (x-axis). The red curve indicates the best-fitted curve of the logistic psychometric function (R2 = 0.96). The x-axis value yielding a 0.5 response ratio in the function represents the PSE ratio of the 2-D stimulus, which is indicated by the dotted vertical line. The PSE ratio value shows that the number of the comparison elements appears to be the same as that of the standard elements. In this case, the value was 0.09. If the number of standard stimulus elements is 100 (which is the same as in Experiment 1), a PSE of 0.09 indicates that “the 100 elements of the standard stimulus and the 109 elements of the comparison stimulus are perceived as the same number”.
Fig 3
Fig 3. Results from Experiment 1.
The left panel shows the mean PSE ratios for two types of 3-D stimuli; the left and right bars indicate the mean for the 3-D two-POTS and 3-D volume stimuli, respectively. Each error bar attached to the bar represents a 95% confidence interval (CI). The right panel shows each individual’s PSE ratio for the two-POTS and volume stimuli. The black circles connected by black lines indicate data from the same observers.
Fig 4
Fig 4. Results from Experiment 2.
The left panel shows the mean PSE ratio as a function of the element size of the 3-D two-POTS stimulus. Each error bar attached to the circle represents a 95% confidence interval (CI). The right panel shows each individual’s PSE ratio as a function of the element size. The orange circles connected by orange lines indicate data from the same observers.
Fig 5
Fig 5. Results from Experiment 3.
The left panel shows the mean PSE ratio as a function of the area (arc deg2) of the 3-D two-POTS stimulus. Each error bar attached to the circle represents a 95% confidence interval (CI). The right panel shows each individual’s PSE ratio as a function of the area. The orange circles connected by orange lines indicate data from the same observers.
Fig 6
Fig 6. Results from Experiment 4.
The left two panels show the mean PSE ratio as a function of the area (arc deg2) of the 3-D two-POTS stimulus: the upper (blue circles) and lower (orange circles) panels show the data for the stimulus containing 50 and 150 elements, respectively. Each error bar attached to the circle represents a 95% confidence interval (CI). The two right panels show each individual’s PSE ratio. The upper and lower panels for the stimulus contain 50 and 150 elements, respectively. The circles connected by lines indicate data from the same observers.

Similar articles

References

    1. Allik J, Tuulmets T. Occupancy model of perceived numerosity. Percept Psychophys. 1991;49(4): 303–314. doi: 10.3758/bf03205986 . - DOI - PubMed
    1. Dakin SC, Tibber MS, Greenwood JA, Morgan MJ. A common visual metric for approximate number and density. Proc Natl Acad Sci USA. 2011;108(49): 19552–19557. doi: 10.1073/pnas.1113195108 . - DOI - PMC - PubMed
    1. DeWind NK, Bonner MF, Brannon EM. Similarly oriented objects appear more numerous. J Vis. 2020;20(4): 4–4. doi: 10.1167/jov.20.4.4 . - DOI - PMC - PubMed
    1. Franconeri SL, Bemis DK, Alvarez GA. Number estimation relies on a set of segmented objects. Cognition. 2009;113(1): 1–13. doi: 10.1016/j.cognition.2009.07.002 . - DOI - PubMed
    1. Ginsburg N, Nicholls A. Perceived numerosity as a function of item size. Percept Mot Skills 1988;67(2): 656–658. doi: 10.2466/pms.1988.67.2.656 . - DOI - PubMed