. 2024 Apr 30;195(1):652-670.
doi: 10.1093/plphys/kiae078.

High-quality genome assembly enables prediction of allele-specific gene expression in hybrid poplar

Affiliations

High-quality genome assembly enables prediction of allele-specific gene expression in hybrid poplar

Tian-Le Shi et al. Plant Physiol. .

Abstract

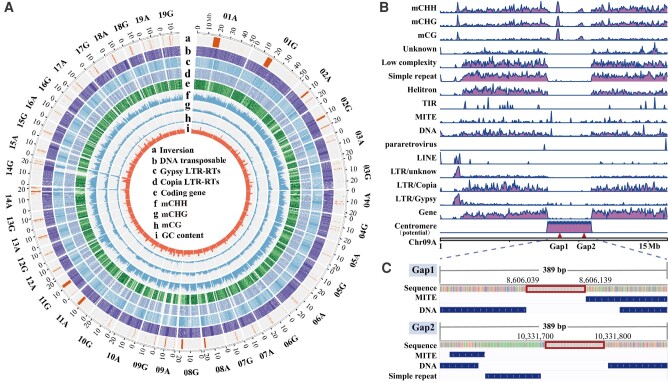
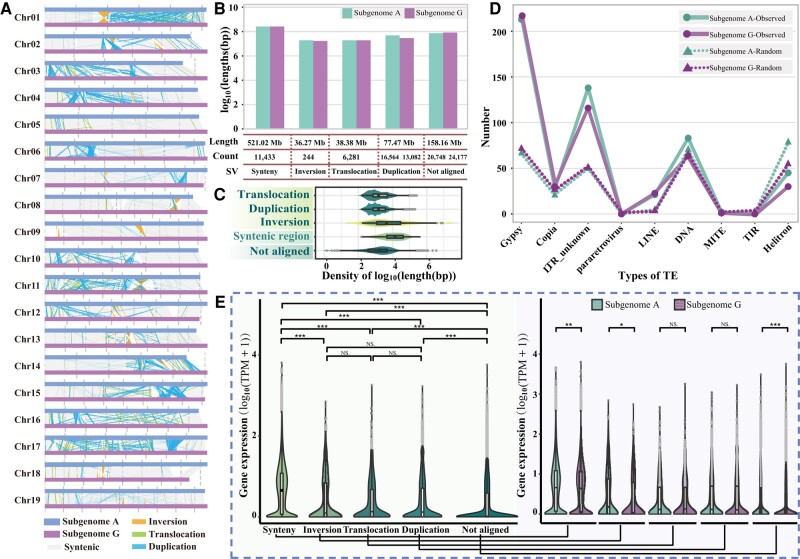
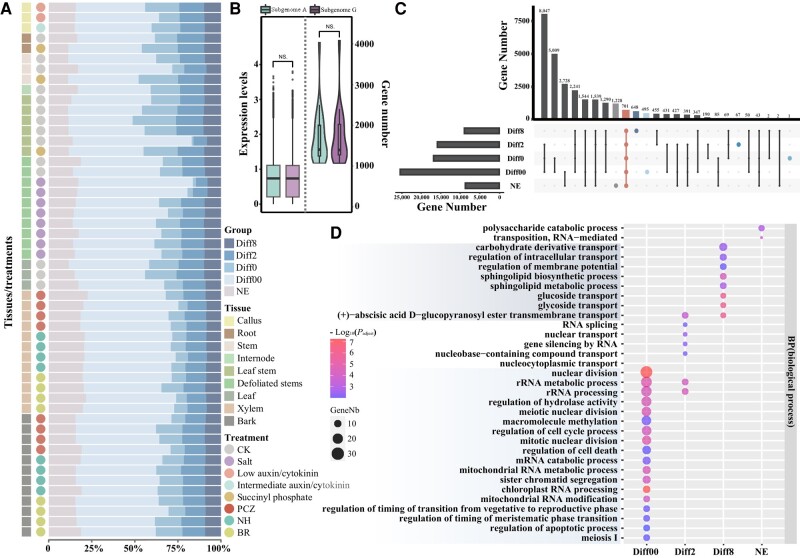
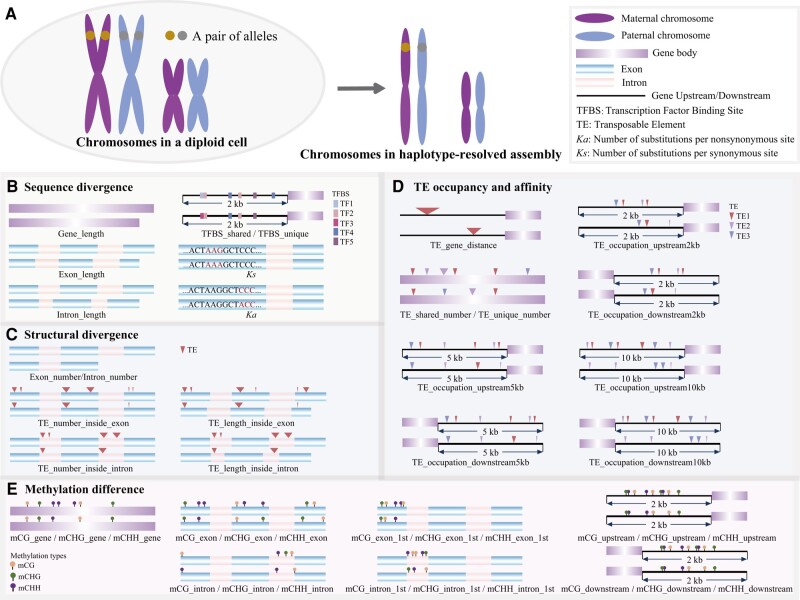
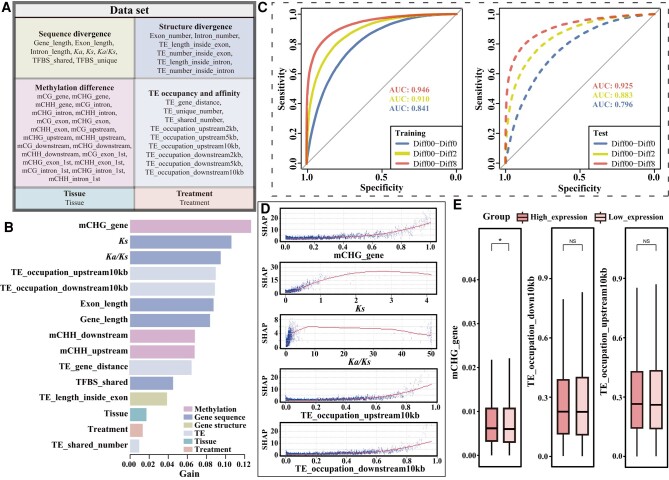
Poplar (Populus) is a well-established model system for tree genomics and molecular breeding, and hybrid poplar is widely used in forest plantations. However, distinguishing its diploid homologous chromosomes is difficult, complicating advanced functional studies on specific alleles. In this study, we applied a trio-binning design and PacBio high-fidelity long-read sequencing to obtain haplotype-phased telomere-to-telomere genome assemblies for the 2 parents of the well-studied F1 hybrid "84K" (Populus alba × Populus tremula var. glandulosa). Almost all chromosomes, including the telomeres and centromeres, were completely assembled for each haplotype subgenome apart from 2 small gaps on one chromosome. By incorporating information from these haplotype assemblies and extensive RNA-seq data, we analyzed gene expression patterns between the 2 subgenomes and alleles. Transcription bias at the subgenome level was not uncovered, but extensive-expression differences were detected between alleles. We developed machine-learning (ML) models to predict allele-specific expression (ASE) with high accuracy and identified underlying genome features most highly influencing ASE. One of our models with 15 predictor variables achieved 77% accuracy on the training set and 74% accuracy on the testing set. ML models identified gene body CHG methylation, sequence divergence, and transposon occupancy both upstream and downstream of alleles as important factors for ASE. Our haplotype-phased genome assemblies and ML strategy highlight an avenue for functional studies in Populus and provide additional tools for studying ASE and heterosis in hybrids.


Conflict of interest statement

Conflict of interest statement. None declared.

Figures

Figure 1.
Figure 1.
Genomic characterization. A) Synteny and distribution of genomic features of the poplar clone “84K”. (a) density of inversions (or inverted regions), (b) distribution of DNA-like transposons, (c) istribution of Gypsy LTR-RTs, (d) distribution of Copia LTR-RTs, (e) distribution of coding genes, (f)–(h) average methylation levels of CHH, CHG, and CG, respectively, and (i) histogram of GC content in 50 kb nonoverlap sliding windows. B) Distribution of DNA methylations, repeat elements around the 2 remaining gaps in the assembly. Two triangles indicate the location of the 2 gaps on chromosome 9A (chr09A). LINE, long interspersed repetitive element; LTR-RT, long terminal repeat retrotransposon; MITE, miniature inverted repeat transposable element; TIR, terminal inverted repeats. C) The detailed location of the gaps and the adjacent repeat elements. The rectangular boxes represent the gaps. The length of each gap was set to 100 bp arbitrarily.
Figure 2.
Figure 2.
SVs and their effects on gene expression. A) SVs between the parental genomes (“G” for the gap-free assembly of P. tremula var. glandulosa and “A” for the assembly of P. alba) with subgenome A as the reference. B) Length and count statistics of SVs between parental genomes. Length represents the sum of the lengths of different types of structural variation between the 2 parental genomes. Counts indicate the number of different types of SV on each of the 2 parental genomes. C) Length distributions of SVs between the parental genomes. D) Statistics on the number of inversion breakpoints (150 bp of each breakpoint site) overlapping with TE in both parental genomes. The solid line represents the observed pattern, and the dashed line represents the pattern from randomization. In boxplots, the center line in the box indicates the median value, and the box height indicates the 25th to 75th percentiles of the total data. Whiskers indicate the 1.5× interquartile range. Points outside the whiskers indicate outliers. E) Different types of SV and gene expression. Difference of gene expression for genes of different SV regions is shown on the left, and the comparison between 2 parental genomes on each SV category is shown on the right. Y-axis indicates the gene expression levels of genes that overlap with the structural variants. Mann-Whitney-Wilcoxon test. *P < 0.05; **P < 0.01; ***P < 0.001; NS, no significant difference. Error bar type is the standard error (SE). The width of each violin represents the density of the data. In boxplots, the center line in the box indicates the median value, and the box height indicates the 25th to 75th percentiles of the total data. Whiskers indicate the 1.5× interquartile range. Points outside the whiskers indicate outliers.
Figure 3.
Figure 3.
ASE. A) Grouping of ASE among samples from different tissues and treatments. Internode (botany), a portion of a plant stem between nodes. BR, brassinosteroid treatment. NH, no hormone treatment. PCZ, propiconazole treatment. B) Comparison on gene expression (the left panel) and gene number (the right panel) between 2 parental genomes (“G” for the gap-free assembly of P. tremula var. glandulosa and “A” for the assembly of P. alba). Mann-Whitney-Wilcoxon test. *P < 0.05; **P < 0.01; ***P < 0.001; NS, no significant difference. In boxplots, the center line in the box indicates the median value, and the box height indicates the 25th to 75th percentiles of the total data. Whiskers indicate the 1.5× interquartile range. C) UpSet plot for 5 categories of ASE (both alleles were not expressed); Diff00: non-significant difference between a pair of alleles with P-adjust > 0.05; Diff0: significant difference between a pair of alleles with P-adjust ≤ 0.05 and FC ≤ |2|; Diff2: significant difference between a pair of alleles with P-adjust ≤ 0.05 and |2| < FC < |8|; Diff8: significant difference between a pair of alleles with P-adjust ≤ 0.05 and FC ≥ |8|. D) GO enrichment test of 5 categories of allelic gene expression. The enriched GO terms with corrected P-value < 0.05 are presented. The color of circles represents the statistical significance of the enriched GO terms. The size of the circles represents the number of genes in a GO term. “P-adjust” is the Benjamini–Hochberg FDR adjusted P-value.
Figure 4.
Figure 4.
Alleles in haplotype-resolved genome assembly and origins of (epi-)genetic features used from machine-learning modeling. A) Schematic chromosomes showing a pair of alleles in a diploid cell and the haplotype-resolved genome assembly. B) Features of sequence divergence between a pair of alleles. C) Features of structural divergence between a pair of alleles. D) Features of difference in TE occupancy and affinity of gene upstream and downstream regions between a pair of alleles. E) Features of methylation difference in upstream, downstream, gene body, exon, and intron regions between a pair of alleles.
Figure 5.
Figure 5.
Machine-learning modeling of ASE and the key factors. A) All features used in machine-learning modeling. B) Ranking of the 15 top features in the XGBoost model (Model 1). Model 1: A XGBoost classification model with 15 predictors (features) and 1 response with 4 groups (Diff00, Diff0, Diff2, and Diff8). Diff00: non-significant difference between a pair of alleles with P-adjust > 0.05; Diff0: significant difference between a pair of alleles with P-adjust ≤ 0.05 and FC ≤ |2|; Diff2: significant difference between a pair of alleles with P-adjust ≤ 0.05 and |2| < FC < |8|; Diff8: significant difference between a pair of alleles with P-adjust ≤ 0.05 and FC ≥ |8|. C) ROC curves and AUC values of the XGBoost model (Model 1). D) SHAP summary plots of the top 5 features in the XGBoost model (Model 1). Each blue dot represents an observation. SHAP: SHapley Additive exPlanations. E) Absolute TPM expression abundance for high and low expression allelic genes in an allele pair. Mann-Whitney-Wilcoxon test. *P < 0.05; **P < 0.01; ***P < 0.001. NS, no significant difference. In boxplots, the center line in the box indicates the median value, and the box height indicates the 25th to 75th percentiles of the total data. Whiskers indicate the 1.5× interquartile range.

References

    1. Bailey TL, Boden M, Buske FA, Frith M, Grant CE, Clementi L, Ren J, Li WW, Noble WS. MEME SUITE: tools for motif discovery and searching. Nucleic Acids Res. 2009:37(Web Server issue):W202–W208. 10.1093/nar/gkp335 - DOI - PMC - PubMed
    1. Bao Y, Hu G, Grover CE, Conover J, Yuan D, Wendel JF. Unraveling cis and trans regulatory evolution during cotton domestication. Nat Commun. 2019:10(1):5399. 10.1038/s41467-019-13386-w - DOI - PMC - PubMed
    1. Bell GD, Kane NC, Rieseberg LH, Adams KL. RNA-seq analysis of allele-specific expression, hybrid effects, and regulatory divergence in hybrids compared with their parents from natural populations. Genome Biol Evol. 2013:5(7):1309–1323. 10.1093/gbe/evt072 - DOI - PMC - PubMed
    1. Bird KA, VanBuren R, Puzey JR, Edger PP. The causes and consequences of subgenome dominance in hybrids and recent polyploids. New Phytol. 2018:220(1):87–93. 10.1111/nph.15256 - DOI - PubMed
    1. Blum A. Heterosis, stress, and the environment: a possible road map towards the general improvement of crop yield. J Exp Bot. 2013:64(16):4829–4837. 10.1093/jxb/ert289 - DOI - PubMed

Publication types