. 2024 Mar 14;187(6):1527-1546.e25.
doi: 10.1016/j.cell.2024.01.028. Epub 2024 Feb 26.

Direct interrogation of context-dependent GPCR activity with a universal biosensor platform

Affiliations

Direct interrogation of context-dependent GPCR activity with a universal biosensor platform

Remi Janicot et al. Cell. .

Abstract

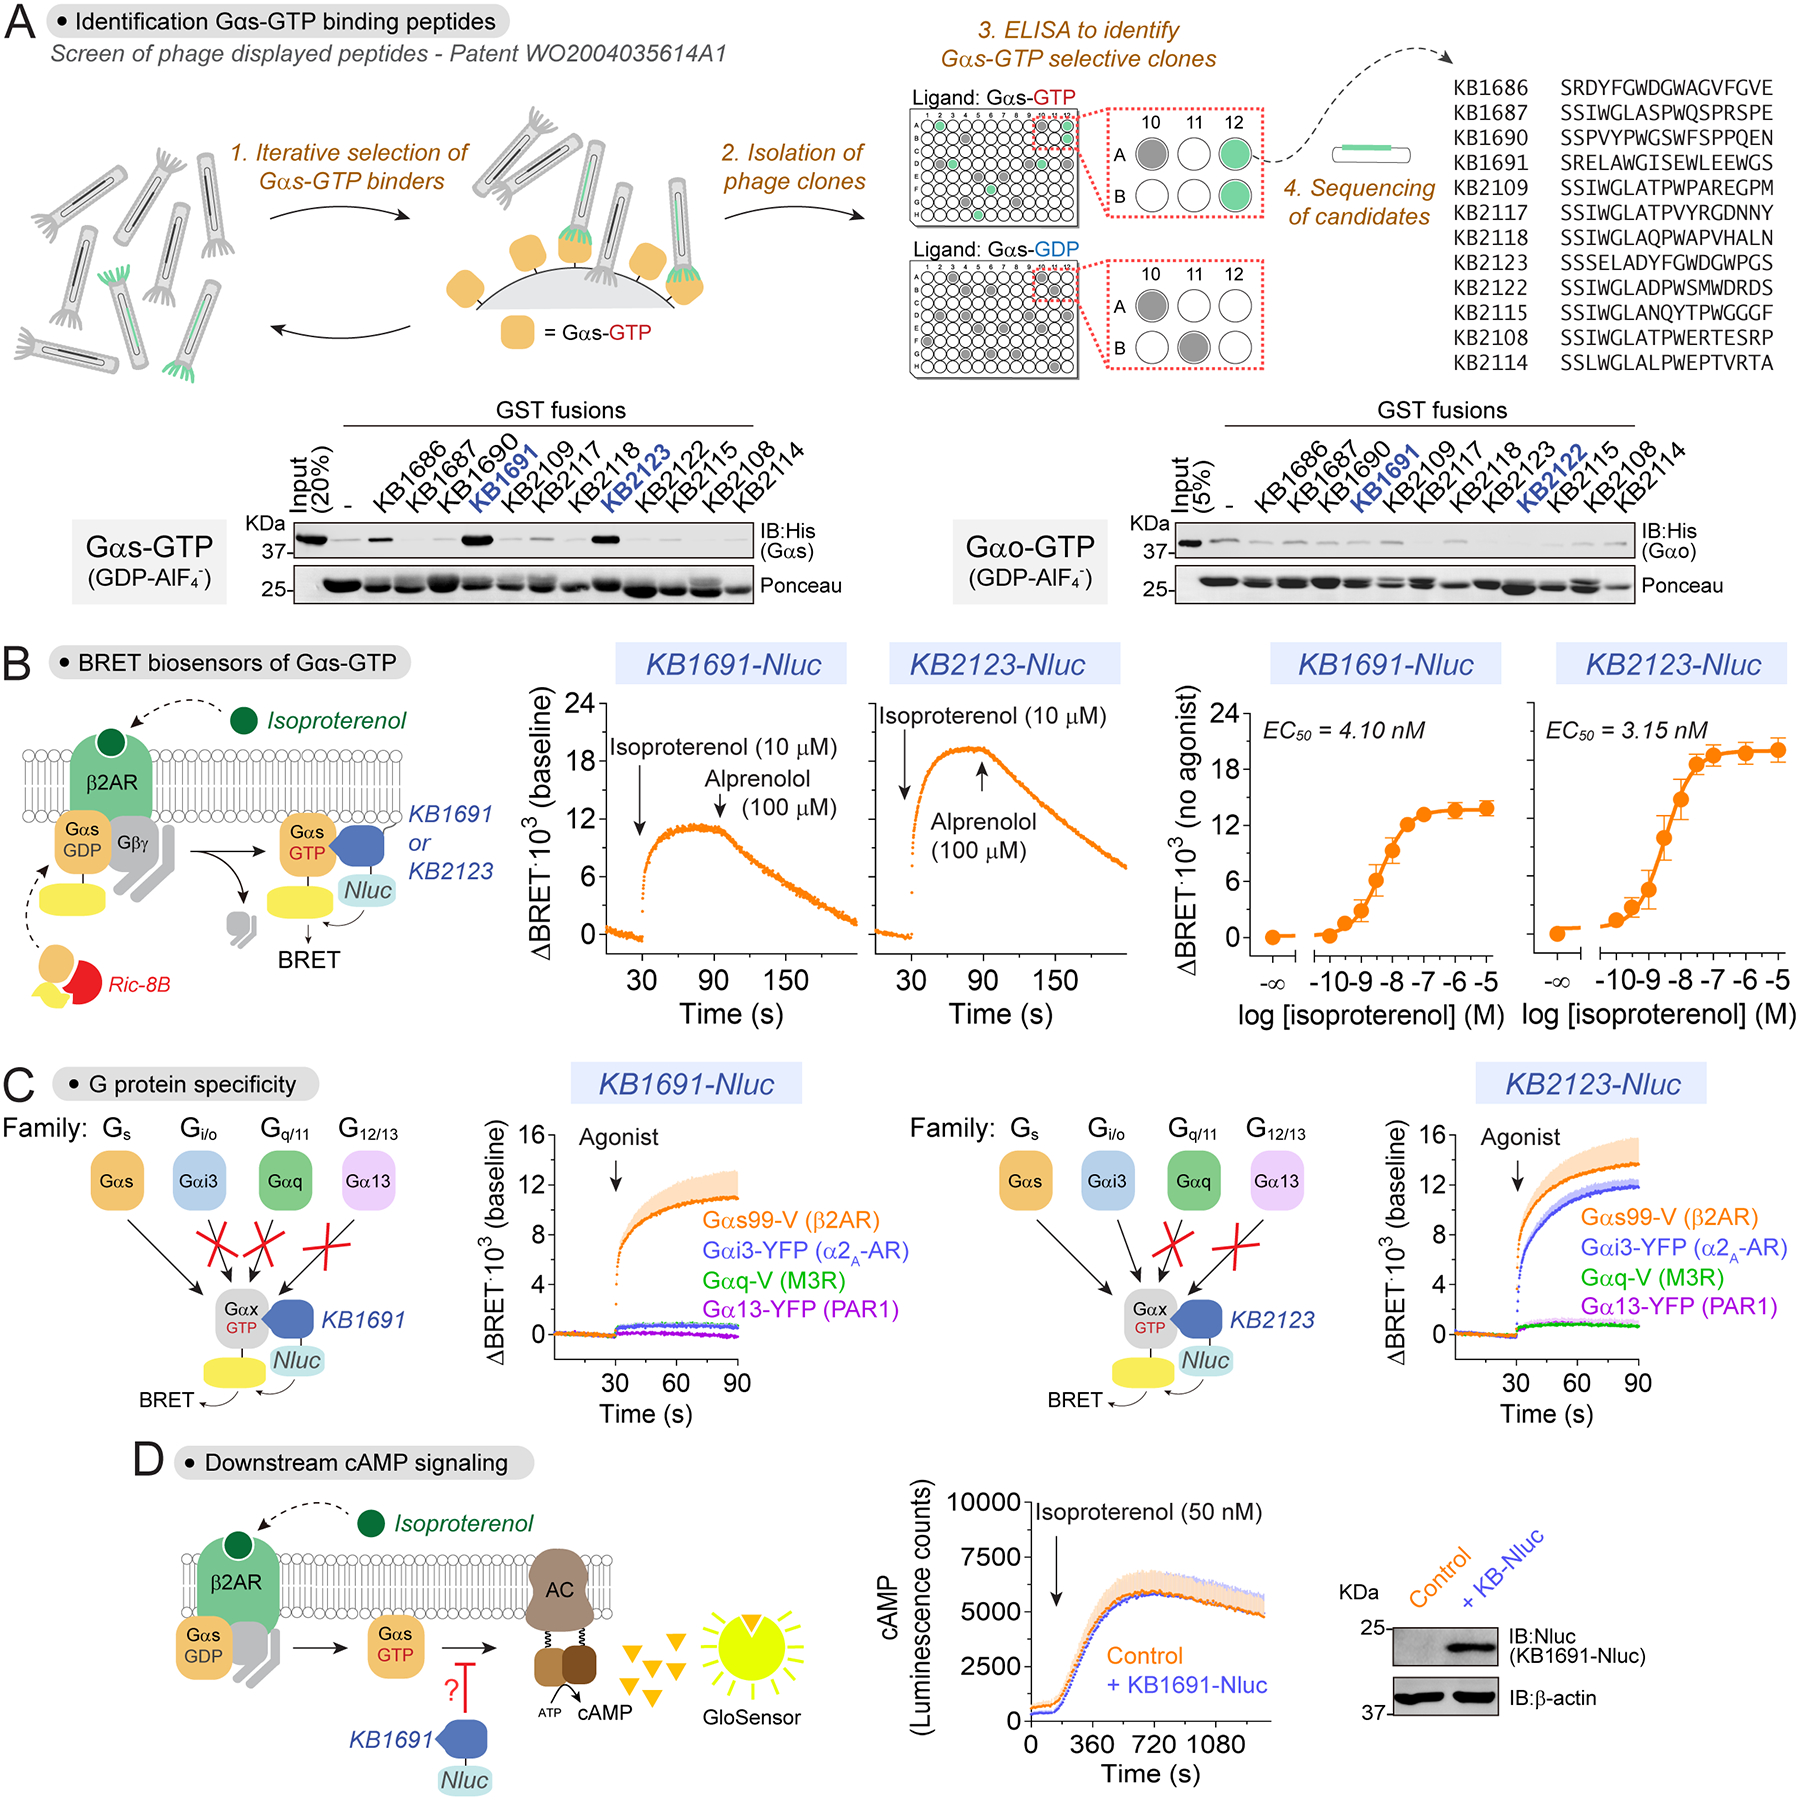
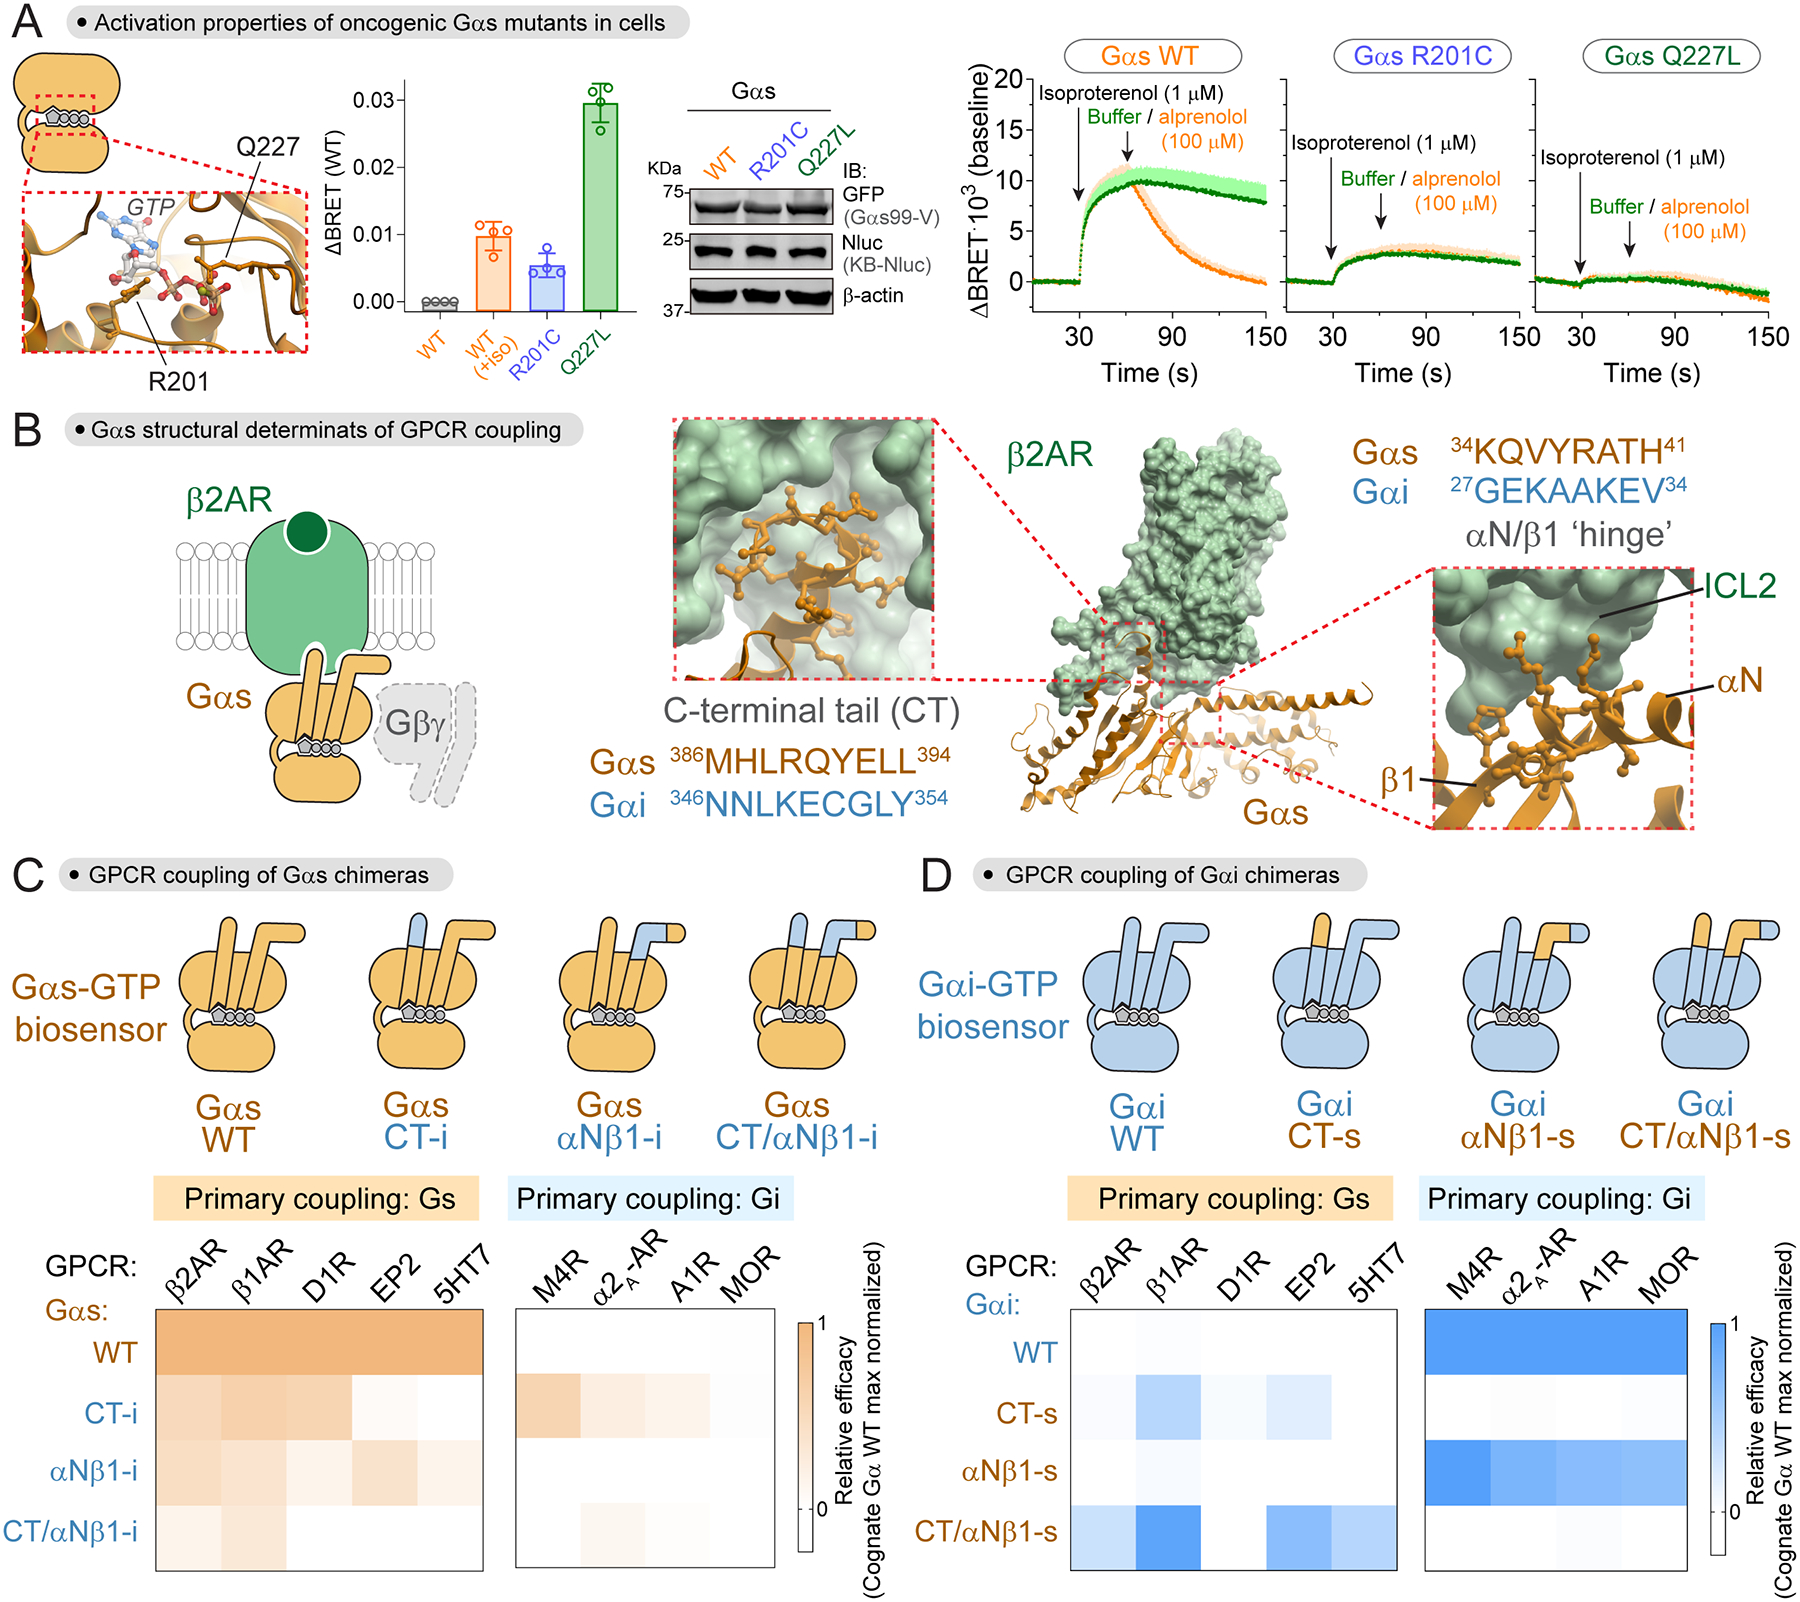
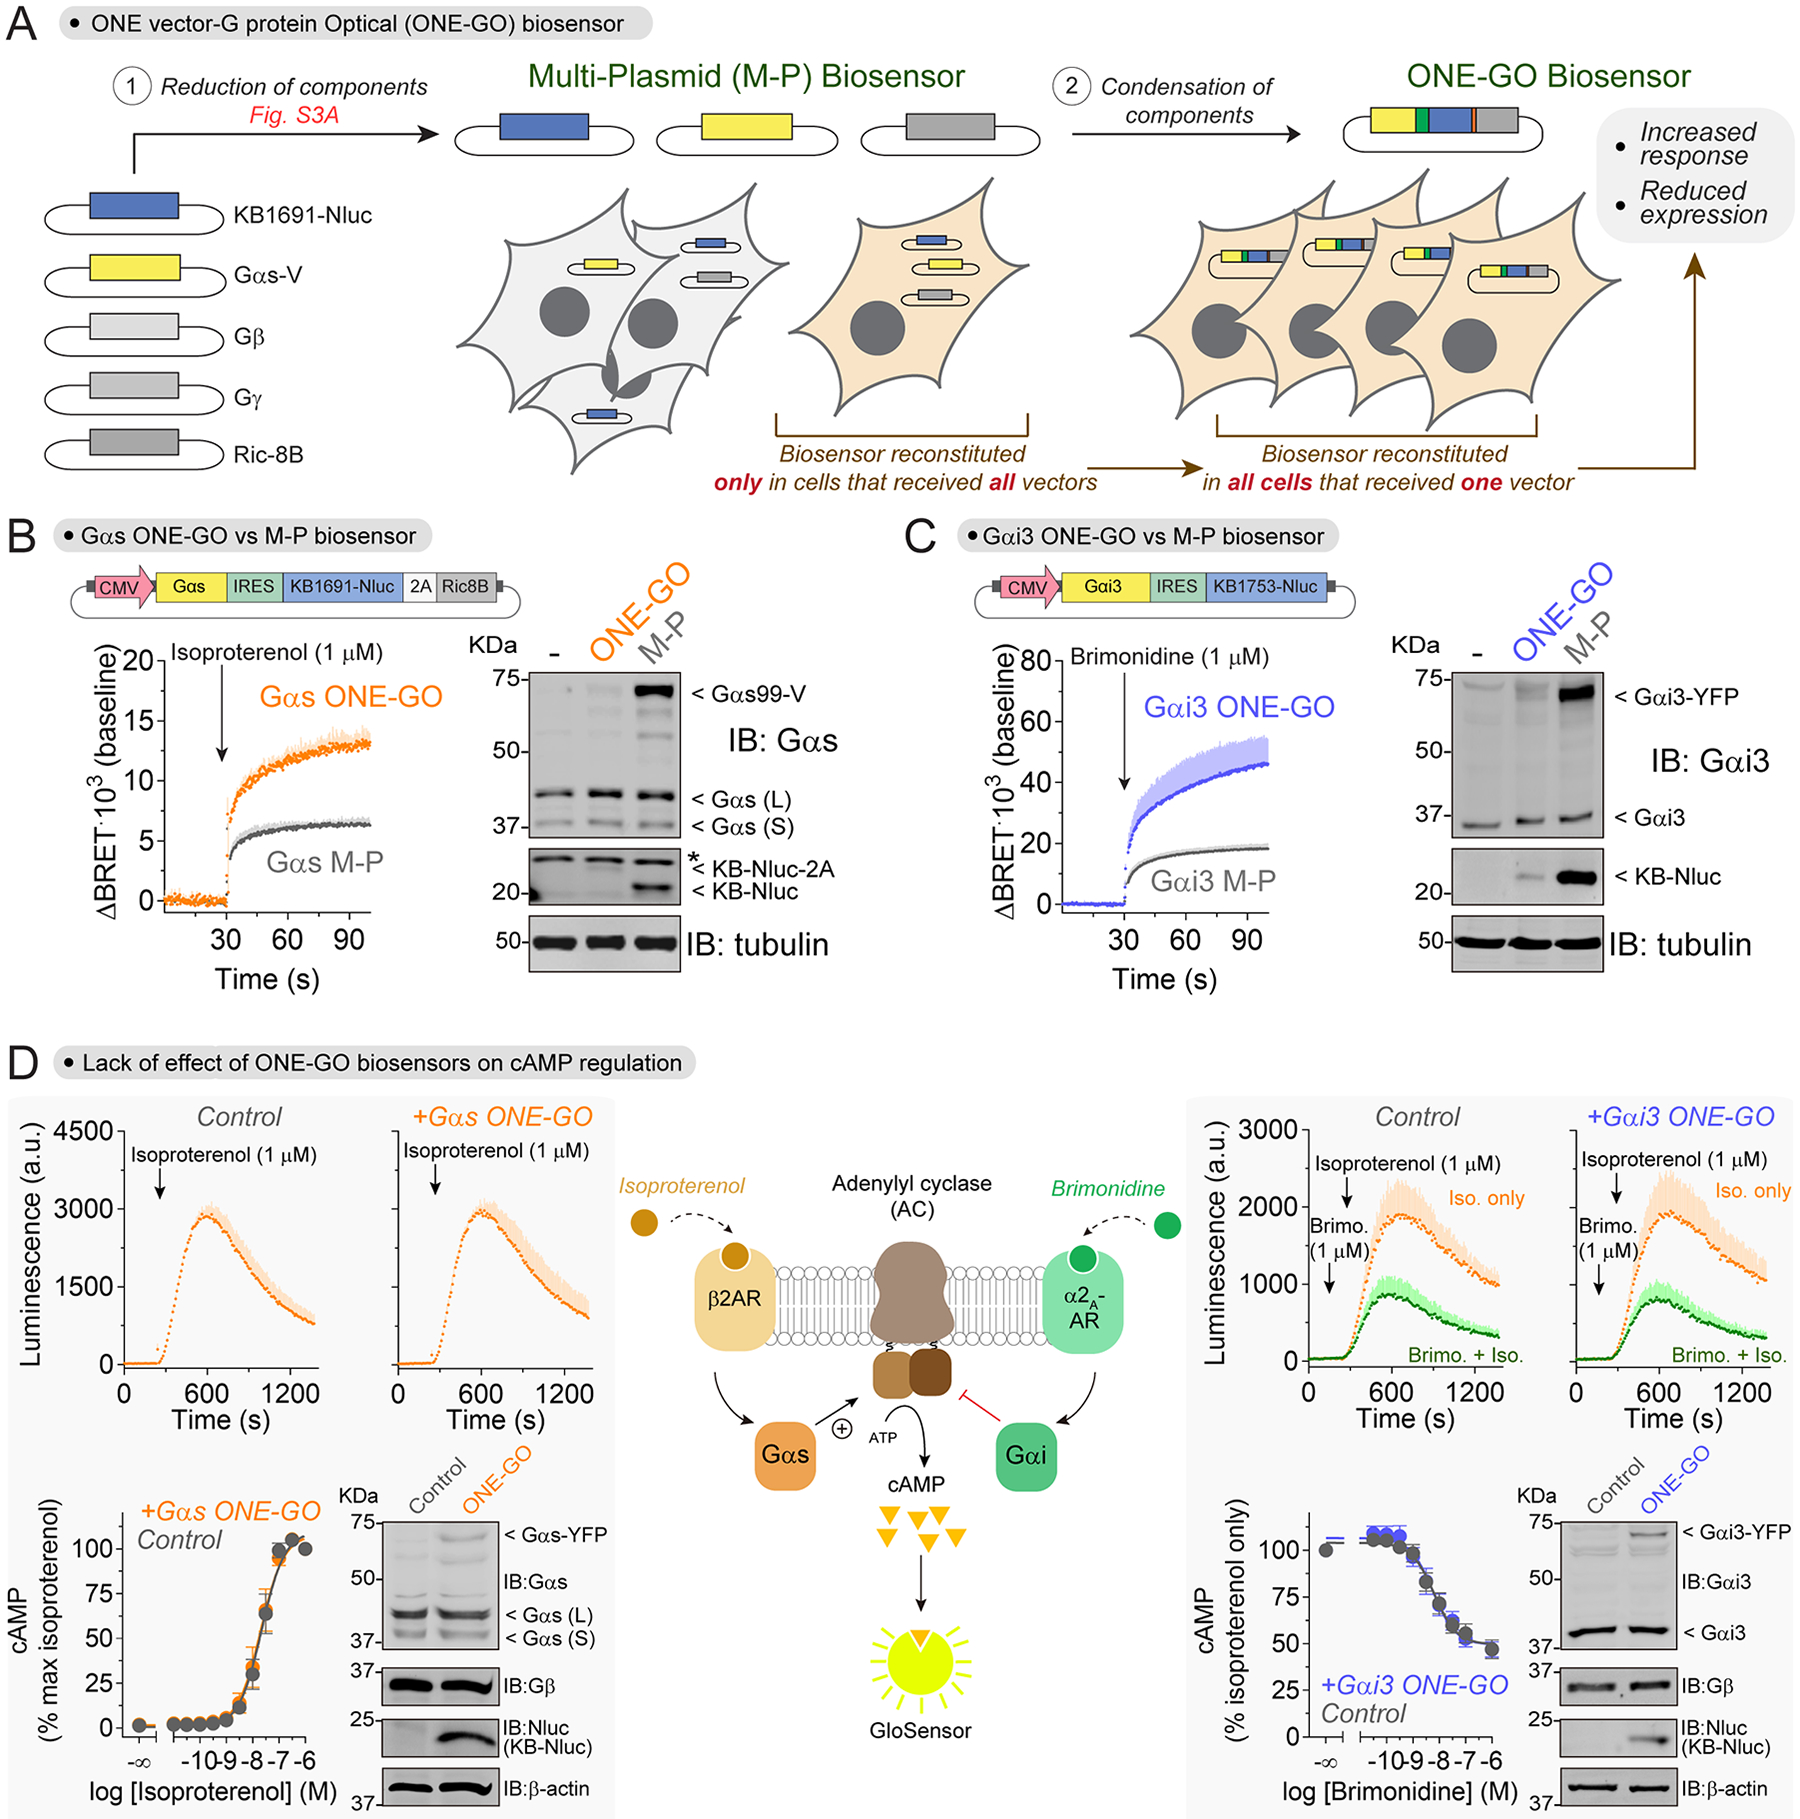
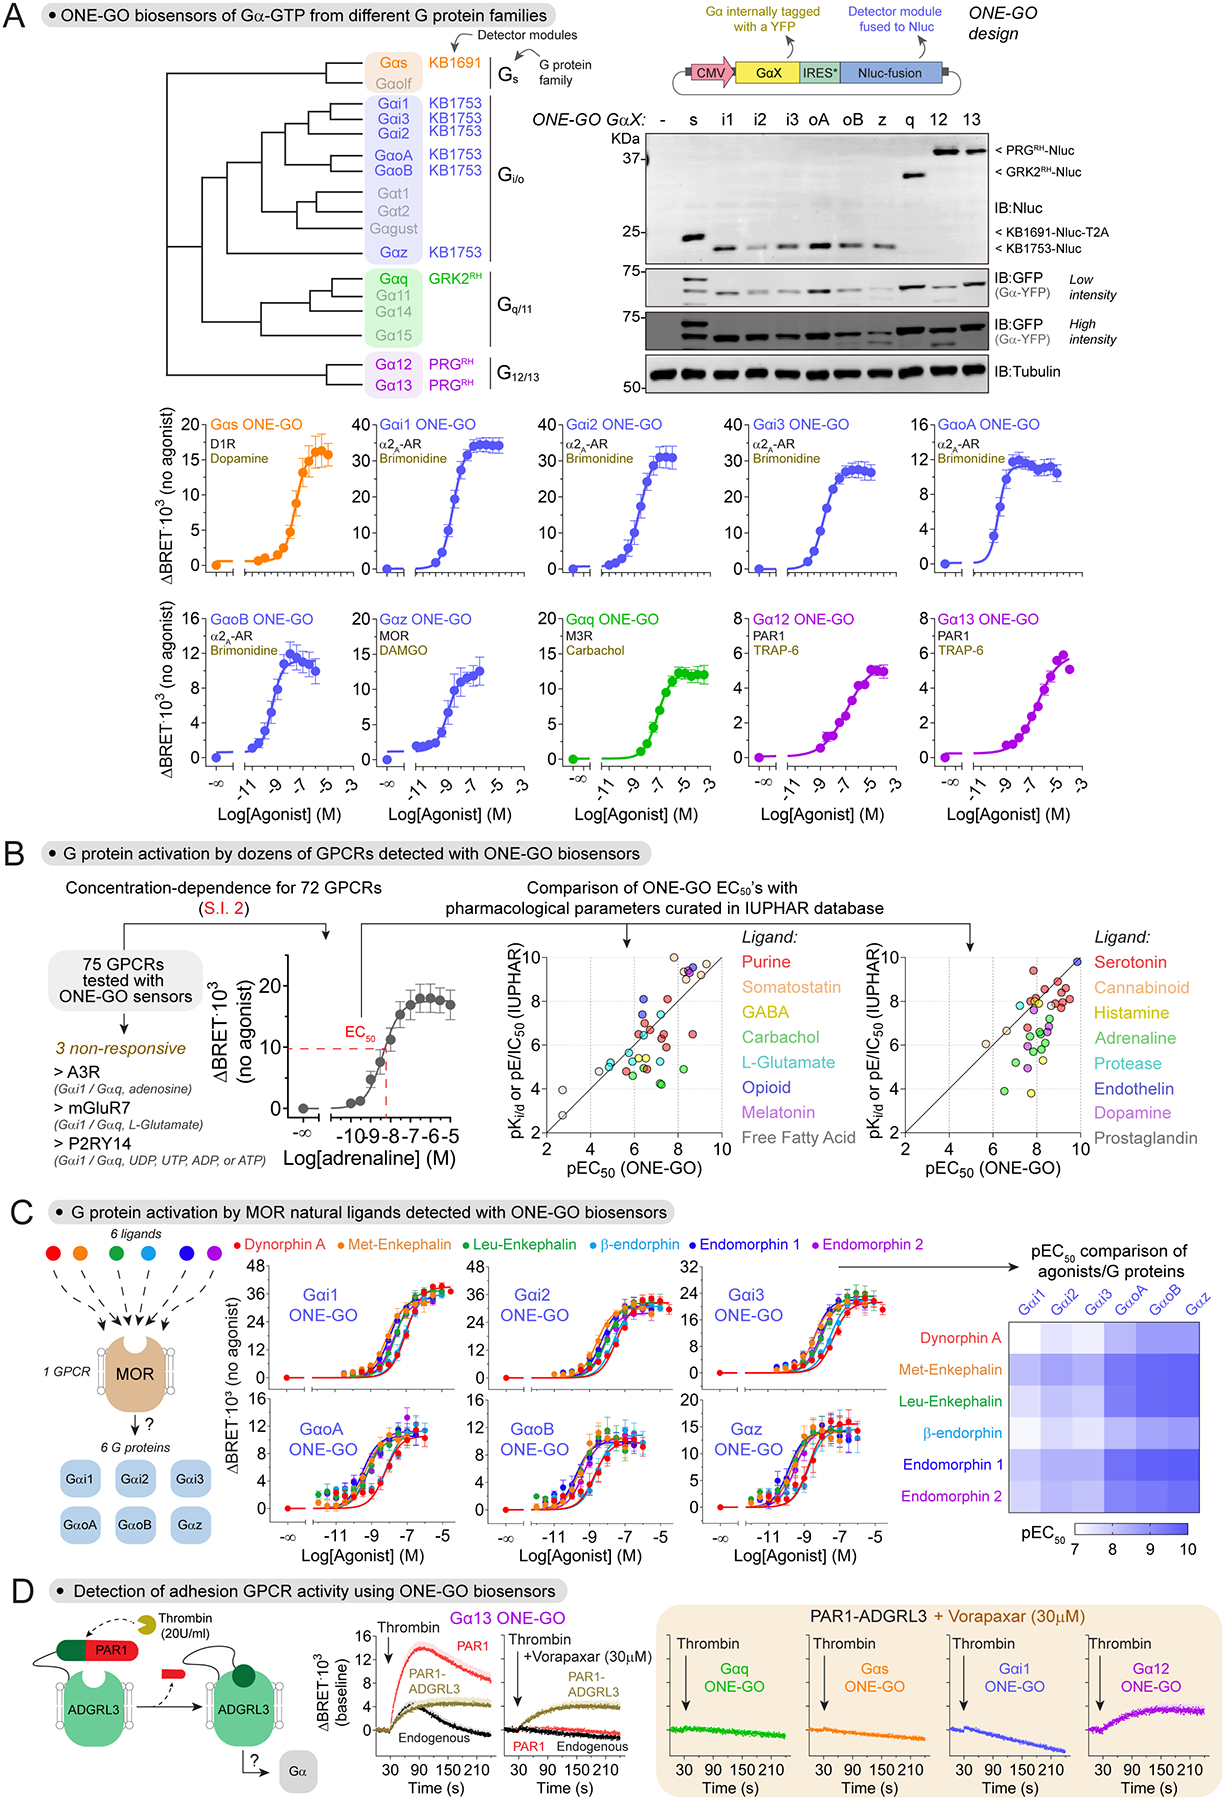
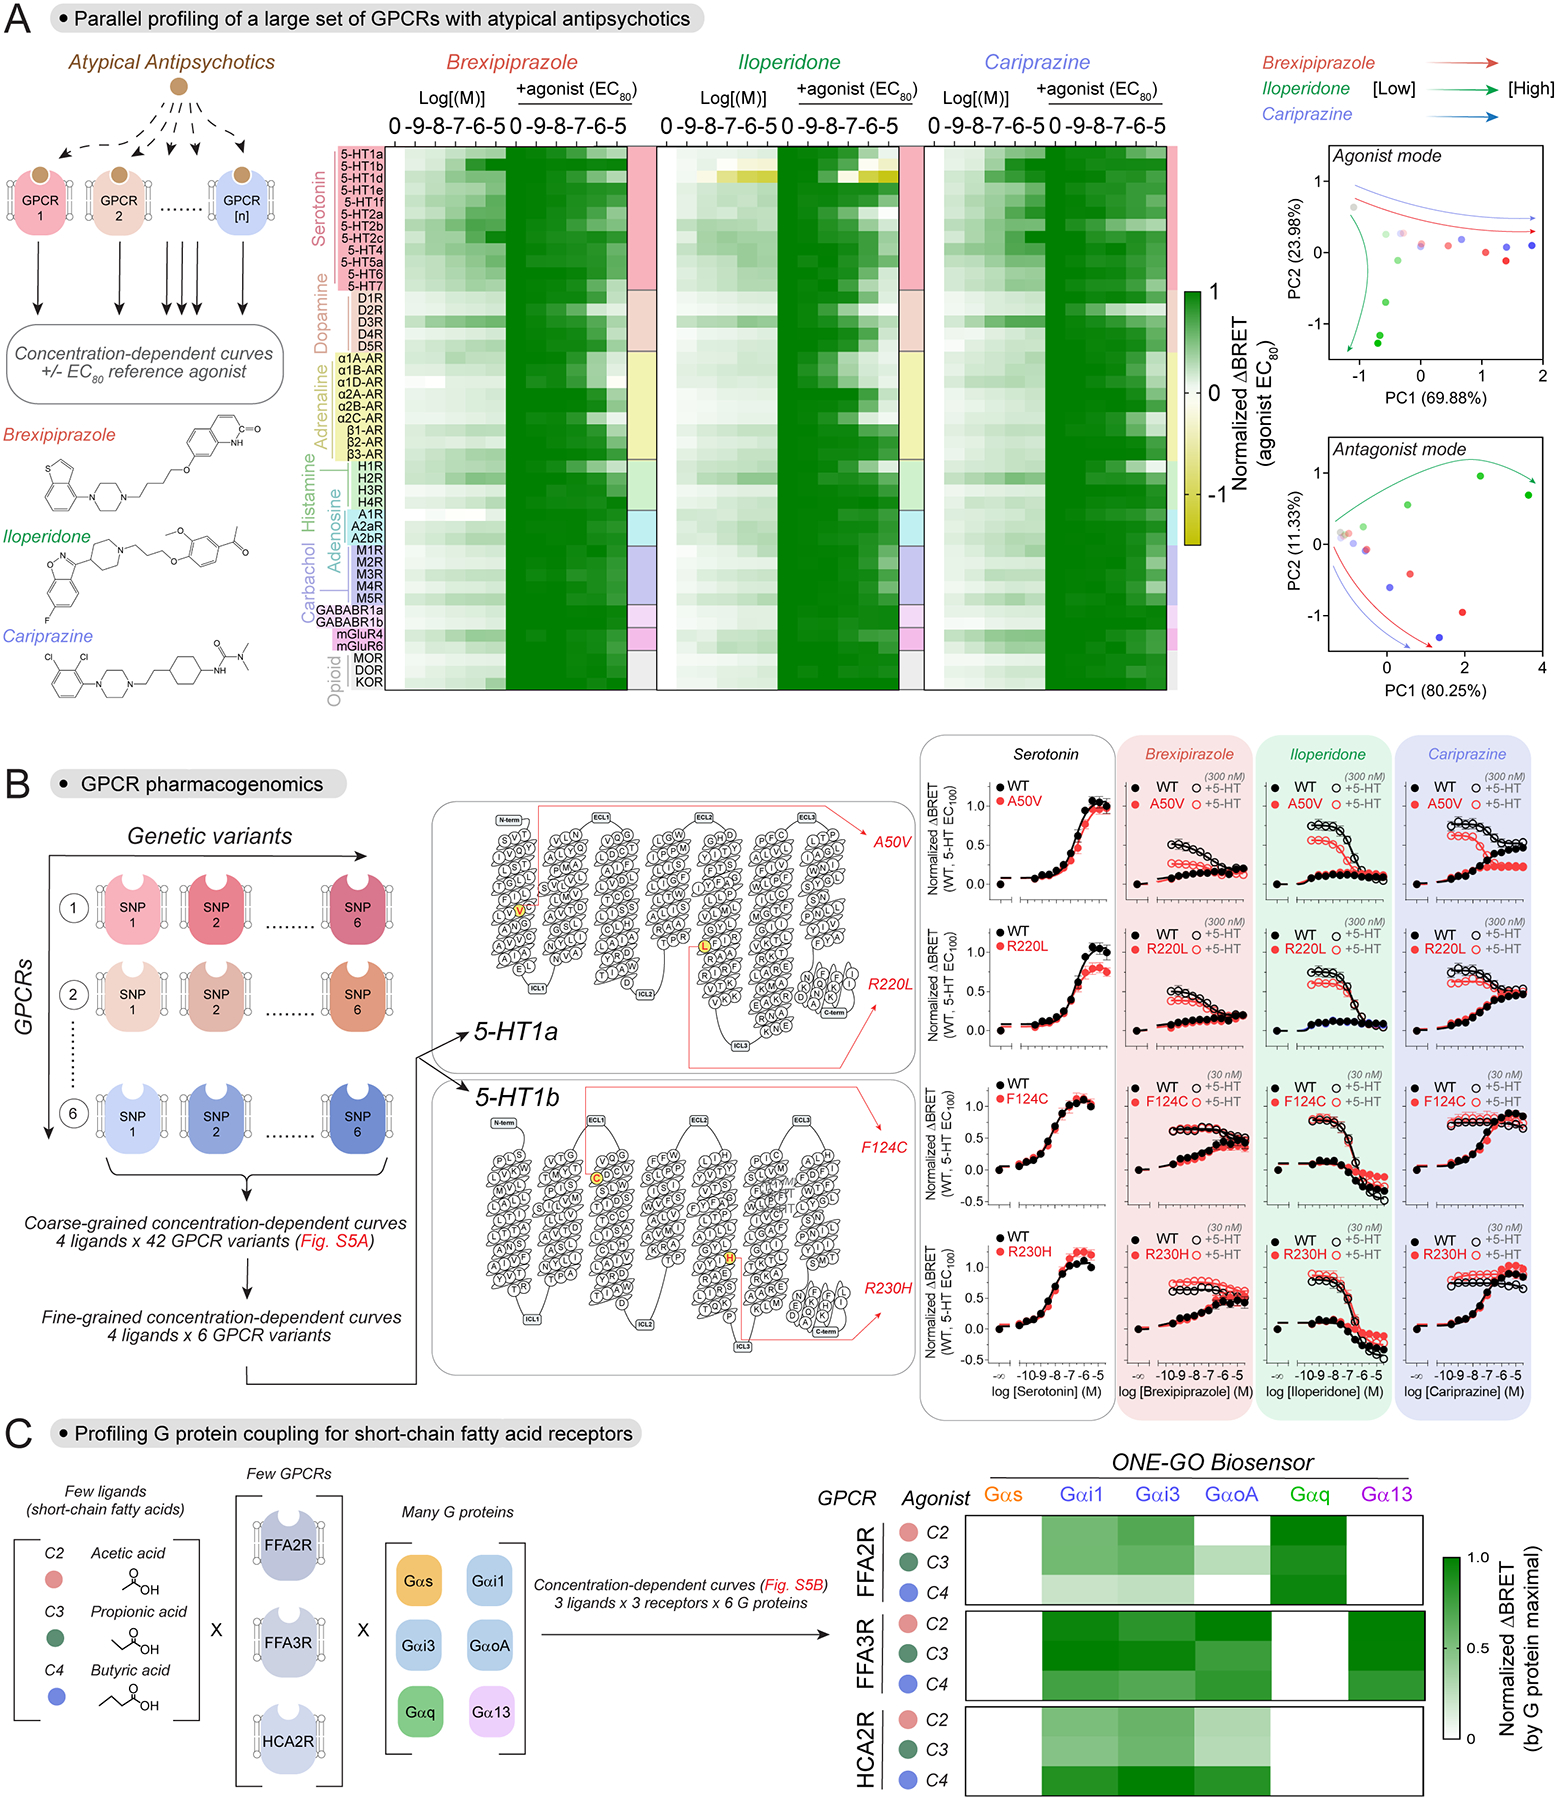
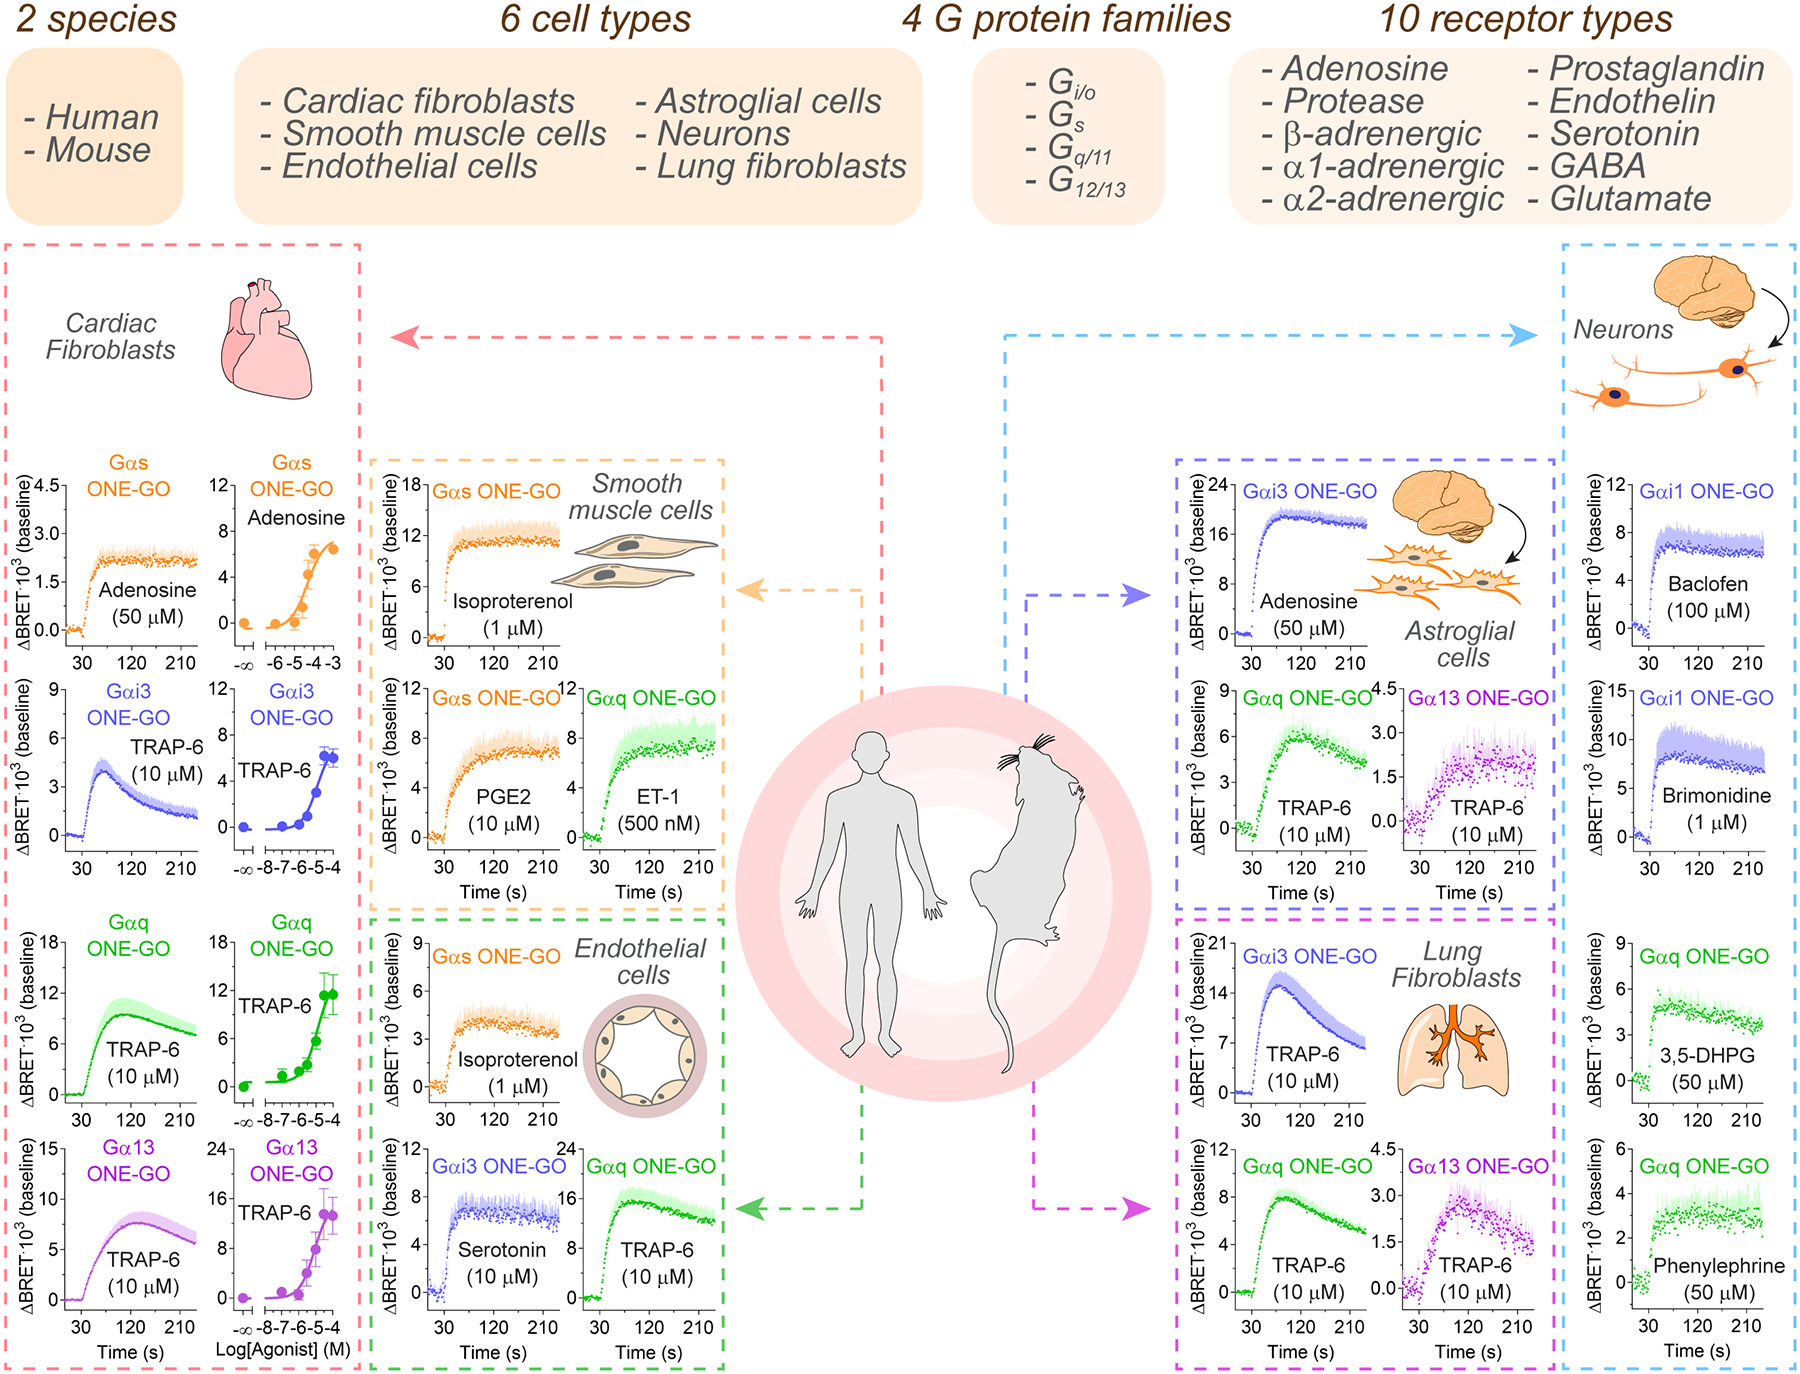
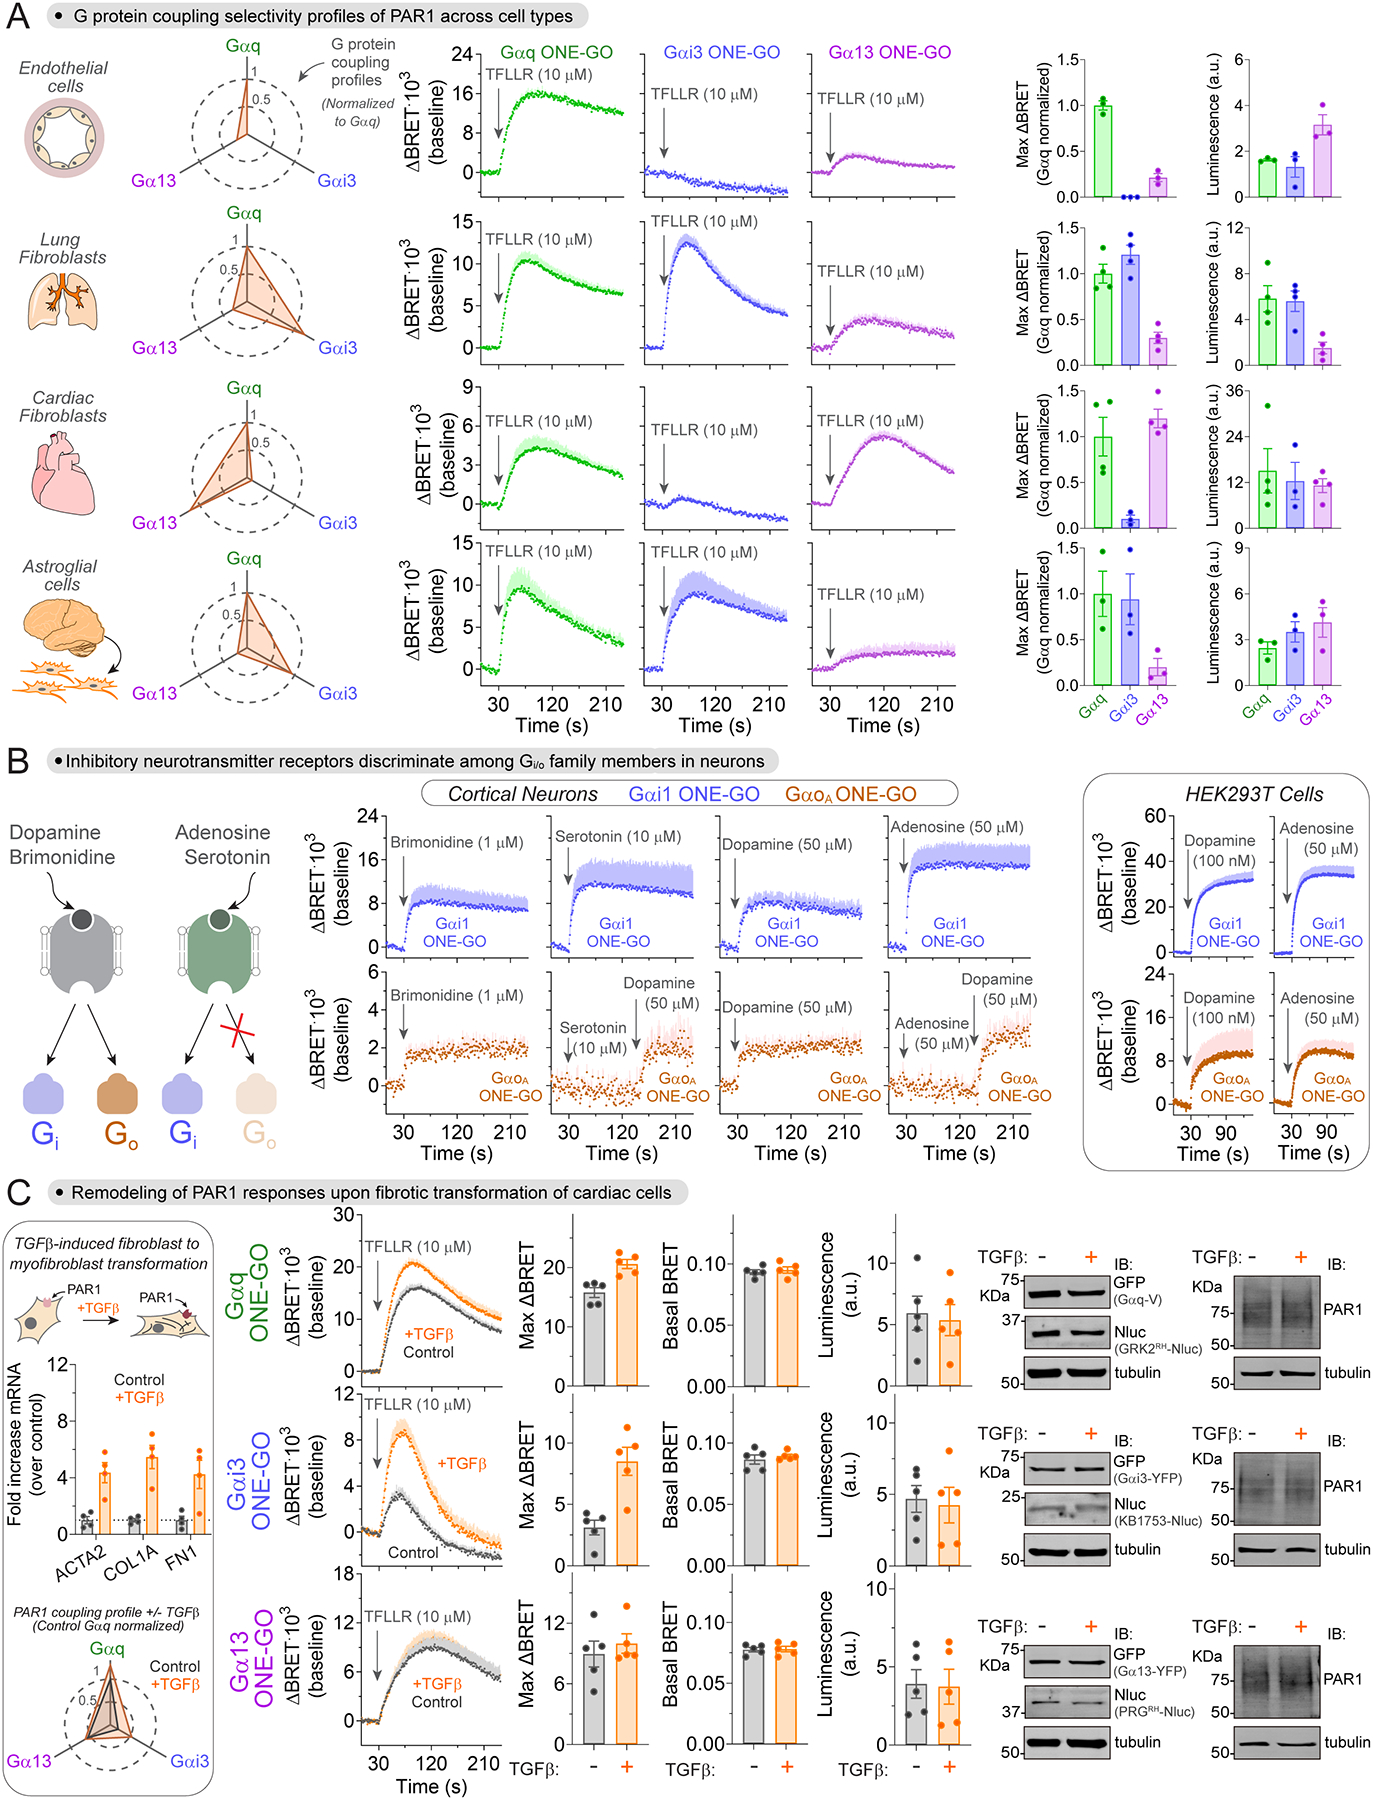
G protein-coupled receptors (GPCRs) are the largest family of druggable proteins encoded in the human genome, but progress in understanding and targeting them is hindered by the lack of tools to reliably measure their nuanced behavior in physiologically relevant contexts. Here, we developed a collection of compact ONE vector G-protein Optical (ONE-GO) biosensor constructs as a scalable platform that can be conveniently deployed to measure G-protein activation by virtually any GPCR with high fidelity even when expressed endogenously in primary cells. By characterizing dozens of GPCRs across many cell types like primary cardiovascular cells or neurons, we revealed insights into the molecular basis for G-protein coupling selectivity of GPCRs, pharmacogenomic profiles of anti-psychotics on naturally occurring GPCR variants, and G-protein subtype signaling bias by endogenous GPCRs depending on cell type or upon inducing disease-like states. In summary, this open-source platform makes the direct interrogation of context-dependent GPCR activity broadly accessible.

Keywords: BRET; G protein; GPCR; GTPase; antipsychotics; biased signaling; biosensor; drug discovery; fibrosis; neurotrasnmitter.


Conflict of interest statement

Declaration of interests The authors declare no conflict of interests.

Figures

Figure 1.
Figure 1.. Direct detection of active Gαs in cells with a BRET biosensor.
(A) Identification of Gαs-GTP peptide binders. Top, schematic of phage display screen. Bottom, pulldown of active, GDP-AlF4-loaded Gαs or Gαo with GST-fused peptides. From n ≥ 2. (B) Gαs-GTP biosensor using KB1691 and KB2123 peptides. Left, BRET assay principle. Center and left, BRET was measured in HEK293T cells expressing β2AR, Gαs-99V, Gβγ and either KB1691-Nluc or KB2123-Nluc. A representative kinetic trace is shown on the center panels, and the mean ± S.E.M. (n=4) for the concentration-dependent curves on the right. (C) Sensors based on KB1691, but not on KB2123, specifically detect Gαs. BRET was measured in HEK293T cells expressing the indicated G protein / cognate GPCR pairs and either KB1691-Nluc or KB2123-Nluc. Cells were stimulated with either 10 μM isoproterenol (Gαs), 5 μM brimonidine (Gαi3), 100 μM carbachol (Gαq), or 30 μM TRAP-6 (Gα13). Mean ± S.E.M. (n=3–4). (D) KB1691 does not interfere with Gαs-mediated cAMP production. Luminescence was measured in HEK293T cells expressing the cAMP probe Glosensor and exactly the same components as in panel B, except that KB1691-Nluc was omitted in the control. Mean ± S.E.M. (n=4).
Figure 2.
Figure 2.. Mechanism of Gαs activation by oncogenic mutations and of Gs coupling to GPCRs.
(A) Activation properties of oncogenic Gαs mutants. Left, view of Gαs nucleotide-binding pocket (PDB: 1AZT). Right, BRET was measured in HEK293T cells expressing the same components as in Fig.1B with KB1691-Nluc and the idnicated Gαs-99V constructs. Bar graph represents BRET signal relative to unstimulated Gαs-99V WT. Mean ± S.E.M. (n=4). Kinetic traces of cells expressing the same components are the difference in BRET from their corresponding unstimulated baselines. Mean ± S.E.M. (n=3). (B) View of structural elements of Gαs involved in coupling to β2AR based on their complex structure (PDB: 3SN6). (C, D) Contribution of the C-terminal tail (CT) and the αN/β1 ‘hinge’ of Gα subunits to their coupling to GPCRs. BRET was measured in HEK293T cells expressing the indicated YFP-tagged Gα chimeras, GPCRs, and Gβγ with either a Gαs-GTP biosensor (KB1691-Nluc, C) or a Gαi-GTP biosensor (KB1753-Nluc, D). Heat maps correspond to the mean (n=3–4) of efficacy of the BRET responses detected relative to the maximal response observed with the cognate WT G protein. Full concentration-dependence curves in Fig.S2.
Figure 3.
Figure 3.. ONE vector G protein Optical (ONE-GO) biosensor designs display improved features.
(A) Schematic of the process to develop ONE-GO biosensors. (B-C) Gαs and Gαi3 ONE-GO biosensor designs provide increased responses and reduced component expression. BRET was measured in HEK293T cells transfected with the indicated single-plasmid ONE-GO biosensors or their multi-plasmid (M-P) counterparts. β2AR or α2A-AR were co-expressed for Gαs (B) or Gαi3 (C), respectively. Mean ± S.E.M. (n=3). (D) ONE-GO biosensors do not interfere with GPCR-G protein signaling. Luminescence was measured in HEK293T cells expressing the cAMP probe Glosensor with or without the Gαs ONE-GO sensor (Left, endogenous β2AR) or Gαi3 ONE-GO sensor (Right, exogenous α2A-AR). Mean ± S.E.M. (n=3). Immunoblots show that ONE-GO sensors do not change the levels of endogenous G protein subunits.
Figure 4.
Figure 4.. ONE-GO biosensors report activation across G protein families and for many GPCRs.
(A) Ten ONE-GO biosensors report activity across all G protein families. Top, dendrogram of Gα subunits with their corresponding detector modules used in ONE-GO designs, and expression of biosensor components in HEK293T cells (n ≥ 3). Bottom, BRET in HEK293T cells expressing the indicated ONE-GO biosensors and GPCRs. Mean ± S.E.M. (n=3–5). (B) ONE-GO biosensors report the activity of dozens of GPCRs. Concentration-dependent BRET responses were measured in HEK293T cells for 75 GPCRs to determine EC50 values, which were plotted against curated pharmacological parameters (pKd, pKi, or pE/IC50) available in the IUPHAR database. (C) Activation profile of G proteins of the Gi/o family with ONE-GO biosensors upon stimulation of the MOR with six natural neuropeptide ligands. BRET in HEK293T cells expressing the MOR and the indicated ONE-GO biosensors upon stimulation with dynorphin A, Met-Enkephalin, Leu-Enkephalin, β-endorphin, endomorphin 1, or endomorphin 2. Mean ± S.E.M. (n=5–6). The heatmap shows mean pEC50 values. (D) Profiling the activation of different G proteins by the adhesion GPCR ADGRL3 using ONE-GO biosensors. Left, PAR1-ADGRL3 chimera activated by thrombin. Middle and Right, BRET in HEK293T cells expressing the indicated ONE-GO sensors and either the PAR1 receptor or the PAR1-ADGRL3 chimera upon stimulation with thrombin. The PAR1 antagonist vorapaxar was used to blunt G protein activation by endogenously expressed PAR1 receptors. Mean ± S.E.M. (n=3–4).
Figure 5.
Figure 5.. Large-scale parallel interrogation of GPCR activity with ONE-GO biosensors.
(A) Parallel profiling of atypical antipsychotics across a large set of receptors. Left, schematic of the assay and structure of the compounds investigated. Middle, BRET in HEK293T cells expressing the indicated GPCRs along with a cognate ONE-GO biosensor upon stimulation with the indicated concentrations of each antipshycotic alone or in presence of an agonist at its EC80 concentration (see [SI5] for details). Mean (n=3–7). Right, principal component analysis (PCA) of the data presented in the heatmaps. (B) Pharmacogenomic profiles of atypical antipsychotics. Left, schematic of the assay (coarse-grained curves shown in Fig.S5A). Middle, Snake plots for 5-HT1a and 5-HT1b showing genetic variants investigated on the right. Right, BRET in HEK293T cells expressing the indicated GPCRs and the Gαi1 ONE-GO sensor. The indicated compounds were tested by themselves (filled circles) or in presence of 5-HT (open circles). Mean ± S.E.M. (n=3–4). (C) Profiling of G protein selectivity across short-chain fatty acid receptors. Left, schematic of variables investigated. Right, BRET in HEK293T cells expressing the indicated GPCR / ONE-GO biosensor combinations upon stimulation with the indicated agonist. Results are maximal responses normalized by biosensor (mean, n=3–6). Full concentration-dependent curves in Fig.S5B.
Figure 6.
Figure 6.. Detection of endogenous GPCR activity across a wide palette of primary cells with ONE-GO biosensors.
Top, summary of responses triggered by endogenous GPCRs detected with ONE-GO biosensors for all G protein families in multiple human and mouse primary cells of different origins. Bottom, BRET responses were measured in the indicated primary cells transduced with ONE-GO biosensors. Mean ± S.E.M. (n=3–6). Additional examples and controls in Fig.S7.
Figure 7.
Figure 7.. ONE-GO biosensors reveal context-dependent activity of endogenous GPCRs.
(A) Cell type-dependent G protein selectivity profiles of PAR 1. Left, spider plot summarizing PAR1 G protein activation profiles for each cell type. Middle, BRET in each one of the 4 primary cell types transduced with the indicated ONE-GO biosensor. Right, maximal BRET responses normalized to Gαq ONE-GO and raw luminescence counts indicative of biosensor expression. Mean ± S.E.M. (n=3–4). (B) Discrimination across Gi/o isoforms by neuroinhibitory GPCRs in primary neurons. Left, BRET in primary mouse cortical neurons transduced with Gαi1 ONE-GO (top row, blue) or GαoA ONE-GO (bottom row, brown) biosensors stimulated with the indicated neurotransmitters. Mean ± S.E.M. (n=3–6). Right (box), BRET in HEK293T cells expressing either the D2R or the A1R along with the indicated ONE-GO biosensor. Mean ± S.E.M. (n=3). (C) Myofibroblast transformation remodels the G protein selectivity profile of PAR1. Left (box), confirmation of TGFβ-induced myofibroblast transformation by RT-qPCR (mean ± S.E.M., n=4), and spider plot summarizing PAR1 G protein activation profiles before and after myofibroblast transformation (mean, n=5). Middle, BRET in human cardiac fibroblasts transduced with the indicated ONE-GO biosensors and treated (orange) or not (grey) with TGFβ. Bar graphs represent from left to right: maximal BRET responses normalized to Gαq ONE-GO, BRET signal in unstimulated cells, and raw luminescence counts indicative of biosensor expression. Mean ± S.E.M. (n=5). Right, immunoblots showing no difference in expression of the biosensor components (Gα, Nluc) or PAR1 upon TGFβ treatment (from n=3).

Update of

Similar articles

Cited by

References

    1. Weis WI, and Kobilka BK (2018). The Molecular Basis of G Protein-Coupled Receptor Activation. Annu Rev Biochem 87, 897–919. 10.1146/annurev-biochem-060614-033910. - DOI - PMC - PubMed
    1. Wingler LM, and Lefkowitz RJ (2020). Conformational Basis of G Protein-Coupled Receptor Signaling Versatility. Trends in cell biology 30, 736–747. 10.1016/j.tcb.2020.06.002. - DOI - PMC - PubMed
    1. Wootten D, Christopoulos A, Marti-Solano M, Babu MM, and Sexton PM (2018). Mechanisms of signalling and biased agonism in G protein-coupled receptors. Nat Rev Mol Cell Biol 19, 638–653. 10.1038/s41580-018-0049-3. - DOI - PubMed
    1. Hauser AS, Attwood MM, Rask-Andersen M, Schiöth HB, and Gloriam DE (2017). Trends in GPCR drug discovery: new agents, targets and indications. Nature Reviews Drug Discovery 16, 829–842. 10.1038/nrd.2017.178. - DOI - PMC - PubMed
    1. Sriram K, and Insel PA (2018). G Protein-Coupled Receptors as Targets for Approved Drugs: How Many Targets and How Many Drugs? Mol Pharmacol 93, 251–258. 10.1124/mol.117.111062. - DOI - PMC - PubMed

MeSH terms

Substances

LinkOut - more resources