

Development and evaluation of nomograms and risk stratification systems to predict the overall survival and cancer-specific survival of patients with hepatocellular carcinoma
- PMID: 38413421
- PMCID: PMC10899391
- DOI: 10.1007/s10238-024-01296-1
Development and evaluation of nomograms and risk stratification systems to predict the overall survival and cancer-specific survival of patients with hepatocellular carcinoma
Abstract
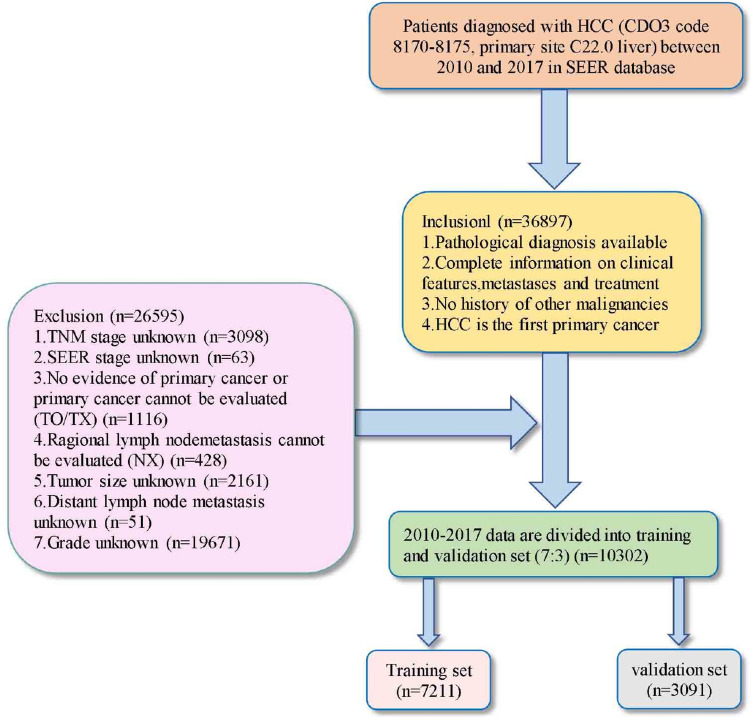
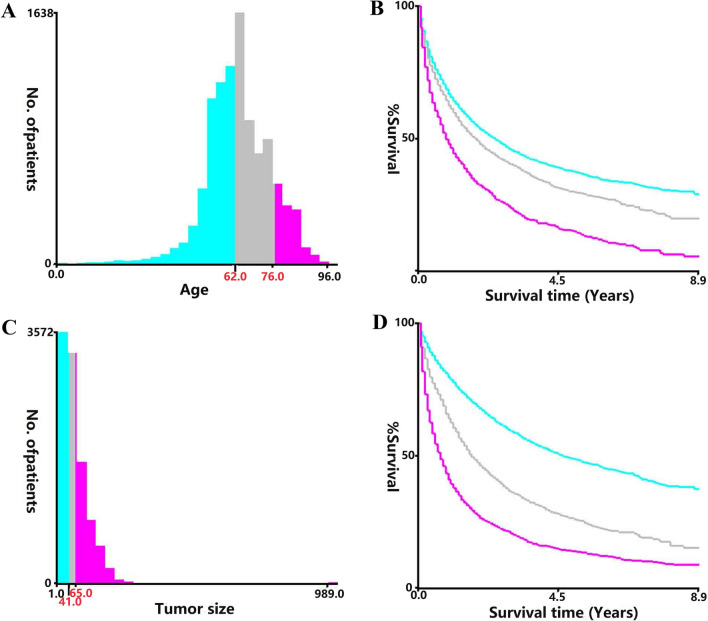
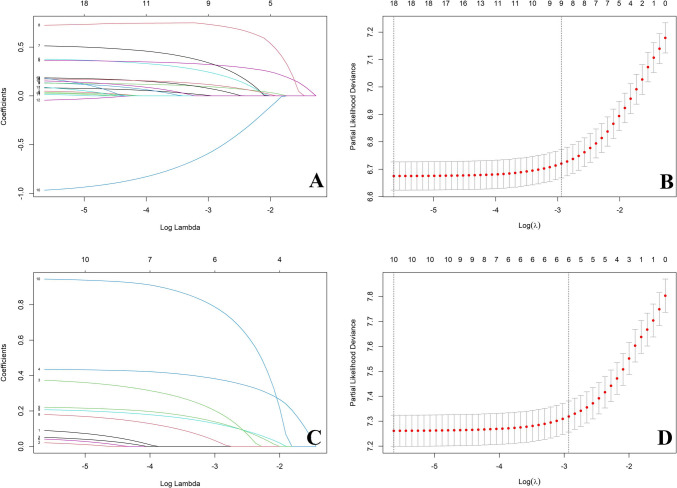
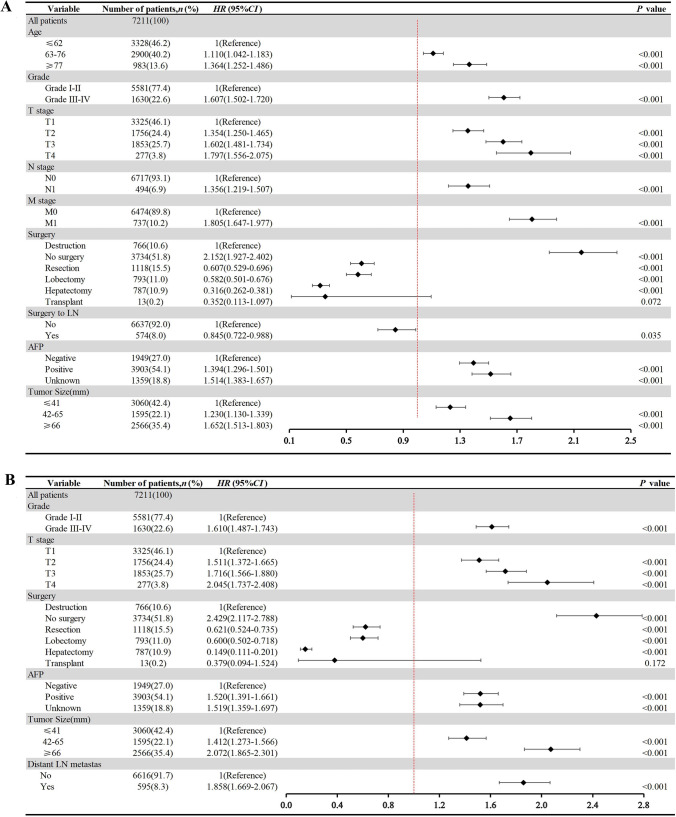
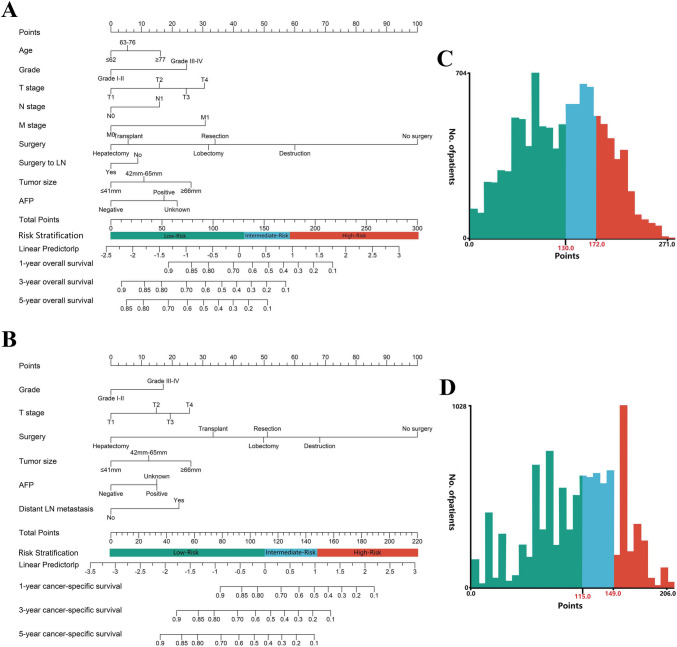
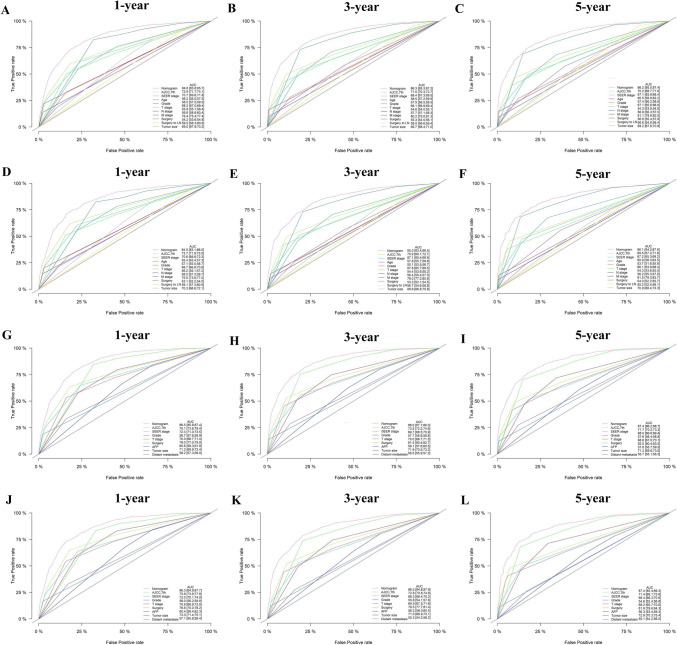
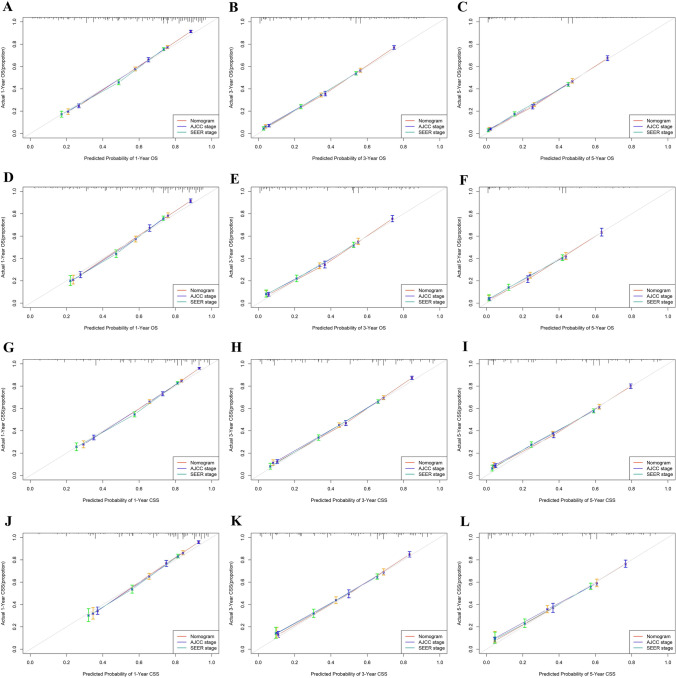
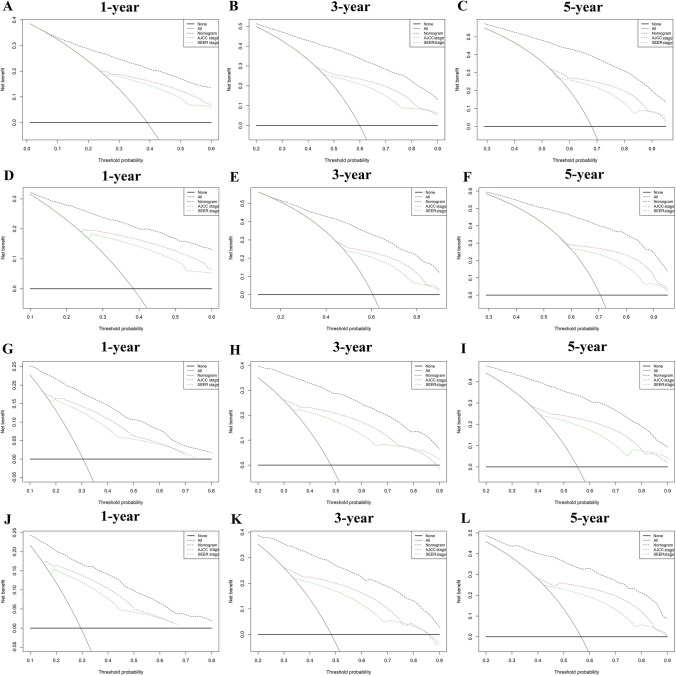
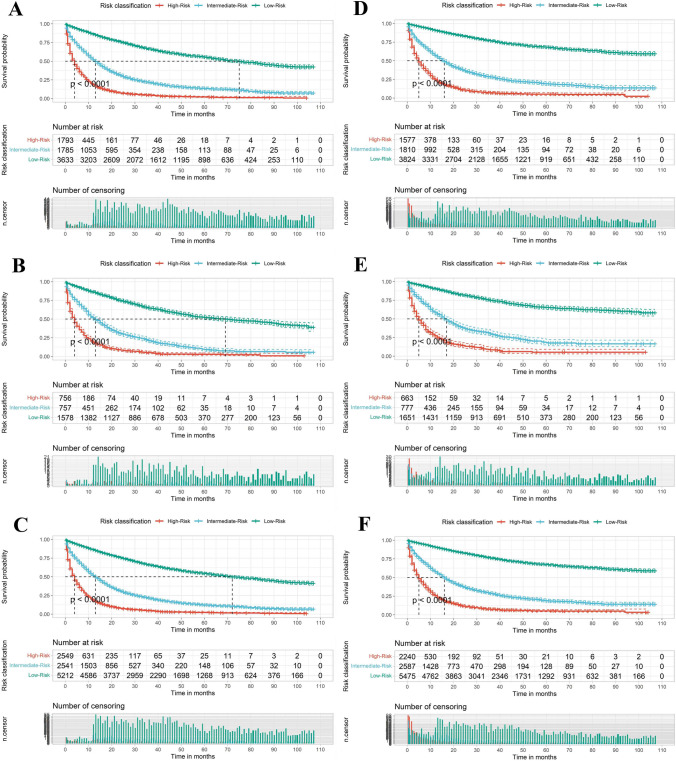
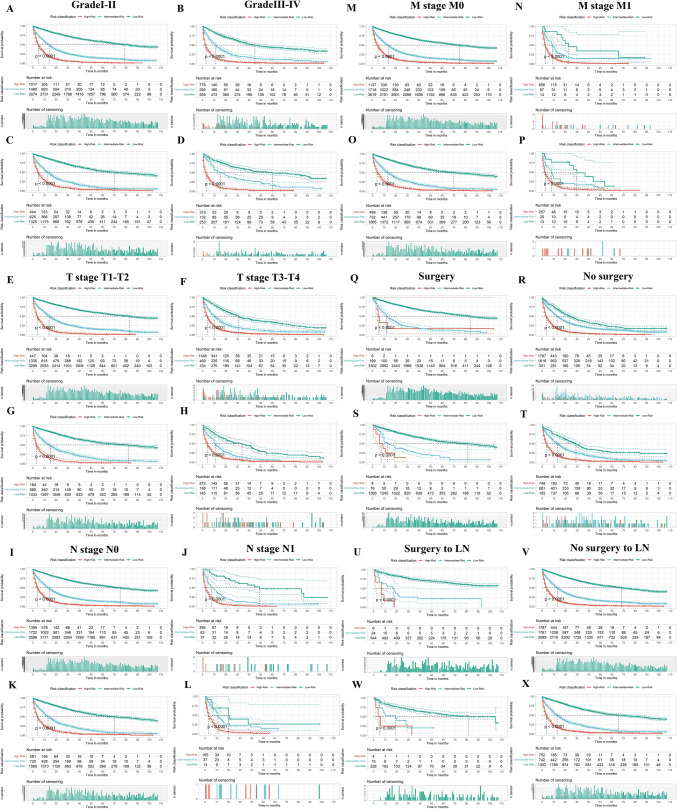
Hepatocellular carcinoma (HCC) is the most common type of primary liver cancer, and patients with HCC have a poor prognosis and low survival rates. Establishing a prognostic nomogram is important for predicting the survival of patients with HCC, as it helps to improve the patient's prognosis. This study aimed to develop and evaluate nomograms and risk stratification to predict overall survival (OS) and cancer-specific survival (CSS) in HCC patients. Data from 10,302 patients with initially diagnosed HCC were extracted from the Surveillance, Epidemiology, and End Results (SEER) database between 2010 and 2017. Patients were randomly divided into the training and validation set. Kaplan-Meier survival, LASSO regression, and Cox regression analysis were conducted to select the predictors of OS. Competing risk analysis, LASSO regression, and Cox regression analysis were conducted to select the predictors of CSS. The validation of the nomograms was performed using the concordance index (C-index), the Akaike information criterion (AIC), the Bayesian information criterion (BIC), Net Reclassification Index (NRI), Discrimination Improvement (IDI), the receiver operating characteristic (ROC) curve, calibration curves, and decision curve analyses (DCAs). The results indicated that factors including age, grade, T stage, N stage, M stage, surgery, surgery to lymph node (LN), Alpha-Fetal Protein (AFP), and tumor size were independent predictors of OS, whereas grade, T stage, surgery, AFP, tumor size, and distant lymph node metastasis were independent predictors of CSS. Based on these factors, predictive models were built and virtualized by nomograms. The C-index for predicting 1-, 3-, and 5-year OS were 0.788, 0.792, and 0.790. The C-index for predicting 1-, 3-, and 5-year CSS were 0.803, 0.808, and 0.806. AIC, BIC, NRI, and IDI suggested that nomograms had an excellent predictive performance with no significant overfitting. The calibration curves showed good consistency of OS and CSS between the actual observation and nomograms prediction, and the DCA showed great clinical usefulness of the nomograms. The risk stratification of OS and CSS was built that could perfectly classify HCC patients into three risk groups. Our study developed nomograms and a corresponding risk stratification system predicting the OS and CSS of HCC patients. These tools can assist in patient counseling and guiding treatment decision making.
Keywords: Cancer-specific survival; Hepatocellular carcinoma; Nomogram; Overall survival; Risk stratification.
© 2024. The Author(s).
Conflict of interest statement
The authors declare that the research was conducted in the absence of any commercial or financial relationships that could be construed as a potential conflict of interest.
Figures
Similar articles
-
Construction of web-based prediction nomogram models for cancer-specific survival in patients at stage IV of hepatocellular carcinoma depending on SEER database.Zhong Nan Da Xue Xue Bao Yi Xue Ban. 2023 Oct 28;48(10):1546-1560. doi: 10.11817/j.issn.1672-7347.2023.230040. Zhong Nan Da Xue Xue Bao Yi Xue Ban. 2023. PMID: 38432884 Free PMC article. Clinical Trial.
-
A nomogram to predict postoperative overall and cancer specific survival in patients with primary parotid squamous cell carcinoma: a population based study.Sci Rep. 2025 Feb 25;15(1):6774. doi: 10.1038/s41598-025-90480-8. Sci Rep. 2025. PMID: 40000793 Free PMC article.
-
Nomograms for predicting overall survival and cancer-specific survival in elderly patients with epithelial ovarian cancer.J Ovarian Res. 2023 Apr 14;16(1):75. doi: 10.1186/s13048-023-01144-y. J Ovarian Res. 2023. PMID: 37059991 Free PMC article. Clinical Trial.
-
Establishment of a prognostic nomogram and risk stratification system for patients with distant-metastatic hepatocellular carcinoma: A population-based study.Medicine (Baltimore). 2025 Jun 13;104(24):e42834. doi: 10.1097/MD.0000000000042834. Medicine (Baltimore). 2025. PMID: 40527819 Free PMC article.
-
Development and validation of web-based prognostic nomograms for massive hepatocellular carcinoma (≥10 cm): A retrospective study based on the SEER database.Cancer Med. 2023 Jun;12(12):13167-13181. doi: 10.1002/cam4.6003. Epub 2023 Apr 27. Cancer Med. 2023. PMID: 37102245 Free PMC article.
Cited by
-
Lymph node metastasis in patients with hepatocellular carcinoma using machine learning: a population-based study.Front Oncol. 2025 Jul 11;15:1601985. doi: 10.3389/fonc.2025.1601985. eCollection 2025. Front Oncol. 2025. PMID: 40718824 Free PMC article.
-
Nomogram establishment for gastrointestinal bleeding prediction in ICU patients with traumatic brain injury based on the MIMIC-IV database.Front Med (Lausanne). 2025 Apr 14;12:1523535. doi: 10.3389/fmed.2025.1523535. eCollection 2025. Front Med (Lausanne). 2025. PMID: 40297154 Free PMC article.
References
-
- Llovet JM, et al. Hepatocellular carcinoma. Nat Rev Dis Prim. 2021;7:6. 10.1038/s41572-020-00240-3. - PubMed
-
- Villanueva A. Hepatocellular carcinoma. N Engl J Med. 2019;380:1450–62. 10.1056/NEJMra1713263. - PubMed
-
- Fu J, Wang H. Precision diagnosis and treatment of liver cancer in China. Cancer Lett. 2018;412:283–8. 10.1016/j.canlet.2017.10.008. - PubMed
Publication types
MeSH terms
Substances
Grants and funding
LinkOut - more resources
Full Text Sources
Medical
